INTRODUCTION
In recent years, the study of the spinel MGa2O4 (M= Zn, Mg) has attracted much attention due to its high electrical resistivity and interesting magnetic properties such as low coercivity, low magnetic losses, low remanence, low saturation magnetization, and low coercive ield [1, 2]. In normal spinel the oxygen ions are positioned in a face-centered cubic closed-packed arrangement with metal ions occupying the interstices. The unitary cell contains 32 oxygen atoms with 96 interstices (32 B3+ octahedral sites and 64 tetrahedrally coordinated A2+ sites) [3, 4]. The MgGa2O4 has a partially inverted spinel structure belonging to the space group Fd3m with cell parameter a= 8.2733 Å [4, 5]. In the inverted spinel, the B3+ cations occupy tetrahedral
Magnetic properties and potential barrier between crystallites
model of MgGa
2-xFe
xO
4ceramics
(Propriedades magnéticas e modelo de barreiras de potencial
entre cristalitos de cerâmicas de MgGa
2-xFe
xO
4)
V. A. dos S. Ribeiro*, R. M. Rubinger, A. F. Oliveira, C. S. P. Mendonça, M. R. da Silva Instituto de Física e Química, Universidade Federal de Itajubá, Itajubá, MG, Brazil 37500-903
*[email protected], [email protected], [email protected], [email protected], [email protected]
Abstract
The aim of this work was to investigate the magnetic properties and the electrical conductivity temperature dependence associated to the potential barrier between the crystallites model. Gallium and magnesium containing spinel ceramic has low magnetic coercivity and high electrical resistivity. MgGa2-xFexO4 samples (x= 0.01, 0.05, 0.15, 0.25, 0.35) were prepared by solid-state method and sintered at
800 °C for 8 h. X-ray diffraction analysis conirmed the formation of a single phase with compact cubic spinel structure. The magnetic measurements show that the saturation magnetization and remanence of all samples increased with increasing iron concentration. The coercive ield decreased up to the concentration x= 0.15, and above x= 0.25 it was observed an increase in the coercive ield. Through electrical characterization it was found that the samples presented highly insulating behavior for x= 0.01, and further increase in x above 0.15 gives a semiconductor behavior compatible with the potential barrier between the crystallites model, i.e. fulills the condition L/2 > LD (crystallite size L in comparison with the Debye length LD), and the conduction is limited by potential barriers between the crystallites. Keywords: spinel, magnetic properties, potential barrier.
Resumo
O objetivo deste trabalho foi investigar as propriedades magnéticas e a dependência da condutividade elétrica com a temperatura associada ao modelo de barreiras de potencial entre os cristalitos. A cerâmica de espinélio de gálio e magnésio possui baixa coercividade magnética e alta resistividade elétrica. As amostras de MgGa2-xFexO4 (x= 0,01, 0,05, 0,15, 0,25, 0,35) foram preparadas pelo método de estado sólido e sinterizada a 800 °C durante 8 h. A análise de difração de raio X conirmou a formação de única fase com estrutura de espinélio cúbico compacto. As medições magnéticas mostraram que a magnetização de saturação e remanescência de todas as amostras aumentaram com a concentração de ferro. O campo coercitivo diminuiu até a concentração x= 0,15 e acima de x= 0,25 observou-se um aumento no campo coercivo. Através da caracterização eléctrica veriicou-se que as amostras apresentaram comportamento isolante para x= 0,01 e acima de x= 0,15 observou-se um comportamento semicondutor compatível com o modelo de barreira de potencial entre cristalitos, ou seja, preenche a condição de L/2 > LD (tamanho de cristalito L em comparação com o comprimento de Debye) e a
condução é limitada por barreiras de potencial entre os cristalitos.
Palavras-chave: espinélio, propriedades magnéticas, barreira de potencial.
sites while A2+ and B3+ cations are distributed randomly on octahedral sites.
a large number of defects, which act as effective carrier traps [9, 10]. This model states that, when the trapping states in crystallite region are unoccupied, they create a depletion region in the crystallite and a potential barrier at the interface [9, 10]. This reduces the number of free carriers available for electrical conduction. In this work, the investigations are extended by studying magnetic properties and the temperature dependent conductivity of these ceramic materials in terms of potential barrier between the crystallites model.
EXPERIMENTAL
MgGa2-xFexO4 samples with stoichiometry x= 0.01, 0.05, 0.15, 0.25 and 0.35 were prepared by solid-state method using MgO, Ga2O3 and Fe2O3 (99.9% purity, Sigma-Aldrich). Initially, the oxides were weighed, taking into account the stoichiometry x and mixed and ground in an agate mortar for about 1 h. Using a uniaxial press, the samples were compacted up to apressureof 293 MPa and inally sintered at 800 °C for 8 h in ambient atmosphere.
X-ray diffraction analyzes were performed using a diffractometer (URD 65, Seifert & Com. ID 3000) using CuKa radiation in the 2q range of 10° to 70° with a step
size of 0.02° and counting time of 2 s. The identiication of the phases was carried out using the PDF2-ICDD database of software High Score Plus. The average crystallite size of the particles was determined by using the Debye-Scherrer formula. Magnetic hysteresis loops M (H) were measured using a Lakeshore 7404 vibrating sample magnetometer (VSM) in the magnetic ield range of 10 kG at room temperature. The magnetization was measured as a function of the temperature using a high temperature attachment from Princeton Applied Research, 151 M, from room temperature to 1000 °C. The DC resistivity (ρ) of the samples was measured by two-probe as a function of temperature. Due to high resistivity of ferrite samples, two probe method is useful for ceramics; the measurements were taken in the range of temperature between 300 to 725 K. The real part (Z’) and imaginary part(-Z”) of the complex impedance of the samples were obtained by the impedance analyzer. The permittivity was calculated from the values of Z, obtained by itting the complex impedance plots and the sample dimensions. The capacitance was measured using Novo Control Technologies, Apha A High Performance Frequency Analyzer, at room temperature and then the dielectric permittivity was calculated within frequency range of 1 Hz to 40 MHz.
RESULTS AND DISCUSSION
Fig. 1 shows the X-ray diffraction patterns obtained using CuKa radiation. The diffraction peaks clearly provide
evidence for the formation of series of solid solution between MgGa2O4 (JCPDF 01-072-1520) and MgFe2O4 (JCPDF 01-088-1943). Diffraction patterns of these compounds show the typical diffraction peaks of the same basic structure,
as the MgGa2O4 - MgFe2O4. It was observed in all iron concentration range the development of a compact single-phase cubic spinel type structure.
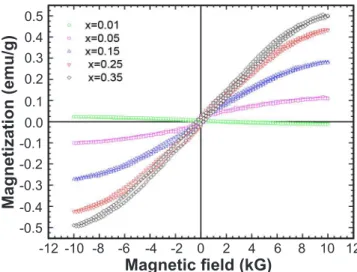
Fig. 2 shows magnetic hysteresis loops of MgGa2-xFexO4. It was possible to determine the values of some parameters such as coercive ield (Hc), remanent magnetization (Mr),
and saturation magnetization (Ms). Through the magnetic
hysteresis loops, it can be seen that the samples did not reach the magnetic saturation at low ields, same behavior presented by Ga-substituted MnFe2O4 [11].
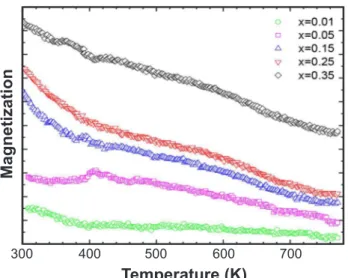
The temperature dependence of the magnetization for all samples of MgGa2-xFexO4 is shown in Fig. 3. It can be seen from this igure that all samples studied have ferromagnetic ordering below Curie temperature (Tc) while
the spontaneous magnetization increases with increasing the Fe3+ concentration (x). It is clear that the magnetization decreased with the increases in temperature, as would be expected from a system with ferromagnetic coupling below Tc. It is also clear that Tc increase with increasing x. This
Figure 1: X-ray diffraction patterns of MgGa2-xFexO4 samples.
[Figura 1: Difratogramas de raios X de amostras de MgGa2-xFexO4.] 15
2q (degree)
In
te
n
s
ity
35 55
25 45 65
20 30 40 50 60 70 75
Figure 2: Hysteresis loops for the MgGa2-xFexO4 samples. [Figura 2: Ciclo de histerese para as amostras de MgGa2-xFexO4.]
0.5
0.1 0.3
-0.1
-0.4 -0.2
-0.5
-12
Magnetic ield (kG)
Ma
g
n
e
ti
za
ti
o
n
(e
m
u
/g
)
-8 -4 0
-10 -6 -2 2 4 6 8 10 12
-0.3 0.4
is the expected behavior since the paramagnetic part of the Ga3+ ions was replaced by the ferromagnetic Fe3+ ions. This change on the cation distribution implies that the magnetic interactions between the magnetic ions on the octahedral sites are increased. Two slopes are observed indicating a two-step decay of the magnetization. All samples present a change in the decay slope of the magnetization close to 400 K and Curie temperature above 700 K that are listed in Table I, except for the sample with x= 0.01 that shows diamagnetic behavior, so it does not present Curie temperature [12]. Gilleo [13] indicated that the Curie temperature depends primarily upon the dominant [Fe3+–O2-–Fe3+] linkages at tetrahedral and octahedral sites. The gallium ion, being diamagnetic, does not directly participate in the exchange interaction [14]. Probably the change in the decay slope is associated with the paramagnetic Ga3+ ions role and the T
c is
due to the Fe3+ ions role on the magnetization of the samples [11, 12]. From the sample with x= 0.05 it was observed a change in concavity of the curve with paramagnetic material characteristics.
Table I shows the results of the magnetic parameters,
remanent magnetization (MR), coercivity (HC), saturation
magnetization (MS) and Curie temperature (Tc), of all
samples obtained from the hysteresis and the magnetization-temperature curves. It can be seen that the values of saturation magnetization and remanence increased with increasing iron concentration. If the Ga3+ ions were supposed to enter only into the tetrahedral sites, even for small Ga concentration, the Ga3+ ions will cause Fe3+ ions to displace from tetrahedral to octahedral sites leading to an increase in magnetization which is observed in Table I [11]. The coercive ield was unable to be determined for sample with x= 0.01, and from x= 0.05 to 0.15 it decreased with the concentration. From x= 0.25 is observed an increase in the coercive ield with x.
Samples with x up to 0.15 were highly insulating and, for this reason, electrical measurements were only possible to be obtained in a.c. Samples with x= 0.25 and x= 0.35 presented a semiconductor behavior which can be interpreted in the framework of the potential barrier between the crystallites model. Potential barrier between the crystallites model considers the electrical transport resistivity (ρ) of thermally activated band conduction, expressed by Equation A [9, 10]:
2pm*kBT Le2n
Eb kBT exp
r= (A)
where, e is the electron charge, n is the electron concentration in neutral region of the crystallites, L is the mean size of the crystallites, kB is the Boltzmann’s constant, m* is the
effective mass of charge carriers, and Ebis the energy barrier height between the crystallites, which can be expressed by Equation B [9, 10]:
L2e2N d 8e
EB= (B)
where, ε is the low frequency relative dielectric permittivity, and Nd is the donor density. This effect can be veriied by evaluation of the Debye screening length (LD) in comparison with the crystallites size (L). LD is given by [9, 10]:
kBTe0e e2N
d
LD= (C)
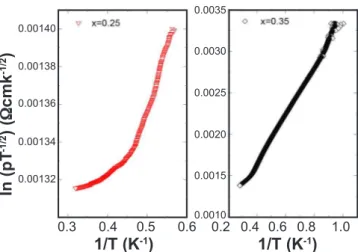
where, ε0 is the vacuum dielectric constant. If LD < L/2, charge carriers remain conined to the grains and potential barriers between the crystallites region due to interface trap states. If, however, LD> L/2, the barrier limited conductivity mechanism dominates and the electrons are transported with negligible grain boundary scattering [9, 10]. It was examined the plots of ln(ρT−1/2) vs. 103/T for all samples. The large linear temperature region of the plots observed in Fig. 4 reveals that, for the studied domain of the temperature, is an evidence that the crystallites scattering of the charge carriers dominates in the investigated samples [9].
In order to complete veriication of the potential barrier
Figure 3: Magnetization temperature dependences measured for all MgGa2-xFexO4 samples.
[Figura 3: Dependência da magnetização com a temperatura medida para todas as amostras de MgGa2-xFexO4.]
300
Temperature (K)
Ma
g
n
e
ti
za
ti
o
n
500 700
400 600
Sample MR (emu/g) HC (G) MS (emu/g) Tc (K)
x=0.01 0.004 --- 0.016
---x=0.05 0.015 288.15 0.105 733.38
x=0.15 0.020 254.56 0.275 735.97
x=0.25 0.025 256.13 0.425 736.61
x=0.35 0.028 277.57 0.495 753.39
Table I - Remanent magnetization (MR), coercivity (HC),
saturation magnetization (MS), and Curie temperature (Tc)
for all MgGa2-xFexO4 samples.
between the crystallites model, it is necessary to measure the dielectric permittivity for all samples. The dielectric permittivity of all samples have been calculated considering a.c. capacitance measurements in the frequency range of 1 Hz to 40 MHz and Equation D. In this equation, C is the capacitance of the pellet, d is the thickness of the pellet, A is the cross-sectional area of the lat surface of the pellet, and
e0 is the permittivity constant of free space.
Cd
e0A
e= (D)
The frequency dependence of dielectric permittivity of all samples is shown in Fig. 5. It is observed that the dielectric permittivity of all samples decreases with increasing frequency. The dielectric permittivity of these samples may be related to the space-charge polarization since higher conductivity grains are separated by insulating grain boundaries which produces localized accumulation of charge under the inluence of an alternated electric ield [15]. According to Maxwell and Wagner two-layer model, space-charge polarization is due to the inhomogeneous dielectric structure of the material [15, 16]. A similar variation of the dielectric constant with frequency was observed in the case of ZnFe2O, MnFe2O4 [17], ZnxCu1-xFe2O4 and MnxCu1-xFe2O4 [18] ferrite systems. Koops [19] proposed that the effect of grain boundaries is predominant at low frequencies; the thinner the grain boundary, the value of dielectric constant is higher. It is seen that the value of the dielectric constant is very high at low frequencies and decreases with increasing frequency, and then at higher frequency they become almost constant. The decrease in dielectric constant value with increasing frequency is attributed to the fact that the electron exchange between Fe2+ and Fe3+ ions cannot follow the change of the external applied ield beyond certain frequency [16, 20]. At low frequencies, grain boundaries are more effective than grain electrical conduction. The higher
value of dielectric constant at low frequency is due to voids, dislocations and other defects [16, 20]. In the high frequency range, which corresponds to low resistivity due to the grains, a small energy is needed for electron transfer between Fe2+ and Fe3+ ions in grains and accompanied by a small eddy current and hence a decrease in the energy loss in all samples [16, 20].
The complex-plane impedance spectrum of samples measured at room temperature is shown in Fig. 6. The impedance spectroscopy is widely used to characterize the electrical properties of materials and interfaces present in these materials. The impedance measurements data gives both resistive (real) and reactive (imaginary) components for a material. To separate the grain and grain boundary contributions of the samples, complex impedance plane plots have been drawn in the frequency range at room temperature. It is clear from Fig. 6 that all the samples show
Figure 5: Frequency dependence of dielectric permittivity for all samples.
[Figura 5: Dependência da permissividade dielétrica com a frequência para todas as amostras.]
Figure 4: Inverse temperature dependence of the resistivity [ln(rT-1/2)].
[Figura 4: Dependência da resistividade [ln(rT-1/2)] com o inverso
da temperatura.]
0.3
0.0035
0.0030
0.0025
0.0020
0.0015
0.0010 0.00138
0.00140
0.00136
0.00134
0.00132
1/T (K-1)
In
(p
T
-1
/2)
(
W
c
m
k
-1
/2)
1/T (K-1)
0.2
0.5 0.6
0.4 0.6 0.4 0.8 1.0
500
300
100 400
200
0
100
F (Hz)
e
`
104
102 106
101 103 105 107
Figure 6: Complex impedance spectra for all samples.
[Figura 6: Espectro de impedância complexa para todas as amostras.]
1.5x10⁹
1.0x10⁹
0.5x10⁹
0.5x10⁸ 1.0x10⁸ 1.5x10⁸
0.0 0.0
Z' (W)
Z
"
(
W
one incomplete arc due to grain boundary conduction. The incomplete circular arc in low frequency region shows that grain boundary resistance is out of measurement scale or presence of some additional relaxation phenomena which occur outside the measured frequency range.
Now, considering the static permittivity e as the lowest frequency mean value at the lattest part of the results of Fig. 5, it can be proceeded to the potential barrier between the crystallites model. From the curves of Fig. 4, the values of Eb were calculated from the slopes of the linear dependences and their values are shown in Table II. Then, it was determined the concentration of donors (Nd) values using the Equation B. Identifying the ND values, the values of the Debye length (LD) was calculated using Equation C, which values are given in Table II. Applying the potential barrier between the crystallites model in the samples with x= 0.25 and 0.35 it was found that the barriers deined the conduction mechanism since for both samples LD < L/2. The Eb value for both samples was, however, small, which agrees with the small difference between L/2 and LD, meaning that further increase in x would lead to a sample with no barrier between the crystallites.
CONCLUSIONS
The XRD patterns of the samples showed the same diffraction peaks typical of basic structure, as the MgGa2O4 - MgFe2O4 and conirmed the formation of a single phase cubic spinel structure. Through the hysteresis loops, the samples showed characteristics of a soft magnetic material. From the data, it is observed that the saturation magnetization and remanence of the samples increase with increasing iron concentration. The coercive ield decreases to the concentration with x= 0.15, and from x= 0.25 is observed an increase in the coercive ield. The samples studied have ferromagnetic ordering below Curie temperature (Tc) while
the spontaneous magnetization increases with increasing the Fe3+ concentration (x). Magnetization decreases with the increase in temperature, as would be expected from a system with ferromagnetic coupling below Tc. The resistivity for the
samples with x= 0.25 and 0.35 decreases with the increase in temperature showing a semiconductor behavior, and the
Sample Eb (meV) e Nd (m-3) LD (nm) L (nm)
0.25 15.53 186.81 6.31 x 10²² 28.90 142.5 0.35 19.63 23.67 1.01 x 10²² 23.43 142.4 Table II - Values of barrier height (EB), dielectric permittivity (e), donor concentration (Nd), average crystallite size (L), and Debye screening length (LD).
[Tabela II - Valores de altura da barreira (EB), permissividade dieléctrica (e), concentração dos doadores (Nd), tamanho
médio de cristalito (L) e comprimento de Debye (LD).]
samples with x= 0.01 to 0.25 showed the behavior of an insulating material. Applying the potential barrier between the crystallites model in the samples with x= 0.25 and 0.35, it was found that energy barriers between the crystallites limits the conduction of the samples with energies lower than 20 meV.
ACKNOWLEDGMENTS
The authors are thankful to CNPq, CAPES and FAPEMIG for the inancing support of this research work.
REFERENCES
[1] S. Wu, J. Xue, R. Wang, J. Li, J. Alloys Compd. 585, 5 (2014) 542-548.
[2] D.R. Askeland, P.P. Fulay, W.J. Wright, The Science and Engineering of Materials, Publisher CL Engineering (2010). [3] Q.M. Wei, J.B. Li, Y.J. Chen, Y.S. Han, Mater. Charac. 47, 3-4 (2001) 247-252.
[4] L.P. Sosman, R.J.M. da Fonseca, A. Dias Tavares Jr., T. Abritta. Cerâmica 52, 322 (2006) 200-204.
[5] G.K.B. Costa, L.P. Sosman, A. López, N. Cella, R.B. Barthem, J. Alloys Compd. 534, 5 (2012) 110-114.
[6] A.C.F.M. Costa, M.R. Morelli, R.H.G.A. Kiminami, Cerâmica 49, 311 (2003) 168-173.
[7] O. Mirzaee, A. Shafyeia, M.A. Golozara, H. Shokrollahib, J. Alloys Compd. 461, 1-2 (2008) 312-315.
[8] O. Mirzaee, J. King Saud University - Eng. Sci. 26, 2 (2013) 1-7.
[9] D. Mardare, N. Iftimie, M. Crişan, M. Răileanu, A. Yildiz, T. Coman, K. Pomoni, A. Vomvas, J. Non-Cryst. Solids 357, 7 (2011) 1774-1779.
[10] A. Yildiz, N. Serin, M. Kasap, T. Serin, D. Mardare, J. Alloys Compd. 493, 1-2 (2010) 227-232.
[11] A.A. Sattar, Egypt. J. Sol. 27, 1 (2004) 99-110.
[12] A. Franco, Jr. M. S. Silva, J. Appl. Phys. 107, 07B505 (2011) 109-11.
[13] M.A. Gilleo, Phys. Chem. Solids 13 (1960) 33.
[14] M. Kaiser, S.S. Ata-Allah, Phys. Status Solidi B 242, 15 (2005) 3138-3148.
[15] H. Farooq, M.R. Ahmad, Y. Jamil, A. Hafeez, Z. Mahmood, T. Mahmood, J. Basic Appl. Sci. 8, 2 (2012) 597-601.
[16] R. Sridhar, D. Ravinder, K.V. Kumar, Int. J. Eng. Res. Appl. 3, 5 (2013) 2021-2024.
[17] K. Iwauchi, Japanese J. Appl. Phys. 10, 11 (1971) 1520-1528.
[18] N. Rezlescu, E. Rezlescu, Phys. Status Solidi A 23, 2 (1974) 575-582.
[19] C.G. Koops, Phys. Rev. 83, 121 (1951) 121-124. [20] S.S. Karande, B.R. Karche, Int. J. Emerging Techn. Adv. Eng. 4, 10 (2014) 602-608.