M
ESTRADO
E
CONOMIA E
G
ESTÃO DE
C
IÊNCIA
,
T
ECNOLOGIA E
I
NOVAÇÃO
T
RABALHO
F
INAL DE
M
ESTRADO
D
ISSERTAÇÃO
WHAT
DO
EDITORIAL
BOARDS
INDICATE
ABOUT
THE
NATURE,
STRUCTURE
AND
DIRECTIONS
OF
SCHOLARLY
RESEARCH?
JOÃO
PEDRO
MODERNO
NEVES
PEREIRA
M
ESTRADO EM
ECONOMIA
E
GESTÃO
DE
CIÊNCIA,
TECNOLOGIA
E
INOVAÇÃO
T
RABALHO
F
INAL DE
M
ESTRADO
D
ISSERTAÇÃO
WHAT
DO
EDITORIAL
BOARDS
INDICATE
ABOUT
THE
NATURE,
STRUCTURE
AND
DIRECTIONS
OF
SCHOLARLY
RESEARCH?
J
OÃO
P
EDRO
M
ODERNO
N
EVES
P
EREIRA
O
RIENTAÇÃO:
PROF. DOUTOR SANDRO MIGUEL FERREIRA
MENDONÇA
PROF. DOUTOR MANUEL ANTÓNIO DE MEDEIROS
ENNES FERREIRA
Agradecimentos
Aos meus pais, irmã e Inês.
Aos Professores Sandro Mendonça e Ennes Ferreira pelos ensinamentos, conselhos,
inspiração e confiança que me foram dando ao longo desta jornada.
Aos meus colegas de mestrado, com um abraço especial ao Marco Dinis, João Isaac,
Pedro Lira, Vasco Ferreira e Mónica Leite.
Ao Nuno Agostinho pelos conselhos que me deu ao longo destes meses e a todos os meus
Abstract
Research output regarding publications is relatively polarized in a few regions. The
majority of the published articles are written in English, but developed countries comprise
an astounding difference when compared to developing ones. In this case, bibliometric
indicators are used to measure these statistics, and asymmetries have been found through
the time. Journals are the most common method of publication, and their importance to
the dissemination of knowledge is undeniable since submitted articles are subjected to
scrutiny and selection by their own internal governance.This dissertation focuses on the
editorial boards’ structure of leading journals covering development studies in three regions: Africa, Asia and Latin America, and in order to compare outlets covering studies
in these regions with more impactful journals, leading ones from the development
economics’ subject field were also analysed. This study explores a relatively unknown area since although the interest about the journals’ internal governance has been
increasing, there are no significant findings on patterns and characteristics in the
intermediation of studies focused on regions or countries.
Gathering the editorial boards, several variables were studied: gender, geography,
affiliation and research relevance. Native regions are found to be less represented in the
respective studies’ journals than expected, principally Africa and Latin America. Women editors are a minority, representing little over a quarter of the editorial population. A
positive relation between the editors’ relevance and impact of the journal was also found. Providing a scientometric analysis, patterns are discussed.
Keywords:
Resumo
O output científico no que diz respeito às publicações está relativamente restrito a
determinadas regiões. Países cientificamente desenvolvidos representam uma maioria
significativa no que toca ao número de publicações, aquando comparados com países em
desenvolvimento. Neste caso, indicadores bibliométricos são ferramentas úteis para
efetuar comparações e identificar assimetrias. Revistas académicas são o método mais
comum de publicação de artigos científicos e a sua importância para a disseminação de
conhecimento é inquestionável. Os artigos submetidos são sujeitos a escrutínio e seleção,
sendo essa função praticada pelos conselhos editoriais. Esta dissertação tem como foco o
estudo dos conselhos editoriais de revistas académicas na área da economia do
desenvolvimento em três regiões: África, Ásia e América Latina. Com o intuito de
comparar as revistas destas três regiões com mais reputadas, revistas líder na área da
economia do desenvolvimento foram igualmente analisadas. Este estudo explora uma
área pouco investigada, pois embora o interesse pelas estruturas dos conselhos editoriais
tenha vindo a aumentar, não foram encontrados resultados sobre revistas focadas em
estudos de regiões ou países.
Agrupando os editores, várias variáveis foram estudadas: género, proveniência
geográfica, afiliação institucional e relevância científica, no sentido de identificar
características na intermediação científica. Regiões nativas ao foco das revistas são pouco
representadas, especialmente África e América Latina. A representação feminina está em
minoria, representando apenas pouco mais de um quarto da população editorial.
Finalmente, foi calculada uma relação positiva entre o impacto das revistas e a
performance dos editores.
Palavras-chave:
Conselhos editoriais – Intermediários científicos – Revistas académicas – Estudos de região
Table of Contents
1. Introduction ... 1
2. Literature Review ... 3
2.1. The scientometric research program ... 3
2.1.1. Historical perspective ... 3
2.1.2. The institutionalization of science measure ... 4
2.2. Bibliometrics ... 5
2.2.1. History and evolution ... 5
2.2.2. Bibliometric indicators ... 6
2.2.3. Types of Indicators ... 8
2.2.3.1. Quantity indicators ... 8
2.2.3.2. Performance indicators ... 9
A. Researcher performance indicators ... 9
B. Journal performance indicators... 11
2.3. Editorial boards – Gatekeepers of academic journals ... 13
2.4. Preliminary conclusions ... 15
3. Methodology and Sources ... 16
3.1. Journal Selection ... 16
3.2. Editor identification and characterization ... 17
3.3. Measurement ... 18
4. Results ... 19
4.1. General outline ... 19
4.1.1. Editorship count ... 19
4.1.2. Journal outline ... 20
4.1.3. Editorial boards and paper output distribution ... 21
4.2. Geographic analysis ... 22
4.2.1. Distribution by region ... 22
4.2.2. Distribution by country ... 23
4.3. Gender analysis ... 26
4.4. Institutional analysis ... 27
4.4.1. Academic vs. non-academic editors ... 27
4.4.2. Institutional affiliations ... 27
4.5. Scientific performance ... 29
4.5.1. Introduction ... 29
4.5.2. Region Analysis ... 30
4.5.3. Analysis by geographic case ... 30
4.5.4. Research excellence ... 31
4.6. Discussion ... 32
Appendix ... 35
Bibliography ... 45
List of Tables
Table 1: Tabulation of the 20 journals, separated by the four study cases ... 17Table 2: List of the considered information and respective sources ... 18
Table 3: List of the editors’ variables and respective measurement ... 19
Table 4: Correlations between the number of editors and the number of documents by journal across journal areas ... 22
Table 5: Gender analysis by region for the whole editorial population ... 27
Table 6: List of the most represented affiliations for the four study cases ... 28
Table 7: Indicators’ medians by region ... 30
Table 8: Indicators' medians for the four study cases ... 31
List of Figures
Figure 1: Repeated editors' distribution by journals ... 20Figure 2: Number of editors by journal for the four study cases... 21
Figure 3: Editors by region for the four study cases ... 23
Figure 4: Map of the editors' geographical position ... 24
Figure 5: Distribution of the five most represented countries for the four groups of journals in study and for the whole editorial population ... 24
List of Appendixes
Appendix 1: Brief definition of five of the most popular quantity indicators ... 35Appendix 2: Definitions of six of the most popular researcher performance indicators ... 35
Appendix 3: Brief definition of five of the most popular journal performance indicators ... 36
Appendix 4: African studies’ journals, brief outline of the samples ... 36
Appendix 5: Asian studies' journals, brief outline of the samples ... 37
Appendix 6: Latin American studies' journals, brief outline of the samples... 37
Appendix 7: General development journals, brief outline of the samples ... 38
Appendix 8: List of the editorial boards’ job functions by journal (African studies) ... 39
Appendix 9: List of the editorial boards' job functions by journal (Asian studies) ... 39
Appendix 10: List of the editorial boards' job functions by journal (Latin American studies) ... 40
Appendix 11: List of the editorial boards' job functions by journal (General development) ... 40
Appendix 12: African journals' information ... 40
Appendix 13: Asian journals' information ... 41
Appendix 14: Latin American journals' information ... 41
Appendix 15: General development journals' information ... 41
Appendix 16: List of the editors’ geographical position by region ... 42
Appendix 17: List of the most represented affiliations on journals related to African studies journals ... 42
Appendix 18: List of the most represented affiliations on journals related to Asian studies ... 42
Appendix 19: List of the most represented affiliations on journals related to Latin American studies ... 42
Appendix 20: List of the most represented affiliations on generalist development journals ... 43
Appendix 21: Editors’ medians by region (African studies journals) ... 43
Appendix 22: Editors' median by regions (Asian studies journals) ... 43
Appendix 23: Editors' medians by region (Latin American studies journals)... 43
Appendix 24: Editors' medians by region (General development journals)... 44
List of Abbreviations
A&HCI – Arts & Humanities Citation Index C – Total Number of Citations
CPP – Number of citations per publication IF – Impact Factor
ISI – Institute for Science Information MNCS – Field normalized citation score NGO – Non-governmental organization NSB – National Science Board
NSF – National Science Foundation
OECD – Organisation for Economic Co-operation and Development P – Total number of publications
PTJ – Number of publications in top-ranked journals
R&D – Research & Development S&T – Science & Technology SCI – Science Citation Index SJR – Scimago Journal Rank
SSCI – Social Sciences Citation Index UK – United Kingdom
UN – United Nations
UNDP – United Nations Development Program
UNESCO – United Nations Education, Scientific and Cultural and Organization USA – United States of America
1
1. Introduction
Science has been one of the main catalyzers shaping the modern society (Caraça et al.,
2009). The diffusion of the Internet and the increased access to higher education across
the population have fueled knowledge creation and dissemination, leading to the
intensification of research and published articles.
In this case, universities play a significant role. Aside from granting academic degrees,
they are seen as vital centres of research and knowledge creation, from blue sky research
to applied research. The results of these processes in the academic work are disseminated
in the format of academic journal articles and books, or unpublished theses.
Academic journals are one of the oldest forms of knowledge sharing. Although they were
initially unpopular, after some years, scholarly journals became the most common way
of publishing, prevailing until the present. Journals are important pillars of the modern
scientific enterprise
,
which try to explain the world while installing solid intellectual foundations to reshape it. Hence, these institutions are responsible for the acceptation anddissemination of the knowledge produced.
In this case, internal governance plays an important role, since they decide the content of
a journal, defining its aims and scopes. Composed by a group of individuals commonly
known as editorial boards and advisory boards, they are usually specialized in the subject
area of a specific journal, working almost like their administration: between other
functions, they decide which subject an issue should focus and which submitted articles
they consider appropriate for publishing.
Even though the editorial boards’ importance to the academic value chain is undeniable, studies about the governance of peer-reviewed research journals are still fragmented in
2
Thus, to scan into the internal governance of these major vehicles of the contemporary
research, this dissertation focuses on the leading academic journals’ editorial boards of
Africa, Asia and Latin America studies in the field of development. These geographical
areas, which encompass the majority of developing countries, broadly do not have highly
reputed universities. Even though there are talent and capabilities, in most of the cases
researchers from there look for opportunities in developed countries or high ranked
universities, simply because there are not, among other problems, suitable research
programs to entice them
.
To establish a comparison between these journals and most reputed ones, top outlets in the field of development economics were also analyzed. Atan exploratory level, several variables about the editorial boards’ were studied, such as
gender, institutional affiliation, geography and research relevance. This scientometric
perspective can be a useful tool to understand some of the journals’ characteristics.
Two interrelated research questions were posed to outline the objectives of this
dissertation: 1) What do editorial boards indicate about the structure of the scholarly
research? 2) How do editorial boards are related to the impact of a journal?
As objectives, three goals are outlined: (1) to provide a scientometric perspective about
the editorial boards; (2) to identify patterns in the analysed editorship; and (3) to understand if the editorial’s team scientific relevance or team diversity are related to the journal impact.
This dissertation is organised as follows. Chapter 2 will focus on the core literature about scientometrics, bibliometrics and journals’ editorial boards. Chapter 3 outlines the methodology and sources used in this dissertation. Chapter 4 presents the results obtained
from the analysed journals’ editorial boards. The fifth and last chapter outlines the main
3
2. Literature Review
2.1. The scientometric research program
2.1.1. Historical perspective
One of the definitions of scientometrics is “the quantitative study of science, communication in science and science policy” (Hess, 1997, p. 75) being its research devoted to the quantitative studies of science and technology. According to van Raan
(1997, p. 206), the core interests of scientometric research fall in four interrelated areas:
“(1) the development of methods and techniques for the design, construction and application of quantitative indicators on science and technology; (2) development of information systems on science and technology; (3) the study of interaction between science and technology; and (4) the study of cognitive and socio-organizational structures of scientific fields and development processes in relation to societal factors.”
Scientometrics, originally a Russian word (naukometriya), was proposed for the first time
in 1966 by the mathematician-philosopher-polymath Vasily Nalimov and his co-author
Z. M. Mulchenko (Garfield, 2009) in their paper called “Quantitative methods of research
of scientific evolution”(Research Trends Editorial Board, 2009).1 Even though the term
was coined for the first time in 1966, there were earlier contributions in this area from
other authors (Kinouchi, 2014).2 However, in the second half of the 20th century a huge
development was made – the quantitative study of research patterns by citation analysis,
which is the quantitative analysis of research patterns and productivity based on research
referenced in publications (Hess, 1997) – by the two pioneers of scientometrics as we
know it today: Eugene Garfield, in his 1955 paper “Citation Indexes for Science” and
Derek de Solla Price, in his 1963 book Little Science, Big Science (Hess, 1997).
The first idea about an interdisciplinary index to improve information retrieval came from
Eugene Garfield in the early 1960s, known as citation indexing (Leydesdorff & Milojevic,
1Original title: Kolichestvennye metody issledovaniya protsessa razvitiya nauki.
2See Alfred Lotka’s paper (1926), which focuses on the frequency distribution of chemists and physicians’
scientific production (1926), Bradford’s law (1934), Bernal’s “The Social Function of Science (1939) or Wells’s (1939) work proposing the establishment of a world information center are some of the examples.
4
2015), although it was proposed for the first time in Science (1955) by the same author
(Garfield, 2007). Citation index is described as “an ordered list of cited articles each of
which is accompanied by a list of citing articles,” in which “the citing article is described
as a source while the cited article is described as a reference.” (Garfield, 1964, p. 652).
The idea in the creation of this bibliographic system was, according to Garfield (1955, p.
108), “for science literature that can eliminate the uncritical citation of fraudulent,
incomplete or obsolete data by making it possible for the conscientious scholar to be
aware of criticisms of earlier papers.”
2.1.2. The institutionalization of science measure
In the 1950s, several factors that led to the development of citation indexing were
identified. After the WWII several socio-economic changes occurred (Jesus & Mendonça,
2018), which led the US to make an enormous investment into R&D. Consequently, the
number of scientific publications increased significantly, creating the need for a more
efficient method of indexing and retrieval than the then-current model of manual indexing
of materials for subject-specific indexes. The importance of that step comes from the
weak capacity of the used index which was not enough to satisfy the researchers’ needs,
due to excessive lag times, in the addition of materials and limitations to the subject
indexing concerning retrieval. Following the emerging interest and investment in
computer science, automatic indexing was expected to overcome difficulties from
previous methods, creating hope that automation would be a useful tool to prevail over
the problems of manual indexing.3
The project proposed by Garfield became politically desirable and gained some cultural
credibility (de Bellis, 2009). Hence, some years after, in 1964, the SCI was launched by
ISI4, a company founded by Garfield himself. At that time, the SCI was the only regularly
3 See: https://clarivate.com/essays/history-citation-indexing/ 4 Currently owned by Clarivate Analytics.
5
published citation index in science (Malin, 1968). Using as primary input papers from
selected journals covering all the major and disciplines and sub-disciplines, the
bibliographic references link documents and its authors, simplifying the literature
research and providing an essential measure of documents and authors’ impact (de Bellis,
2009).
In 1966, all the major sub-disciplines of mathematics, life, physical and chemical sciences
and engineering were covered to a large degree. In 1972 the SCI was followed by the
SSCI and in 1978 by the A&HCI (de Bellis, 2009). Initially, the ISI Citation Indexes were
divulgated only in printed versions, but from 1980 the company started to publish all the
indexes available on CD-ROM (Baysinger, 1998). In addition to the three citation indexes
available at that time (SCI, SSCI and A&HCI), in 1991 ISI also added a five specialty
CD-ROM, covering Biochemistry, Biotechnology, Neurosciences, Mathematics and
Computer Sciences (Moed, 2006).
In 1997, a web-based integration of SCI, SSCI and A&HCI was launched, marking the
basis of the future WoS – which appeared in 2005 as an integrated web platform (Beira,
2010). Available online, the database became widely accessible (Hicks et al., 2015). That
basic continuity redefined the relationships between the nodes of the scientific
communication network, turning citations into the keystone to research analysis and
evaluation (de Bellis, 2009).
2.2. Bibliometrics
2.2.1. History and evolution
After publication, the research outputs are used by other researchers in their works,
resulting in citations on their subsequent articles. These citations can be used statistically
and mathematically to measure patterns. Those methods are known as bibliometrics
6
The term bibliometrics was coined for the first time by Alan Pritchard’s article “Statistical
bibliography or bibliometrics?” (1969, pp. 348-349), defined there as “the application of
mathematics and statistical methods to books and other media documentation” to “shed
light on the processes of written communication and of the nature and course of development of a discipline.” Succinctly, bibliometrics can be described as the quantitative and statistical analysis to publications and authors (OECD, 2002).
Although both scientometrics and bibliometrics focus on quantitative analysis, being used
almost as synonyms (Lundberg, 2006), it is important to note that bibliometrics is not
restrained only to scientific documentation and scientometrics is not restricted to
bibliometric measures (Hess, 1997).
Bibliometrics has evolved. Erstwhile, bibliometrics indicators for academic research were
more straightforward, being limited to the collection of data based on the number of
publications. The data was classified by author, country, affiliation, field of science, etc.
Afterwards, in part due to the evolution of technology, the techniques became more
sophisticated, which enabled a more conscious measure of the research quality, evolution
and development of fields of science. Nowadays, bibliometric indicators are seen as a
useful tool in order to gauge the impact of a work, author, research group, department or
university/institute in the eyes of the research community, allowing the identification of
national and international networks (OECD, 2002).
2.2.2. Bibliometric indicators
The origin of S&T indicators is from the US (1973), where the NSB, the policymaking
board of the NSF was requested by the US Congress to publish a Science Indicators report
twice each year. These reports aimed to measure science and research funding based on
them. Although there were some scientists against this idea, the US Science Report
7
(Grupp & Mogee, 2004). Nowadays, bibliometric and patent indicators are one of the
most frequently used indicators to measure R&D outputs (UNESCO, 2005).
Broadly, and according to the Oxford English Dictionary5, an indicator can be defined as “a thing that indicates the state or level of something.” A more accurate definition of the word regarding how it is used in bibliometrics is given in the “Handbook on Monitoring
and Evaluating for Results” (2002, p. 101), from the UNDP Evaluation Office. It is
defined as a “signal that reveals progress (or lack thereof) towards objectives; means
measuring what actually happens against what has been planned in terms of quantity,
quality or timeliness. An indicator is a quantitative or qualitative variable that provides a
simple and reliable basis for assessing achievement, change or performance”. The term
bibliometric indicator is often used for the results of a bibliometric analysis (Rehn et al.,
2014a) and its use has been increasing in the recent years (Confraria & Godinho, 2014).
According to van Raan (2004, p. 21), an indicator is “the result of a simple mathematical
operation (often simple arithmetic) with data.” Hence, it becomes important to understand
the term data, which is, in this case, the number of citations of one publication in a
determined period. The same author argues that working as instruments in the study of science, “indicators must be problem driven, otherwise they are useless.” (idem, p. 22). Another point of view is given by Holton (1978, p. 203): indicators “can rationalize the
allocation and use of resources”, since they allow the understanding of the features
associated with them. He also states that “indicators must not be thought of as given from ‘above,’” but instead “they should preferably be developed in response to and as aids in the solution of interesting questions and problems.” (idem, p. 219)
According to Peter Vinkler (2010, p. 82), the study of publications in different scientometric systems englobes an appropriate selection of indicators: “(1) the function
8
of the indicators applied should be determined; (2) the method of the calculation should
be given; and (3) applicability and validity should be studied within the conditions of the corresponding item”. There are innumerous indicators, and it is important to note that they are cyclically under criticism, meaning that new indicators are being developed all
the time, while existent ones are always being evolved (OULU, 2017).
2.2.3. Types of Indicators
There are multiple types of bibliometric indicators aimed to measure the scientific
productivity or its dissemination. The consulted bibliography did not present a consensus
related to its grouping since two major ways of clustering were identified. However, the
majority of it argues that there are three types of indicators: (1) quantity, (2) performance
and (3) structural indicators. In this dissertation, only the first two will be described.6 To
achieve a more comprehensive analysis, multiple indicators should be combined due to
the simplification of the bibliometric methods (Rehn et al., 2014a).
2.2.3.1. Quantity indicators
Quantity indicators focus on the productivity of a researcher or group of researchers,
department, university or country (Durieux & Genevois, 2010), measuring the number of
publications and citations (Rehn et al., 2014a). It is important to note that quantity
indicators only focus on the published works’ output, not measuring its impact (Lundberg,
2006). The two most used quantity indicators are the total number of publications (P),
which describes the full number of outputs produced by the analyzed author or unit during
a specified period and the number of publications in top-ranked journals (PTJ)7. Apart
6 There is an alternative way to group the indicators in three different types: basic, advanced and structural
indicators. Basic indicators are simple mathematical operations in order to measure the same subject areas; advanced indicators are normalized, allowing to compare different subject areas, while structural indicators are used to find publication patterns (see: http://www.slu.se/en/site/library/publish-and-analyse/bibliometrics/indicators-and-h-index/).
7 Describes the full number of publications a unit has published in a selected number of journals, according
9
from the number of publications or citations by an author or unit, the world share of
publications, the number of publications in citation indexes such as Thomson Reuters or
Google Scholar or the number of publications in top ranked journals are other examples
(Rehn et al., 2014a).8
2.2.3.2. Performance indicators
Performance indicators focus on the quality or impact of a work, an author or a group,
measuring the respective reputation in the scientific community. While quantity
indicators only express the number of citations, performance indicators identify how
often others cite a work, an author or a group in a particular period (Durieux & Genevois,
2010). This type of indicators is divided into two sections: researcher performance
indicators (A) and journal performance indicators (B) (Joshi, 2014).
A. Researcher performance indicators
This type of indicators evaluates the quality or impact of researchers/units. However,
although there are multiple researcher performance indicators, the scientists’
measurement is problematic, due to two major reasons: (a) statistically reliable indicators
are dependent on a high number of publications produced in a short period and (b)
research productivity and citation impact are not necessarily correlated variables
(Glänzel, 2006).
Basic researcher performance indicators represent the basis of the more sophisticated
indicators posteriorly proposed to make comparisons between researchers (Durieux &
Genevois, 2010), trying to overcome the problems outlined in the previous paragraph. A
primary indication of performance is the number of times an article is cited – the higher
the citations, the higher the performance. Dividing C by a concrete number of years, the
10
average citations per year indicator is generated; dividing C by the number of total
published articles, CPP is produced (Rehn et al., 2014a).
In 2005, Jorge E. Hirsch suggested a basic but very well received indicator, known as
h-index. Proposed to evaluate the scientific output of an individual researcher (Joshi, 2014),
Hirsch (2005, p. 16569) defined it as: “A scientist has index h if h of his/her Np papers
have at least h citations each, and the other (Np – h) papers have no more than h citations
each”. To calculate the index, the researcher outputs are sorted in descending order by number of citations, being the articles counted from the top to the bottom of the list; when
the number of an article rises above the number of citations for that article, the number of
the preceding article is the h-index9. In other words, h-index corresponds to the number
of publications (h) that have at least h citations (Rehn et al., 2014a). Even though the
h-index is considered robust in several ways (Batista et al., 2006)10, several shortcomings
were identified, since (i) the h-index is based on long-term observations, which have as a
consequence the disadvantage of newcomer researchers; (ii) h-index is not independent
of subject-specific communication behavior and cannot be normalized in the same way
other indicators can; (iii) h-index cannot exceed the number of publications; and (iv)
despite being useful to the identification of outstanding performances, it fails in assessing
fair and good performances (Glänzel, 2006).
Moreover, more sophisticated indicators have been developed, such as normalized
indicators11 that control citation rates based on document type, research field and year of
9 i.e., a researcher has 150 published articles during an analyzed time span; the article number 30 has 32
citations and number 31 has 27. The h-index will be 32. Three levels were proposed for interpreting the h- index: 20 years after of scientific activities, h-index at 20 characterizes a “successful” researcher; at 40 an “outstanding”; at 60 a “truly unique individual” one (Hirsch, 2005).
10 “(i) it combines productivity with impact, (ii) the necessary data is easy to access in Thomson ISI Web
of Science database, (iii) it is not sensitive to extreme values, (iv) it is hard to inflate, (v) automatically samples the most relevant papers concerning citations” (Batista et al. 2006, p. 179).
11 Normalized indicators overcome differences between subjects by measuring the weighted average of
the relative performance in each subject area. (see
http://ipscience-help.thomsonreuters.com/inCites2Live/indicatorsGroup/aboutHandbook/appendix/indicatorsGlossaryOne Page.html).
11
publication (Lundberg, 2006). Examples of frequently used normalized indicators are the
crown indicator or the MNCS.12
B. Journal performance indicators
Journal performance indicators measure the quality or impact of a journal. The evaluation
can be made using different methods and those various methods can offer different results
(OULU, 2017). Probably, the most used indicator to measure journals’ impact is the IF
(Joshi, 2014), which is a basic and old indicator, since was proposed in 1955 and
developed in the early 1960s13. It corresponds to the average number of citations received
in the previous year by articles published in the analyzed journal in the last two or five
years (Mingers et al., 2012). Even though the IF is easy to calculate and independent of
the journals’ size, several associated disadvantages were identified14, being stated that a
high IF does not reflect the quality of the published articles (Durieux & Genevois, 2010).
In order to try to overcome some of the IF’s disadvantages, it was proposed that the
h-index could be used to measure the journals’ quality. Its calculation method is the same
as the outlined for researchers15, being suggested that it would be a more useful metric to
calculate the journals’ quality and impact. Although all of the h-index’s disadvantages outlined above are the same, some of them are considered less prominent when the
indicator is used to measure journals, since the time span can be selected to provide an
appropriate analysis (Mingers et al., 2012).
12 See Appendix 2.
13 Proposed by Garfield and developed by himself and I.H. Sher, being the citations collected in WoS. 14 (a) Since it is a basic indicator, it is not sensible to the subject specialty of the journal, i.e.
multidisciplinary journals tend to have a higher IF than a specialized journal; (b) the number of authors in an article tend to cite their works frequently, increasing the IF of the journal; (c) review articles or technical reports tend to have many more citations than an original research paper, meaning that a journal that publishes a lot of review articles is likely to have a higher IF than a journal that publishes primarily original articles; (d) number of articles published per year by a journal, i.e. a journal with more willingness to accept articles or with more issues is more likely to have a higher IF (Joshi, 2006).
15 Succinctly, according to Hodge and Lacasse (2011, p. 583): “An entity has an h-index value of y if the
12
Since those outlined indicators are not normalized, they do not overcome differences
between subjects. Hence, to provide a complete evaluation, new metrics to measure
scientific impact as a combination of quantity and quality were developed
(González-Pereira et al., 2009), such as the normalized journal impact, the source normalized impact
per paper or the SJR. In this dissertation, the used indicator to rank the journals is the
SJR16, which corresponds to the average number of weighted citations received in a determined year by the journal’s published documents in the three previous years17. SJR
diverges from the IF in the way that different weights to citations are attributed18,
depending on the impact of the citing journal without the self-citations. The prestige is
calculated with the PageRank algorithm19 (Falagas et al., 2008). Based on eigenvector
centrality20, several strengths associated with this indicator were identified, such as (a)
the use of Scopus21 as the data source for its development, (b) the multidimensionality,
(c) the limitation of the number of self-citations and (d) the international collaboration in
order to measure ratios of outputs produced between institutions from different countries.
However, weaknesses were also found: (a) the SJR does not generate metric considering
trade journals22 or other non-peer reviewed articles and (b) citations are only counted if
they are made to an item published in the three previous years (Godana, 2011).
16 Appendix 3 tabulates brief definitions of the previously mentioned journal indicators. 17 See http://www.scimagojr.com/SCImagoJournalRank.pdf
18 The weight is based on the importance of the citing journals, meaning that more important journals will
provide more valuable citations when compared to less important ones (González-Pereira et al., 2012).
19 Calculation proposed by Google’s CEO Lawrence Page and his team, “in order to measure the relative
importance of web pages”, in which is “a method for computing a ranking for every web page based on the graph of the web” (Page et al., 1999, p. 2).
20 Based on the idea that there is a connection between “central actors” and “the centrality of each vertex
is proportional to the sum of the centralities of its neighbors. See
http://www.stat.washington.edu/people/pdhoff/courses/567/Notes/l6_centrality.pdf (slide 29).
21 Database of peer-reviewed literature and authors, owned by Elsevier. Considered as the world’s largest
scientific database, since it covers data from more than 17.000 journals, covering the full range of scholarly research. See: https://www.elsevier.com/solutions/scopus
22 Non peer-reviewed publication, which aims to cover fields of interest to a specific trade, business or
13
2.3. Editorial boards – Gatekeepers of academic journals
Academic journals are responsible for the acceptance and dissemination of the knowledge
produced by the scientific community. According to Braun (2004, p. 95), “the present
system of basic research in the sciences and scientific communication depends almost
entirely on the primary journal literature.” Since editorial boards are the groups of
individuals responsible for several decisions at a journal (Holland et al., 2014), editors
occupy strategic positions in the social hierarchy in their respective fields (Zsindely et al.,
1982). Working as research intermediaries (Borysewicz, 1977), “editors maintain the integrity of the editorial peer review process” (Gaston, 1979, p. 789) and must serve the readers, researchers and owners (Angell, 1991). Hence, a good editorial governance is an
important part of the integrity and independence of academic journals, in which having
the duty of ensuring the scientific quality of publications (Peterson et al., 2017), its
members work as gatekeepers of science, once the information accepted to circulate is
selected by them (Crane, 1967). Thus, editorial boards act as “opinion formers,
gatekeepers and arbiters of disciplinary values” (Burgess & Shaw, 2010, p. 629),
determining which topics are relevant for the journal, the current techniques and methods
and how thorough or speculative researchers should be about data interpretations.
Editors’ experience and scientific expertise in their respective subject fields are one of the most important factors in the members’ assignment (Burgess & Shaw, 2010), to
emphasize its impact (Konrad, 2008) and the potential increase in ranking of a journal.
The rationale is quite simple: more recognized editors may attract more talented authors to submit their scientific work, as well as expand the journal’s appeal to a wider audience (Metz et al., 2015; Zedeck, 2008).
Thus, even if editorial boards can be seen as a quality indicator of an outlet (Nisonger,
2002), empirical studies related to editorial governance and journal impact are limited,
14
focusing more on the broader editorial boards rather than on the editorial team (Petersen
et al., 2017).
Two of the pioneers of journal gatekeeping indicators were suggested in the early eighties,
by Zsindely et al. (1982, p. 57), who found significant correlations “between the number
of science journal editors from different countries, on the one hand, and the number of
scientists, the number of science journals and the number of science papers produced by
these countries on the other.” In the same sense, Braun & Budjosó (1983, p. 161) analysed the nationalities of the editorial boards’ members of analytical chemistry journals, and concluded that “correlations were sought between their number and citation rates and
between their number and number of analytical papers published by scientists from the
country in question.” In 1985, a large-scale study was made, in which Bakker & Rigter
inspected the editorial boards of more than 1.000 medical journals to determine “if
international appointments originated from countries with large research programs.”
(Weller, 2002, p. 90). In the last years, a growing interest in editorial boards’ structure
has been noted (Burgess & Shaw, 2010), since more studies focused on this area have
been published – i.e., Baccini & Barabesi’s (2009), which found that 90% of economics
journals in their study were linked “via overlapping editorial boards” (Peterson et al.,
2017, p. 1597); or Burguess & Shaw’s (2010), concluding that editors on duty in more
impactful journals tend to be affiliated with more renowned institutions (Petersen et al.,
2017).
Hence, a basic premise can be assumed: editorship is a structured process. Outlined works
show that there is lack of focus and conclusions about the structure of the editorships, but
15
2.4. Preliminary conclusions
The huge investment made by the US government into R&D created the need for an
automated index in order to overcome the difficulties caused by the substantial increase
of scientific outputs. Both from political and scientifically point of view, the project
proposed by Eugene Garfield became desirable, which led to its launch and development,
redefining the measuring of science, the relationships between subject fields and turning
the citations’ analysis into the most useful form of evaluating the research impact.
To measure citation patterns, its statistical and mathematical use needed to follow the
index citation analysis’s evolution. Once again, the US government played a major role
in this case, since Science Indicators reports were requisitioned, with the aim of
measuring science and research funding based on them. Through the time, bibliometrics
indicators’ evolution was always continuous, becoming one of the most useful tools to
measure works, researchers, research groups, journals, departments or institutes, as well as the countries’ S&T outputs.
Since journals’ documents are published after scrutiny and selection, editorial boards play an important role in knowledge dissemination, once they act as the gatekeepers of science.
Working as a structured process, they can be seen as a quality indicator of a journal. Thus, to understand the academic journals’ governance, it is useful to analyze the editorial boards to understand possible trends and the relation between an outlet’s impact and the editorial team scientific relevance.
16
3. Methodology and Sources
3.1. Journal Selection
The first approach step in this study was to identify five key development academic
journals specialized in three different geographical areas – Africa, Latin America and
Asia – and compare them to five key top development general journals. Since there is not
one single way to establish rank orders of journals (Adkisson, 2014), the identification
was made resorting to Scimago, which ranks the journals using the SJR indicator.
The objective was to identify journals both in the Social Sciences and Economics,
Econometrics and Finance subject fields (ranked for 2016), in which contain 5327 and
919 journals in total, respectively. Even though there can be differences in publication
and citation behavior across disciplines (Dorta-González & Dorta-González, 2013),
economics and social sciences are a case of cross-disciplinary approach, since economics
has a strong position in studies of international development (Harriss, 2001).
Journals extracted from the Scimago’s list were selected by their title: only journals
containing “Africa” in their title were considered for African journals; “Latin American”
for Latin American journals; “Asia” for Asian and “Developing” or “Development” for
the top development ones. This first screening was made in order to be sure that the
selected journals were focused on the previously outlined regions.
From all the journals selected, a second method was adopted: a research in the respective
websites was made to analyse the aims and scopes and some of the published articles,
concerning to identify the ones contemplating fields with interest for this study.
The five-journal selection for each area is arbitrary. However, this methodology has been
17
journals were selected. Table 1 shows the selected journals for the three geographic areas
and the control group analysed in this dissertation.23
Table 1: Tabulation of the 20 journals, separated by the four study cases
Area of study Leading journals (and acronyms used in this study)
Africa 1. African Affairs (AA)
2. Review of African Political Economy (ROAPE) 3. Africa
4. Journal of Modern African Studies (JMAS) 5. Journal of Southern African Studies (JSAS) Asia 1. International Relations of the Asia Pacific (IRAP)
2. Asia Pacific Viewpoint (APV) 3. Journal of Asian Economics (JAE) 4. Modern Asian Studies (MAS) 5. Asian Economic Papers (AEP)
Latin America 1. Latin American Politics and Society (LAPS) 2. Latin American Perspectives (LAP)
3. Bulletin of Latin American Research (BLAR) 4. Latin American Research Review (LARR) 5. Journal of Latin American Studies (JLAS) Development
general journals
1. Journal of Development Economies (JDE) 2. World Development (WD)
3. Economic Development & Cultural Change (ED&CC) 4. Environment and Development Economics (EDE) 5. Economic Development Quarterly (EDQ)
3.2. Editor identification and characterization
In order to inspect into the journals’ editorial teams, the names contained in each journal
website were gathered, in which were hand-collected from the outlets’ editorial lists. Due
to an existence of outdated data in some journals’ websites, electronic versions of issues
from 2017 were consulted. Most of the journals publish the names of their editors and
their affiliations, but even though boards are structured bodies, the labeling of the job
function and its responsibilities are not homogeneous.24 Thus, the lack of standardization
in the editorial labels leads to a difficulty in job functions’ comparison between journals.
From all of the journals analysed, a total of 908 editorships were gathered: 204 in Asian journals, 263 in African ones, 243 in Latin Americans’ and 198 in development general
23 The inspected fields in this study are alphabetically ordered, while the journals themselves are ranked in
decreasing order of their respective SJR. For further information about the journals see Boxes 1 to 4 in Appendix.
18
outlets. It is important to keep in mind that there is a difference from editorships to editors:
even though all journals have 908 editorships, some editors are performing the role of
editors in more than one journal at the same time.
To understand the editorship structure of the journals outlined above, further information
was analysed. Since the websites only supplied information about the editors’ name and
their affiliation and job titles, alternative sources were needed to complement the data and
to fulfill the objectives of this dissertation. Table 2 shows the editorships considered
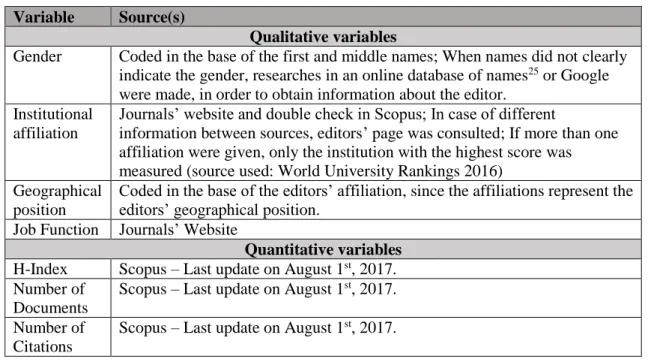
information and respective sources.
Table 2: List of the considered information and respective sources
Variable Source(s)
Qualitative variables
Gender Coded in the base of the first and middle names; When names did not clearly indicate the gender, researches in an online database of names25 or Google
were made, in order to obtain information about the editor. Institutional
affiliation
Journals’ website and double check in Scopus; In case of different
information between sources, editors’ page was consulted; If more than one affiliation were given, only the institution with the highest score was measured (source used: World University Rankings 2016)
Geographical position
Coded in the base of the editors’ affiliation, since the affiliations represent the editors’ geographical position.
Job Function Journals’ Website
Quantitative variables
H-Index Scopus – Last update on August 1st, 2017.
Number of Documents
Scopus – Last update on August 1st, 2017.
Number of Citations
Scopus – Last update on August 1st, 2017.
3.3. Measurement
Apart of the SJR, H-Index, total documents, citations and references were also included
and collected from 2016’s Scimago Ranks with the aim to provide a more detailed
analysis about the journals (See Appendix 12 to 15). In order to provide an analysis about
the gathered editorial boards’ information, the following variables were calculated (see
Table 3).
19 Table 3: List of the editors’ variables and respective measurement
Variable Characteristic(s)
Number of editors Raw count of editors affiliated to each journal.
Repeated editors Proportion of editors on duty in more than one journal at the same time in the total number of editors.
Gender diversity Proportion between male and female editors for each journal.
Academic editors Proportion between editors affiliated to universities or institutes in the total number of editors.
Geographical distribution
Geographical position, coded in the base of the institutional affiliation. Proportion between the countries and continents in the total number of editors.
H-Index Coded on the basis of Scopus in each editor’s page. Number of citations Coded on the basis of Scopus in each editor’s page. Number of
documents
Coded on the basis of Scopus in each editor’s page.
4. Results
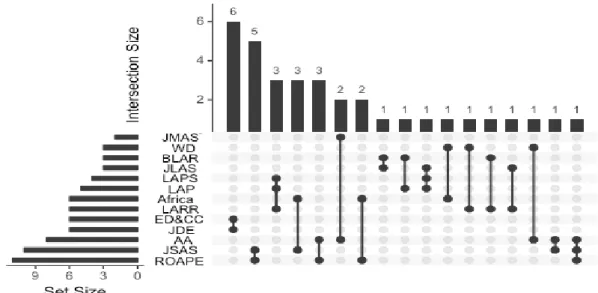
4.1. General outline 4.1.1. Editorship count
As outlined in Chapter 3, there are 20 journals, 5 in each of the four study cases. Overall,
908 editorships were gathered: 263 from journals related to African studies, 204 from
Asian studies, 243 from Latin American studies’ journals and 198 from general
development.However, 34 editors are working in more than one journal simultaneously,
meaning that only 873 are unique individuals. African studies’ journals comprise 17 repeated editors among its editorial teams26, Latin American studies contain 8 among the
five journals27 and generalist top journals only 6.28 It was also stated that there are 3
editors on duty in journals from different studies, in which 2 of them are working in
African outlets and generalist top journals and 1 in Latin American studies and
generalists. Only journals related to Asian studies do not comprise any repeated editors
(Figure 1).
26 In which one is on duty in three outlets at the same time (AA, ROAPE and JSAS). ROAPE encompass
11 repeated editors, JSAS 10, AA 6, Africa 2 and JMAS 2.
27 LARR has 5 repeated editors, LAPS 4, BLAR and JLAS comprise 3 and LAP 1, in which they are only
working in two journals at the same time.
20
Figure 1: Repeated editors' distribution by journals. “Set Size” is related to the number of repeated editors each journal comprises, while “Intersection Size” measures the number of editors on duty between the journals. R.
4.1.2. Journal outline
All of the five journals related to Africa are focused on African studies. All these are
based in the UK and three of them are published by academic publishing houses.29
On Asian studies’ outlets, IRAP and APV areas of focus outreach any other countries
bathed by the Pacific Ocean, which may include the Americas and Oceania, while JAE
tries to facilitate engagement between the American and Asian economists. Thus, only
AEP and MAS focus totally on Asian studies. From the five journals, only JAE is not
directly linked to a university.30
All of the Latin American studies’ journals are entirely focused on Latin American
studies. Only LAPS is directly linked to an academic institution31 and three of them
(LAPS, LAP and LARR) are from the US, while BLAR and JLAS are from the UK.
Finally, on development journals, four of the five outlets are related to global studies in
the development economics, since only EDQ “is geared to North American economic
development and revitalization.”32 Two journals are directly linked to academic
29 AA is published by Oxford University Press, while Africa and JMAS by Cambridge University Press. 30 IRAP is published by Oxford University Press, APV on behalf of Victoria University of Wellington (New
Zealand), MAS by Cambridge University Press, while AEP is distributed by the MIT Press.
31 University of Miami, US.
21
institutes33. About the journals’ nationality, only ED&CC and EDQ are from the US,
while JDE (Netherlands), WD and EDE are European (UK).34
4.1.3. Editorial boards and paper output distribution
As outlined in Chapter 3, the labelling of the job function and its responsibilities is not
homogeneous, showing that there is not a standard way to organise the editorial teams.
Regarding the board size, Figure 2 shows a considerable variability of editors across
journals, existing a range from 19 (JMAS and ED&CC) to 96 editors (LAP).
Figure 2: Number of editors by journal for the four study cases
The paper output also varies across journals. A correlation was made to understand if the
number of editors and the number of documents published are related. However,
calculating separately the same correlation for the four samples, it was noted that some
differences occurred (See Table 4). However, it is important to understand that there are
other variables, such as the ratio of papers accepted and the publication frequency of the
journals, in which differences across the outlets were found. All of African studies’
journals are published quarterly. The same does not happen in the rest of the studies: on Asian studies’ journals, IRAP, APV and AEP are published three times a year, while JAE and MAS are bimonthly outlets; in Latin American studies’ outlets, all of the journals
have quarterly issues, excepting LAP, which is published bimonthly; in general
development journals the differences are more significant: WD is published monthly, JDE
33 ED&CC published by the University of Chicago Press and EDE by the Cambridge University Press. 34 Appendixes 4 to 7 provide further information about the journals in study
31 72 47 19 94 58 43 44 34 25 41 96 37 35 34 72 31 19 28 48
22
and EDE are published bimonthly, while ED&CC and EDQ have quarterly issues.35 Thus,
analyzing the few variables available, no patterns were found.
Table 4: Correlations between the number of editors and the number of documents by journal across theme areas
Theme areas of journals ρ p-value African studies 0.97 0.004
Asian studies -0.96 0.009
Latin American studies 0.95 0.012
General development 0.17 0.78
Overall analysis 0.47 0.03
4.2. Geographic analysis
4.2.1. Distribution by region
To understand the patterns of scholarly research focused on the four study cases, the editors’ geographical position was analyzed. The countries were grouped into the following regions: Asia, Europe, Latin America, North America and Oceania. The
partition between Latin America and North America allows to understand the difference
of influence between the English-speaking countries (US and Canada) and
Spanish/Portuguese-speaking countries in the Americas, comprised by all the nations of
Central/South America plus Mexico and the Caribbean.
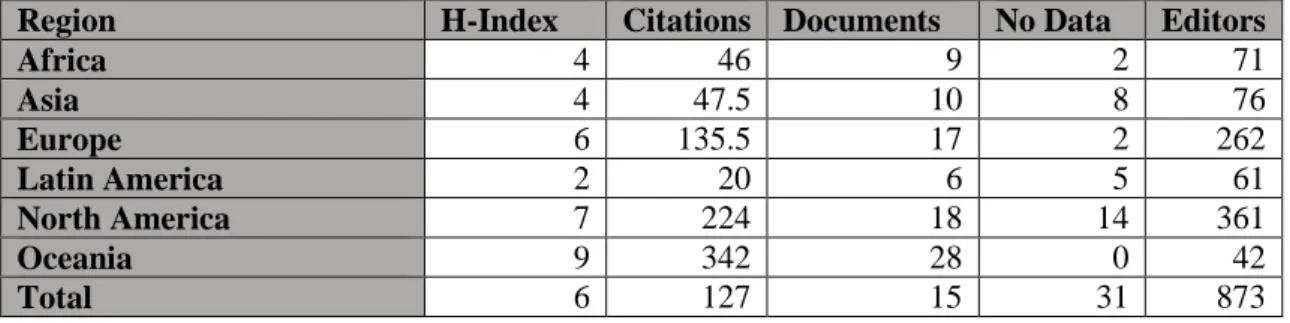
Overall, the majority of the editors are based in North America (361) and Europe (262),
corresponding to 71.4% of the editorial population, showing a huge influence of the most developed regions in the scholarly research. Asian studies’ journals are the only group in which no proportion dominance was observed between the regions. On African studies’
journals, Africa-based editors represent only little over a quarter of that segment’s
population(27.3%), showing that Europe has a major influence in the top academic
African studies, since this region is represented by 53.9% of the editorial population from that segment. Latin American studies’ journals comprise less than a quarter Latin America-based editors (23.4%), lower than a half of the North America-based editors
23
(50.6%). This result is clear enough to conclude that English-speaking countries have a
higher influence in this study case than the Spanish/Portuguese-speaking nations in the
Americas. On general development outlets, the most developed regions show up with an
outstanding representation, since North America and Europe-based editors comprise 89.7% of the study’s population (69.9% and 19.9%, respectively). The other regions represent a combined proportion of 10.3%, demonstrating a smaller importance when
compared to the most scientifically developed countries. Figure 3 comprises the number
of editors by region for the four samples.
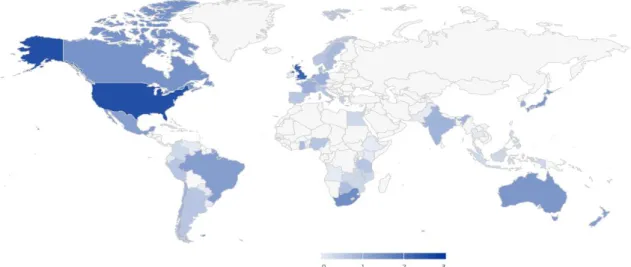
Figure 3: Editors by region for the four study cases 4.2.2. Distribution by country
Overall, 62 countries were mapped, representing 32.3% of the 195 nations recognized by
the UN36. Results of the designated countries by region are shown in Appendix (See
Appendix 12).
Analyzing the number of countries represented in the four study cases, was noted that
African studies’ journals comprise 30 nations, Asian studies 24, Latin American studies
25 and general development journals 25.37 Figure 4 maps the editors’ distribution by
country.
36 See http://www.un.org/en/member-states/
37 African studies: 16 African, 1 Asian, 10 European, 1 Latin and 2 North American; Asian studies: 10
Asian, 8 European, 1 Latin, 2 North American and 3 from Oceania; Latin American studies: 1 Asian, 9 European, 12 Latin, 2 North American and 1 from Oceania; General development journals: 4 African, 4 Asian, 11 European, 4 Latin and 2 North American.
67 1 132 1 44 67 36 1 62 38 1 56 55 119 4 5 7 39 4 137 71 76 262 61 361 42 A fri ca A si a Eu ro p e La ti n … N o rt h … A si a Eu ro p e La ti n … N o rt h … O ce an ia A si a Eu ro p e La ti n … N o rt h … O ce an ia A fri ca A si a Eu ro p e La ti n … N o rt h … A fri ca A si a Eu ro p e La ti n … N o rt h … O ce an ia
24 Figure 4: Map of the editors' geographical position. Darker blue means a higher representation, while white means that there is not any representation; Values are shown in a logarithmic scale with the aim to overcome the differences in countries’ representation. R.
Only Canada, France, Germany, the UK and US are represented in the four areas,
reflecting the worldwide relevance of these most developed nations. US shows up with
an astounding representation, comprising alone 38.3% of the editorial population (334
editors), followed at a great distance by the UK (21.1%, or 184 editors).
Analyzing the five most represented countries, it is noted that English-speaking countries
have a huge influence in these studies as they comprise the top-5. Although there is a
significant gap between the US’s representation and the rest of the countries, 69% of the
editorial population is comprised in the list. See Figure 5.
Figure 5: Distribution of the five most represented countries for the four groups of journals in study and for the whole editorial population
Looking at the countries by the geographic sample, results show that the majority of the
UK-based editors are on duty on African studies’ journals, representing 40% (98 editors)
of that segment’s population. This result is not a surprise since all of the five outlets are
37 98 32 7 0 54 29 0 8 19 112 41 0 7 4 132 17 2 5 0 334 184 34 27 23
USA UK South Africa Canada Australia
25
based there. However, if a language perspective is taken, countries where English is an
official language, constitute the three most represented nations, comprising an absolute
majority in the editorials’ seats: gatekeepers from the UK, US and South Africa take
68.2% of the positions in the African studies’ journals. Even in the rest of the African
countries, English language has an astounding representation, since from the 16 African
represented nations, only Angola, Egypt, Mozambique and Senegal do not have English
as an official language. Further, it was noted that only a half of the 16 African countries
are represented by two or more editors. This fact helps to highlight that African countries’
representation becomes substantially lower without South Africa since this nation alone
represents almost a half of the total Africa-based editors’ population (47.8%).
On journals related to Asian studies, the distribution between regions and countries is the
most equally distributed if compared to the other cases, which might be due to the fact
that three of the five journals are not entirely focused on Asia. However, the most
represented countries are the US (26.5% of the total segment’s population) and the UK
(14.2%). 10 Asian countries are represented on the boards (the highest number in the
segment) and the highest proportion of editors (32%). The three most represented Asian
countries are Japan, Singapore and South Korea, in which are three of the most
scientifically developed nations in that region. The high New Zealand representation is
due to the fact that APV is published on behalf of the Victoria University of Wellington since all of the editors based in that country are on the APV’s editorial team.
On Latin American studies, even though the outlets are entirely focused on that region,
only 3 Latin countries comprise more than 5 editors in the editorial population for that
segment (Mexico (17), Brazil (16), and Chile (6)). The US alone represents almost
one-half of the population (47.7%, 112 editors), demonstrating the enormous influence of the
country in this geographical area. Another element that helps to corroborate the previous
26
Finally, on development general journals’ boards, the top-3 most represented countries
are the US, the UK and Canada, comprising 80.2% of the editorial population for that
segment. The US’s representation is overwhelming (68.8%) when compared to the rest
of the countries: the UK, which is the second most represented nation, only comprises
8.8% of the editorial population. Even though 25 countries were mapped in this segment,
only the top-3 comprise 5 editors or more. This result shows the huge influence of the
developed English-speaking countries (and principally the US) have in the top scholarly
journals.
4.3. Gender analysis
Benedek (1976) studied psychiatry journals’ editorial board and found a dominance of
male members. In this dissertation the results are similar since only 233 editors are
women, representing little over than a quarter of the editorial population (26.7%).
Journals focused on Latin American studies have the highest absolute number and
proportion of women on the boards (83 women editors, 35.3%), followed by African
studies journals (72 women, 29.4%) and general development outlets (42 women, 21.9%).
The less diversified boards regarding gender are Asian studies’ journals (37 women
editors, 18.1%). Thus, it shows that in the four cases, male editors dominate the editorial boards’ seats.
Taking the whole sample, the distribution on a gender perspective by region shows that
Latin America-based editors have the highest percentage of women (31.1%), followed by
Europe-based (29.8%). Asia-based editors comprise the lowest proportion in this case
27 Table 5: Gender analysis by region for the whole editorial population
Regions Female Male % Female
Africa 19 52 26.8% Asia 15 61 19.7% Europe 78 184 29.8% Latin America 19 42 31.1% North America 90 271 24.9% Oceania 12 30 28.6%
4.4. Institutional analysis
4.4.1. Academic vs. non-academic editors
Taking the institutional affiliations, the majority of the editorial population belongs to
universities, since 774 of the 873 editors come from academia (88.7%). Non-academic
gatekeepers are distributed along institutions such as governmental agencies, NGOs,
libraries, museums, banks, think-tanks, etc.
There are no significant differences in boards’ diversification between the cases since the
non-academic editors ratio vary from 10.3% to 13.5%.38
4.4.2. Institutional affiliations
Overall, concerning represented institutions, a total of 403 were mapped, of which 325
are universities. Analyzing the top-10 of the most represented affiliations, all of them are
universities. Among the institutions with most representation, a total dominance by
English-speaking countries, primarily by the UK and the US was found, since only one
university represented in the top-10 is not based in these two nations. The results are
depicted in Table 6.
38 Analyzing only the first three studies, values only vary between 10.3% (Asian studies) and 10.6% (Latin