UNIVERSIDADE DE LISBOA
FACULDADE DE CIÊNCIAS
DEPARTAMENTO DE BIOLOGIA ANIMAL
Targeting phosphodiesterase-4 in cancer
Ana Maria de Sousa Varela
Dissertação
Mestrado em Biologia Humana e Ambiente
UNIVERSIDADE DE LISBOA
FACULDADE DE CIÊNCIAS
DEPARTAMENTO DE BIOLOGIA ANIMAL
Targeting phosphodiesterase-4 in cancer
Ana Maria de Sousa Varela
Dissertação
Mestrado em Biologia Humana e Ambiente
Dissertação elaborada sob a orientação de :
De-Chen Lin (PhD)
Deodália Dias (PhD)
TABLE OF CONTENTS
Acknowledgements / Agradecimentos 3 Resumo 4 Abstract 7 List of Figures 8 1. Introduction 111.1. cAMP and the compartmentalization concept 11
1.2. Phosphodiesterase Enzymes 12
1.3. Phosphodiesterase-4 (PDE4) 14
1.4. PDE4 inhibitors as a therapy 18
1.5. cAMP and cell growth control 19
1.6. PDE4 and cancer 20
2. Aims 22
3. Materials and Methods 23
3.1. Human cell lines, cell culture and chemicals 23
3.2. Construction of shRNA vectors 23
3.3. Lentiviral based expression 26
3.4. Transfection and infection of target cells 28
3.5. Short-term cell proliferation assay - MTT based 29
3.6. Long-term cell proliferation assay 29
3.7. Soft-agar assay 30
3.8. Western Blot analysis 30
3.9. Assessment of apoptosis 32
3.10. Cell migration assay 32
3.11. RNA extraction and reverse transcription 33
3.12. Real time quantitative PCR (RT-qPCR) 33
3.13. cAMP measurement 34
3.14. Image Capture 35
4. Results 35
4.1. Expression level of PDE4A/B/C isoforms in cancer cell lines 35 4.2. PDE4A/B knockdown triggered apoptosis in a panel of human cancer cells 36 4.3. PDE4A and PDE4B separately triggered apoptosis and suppressed cell growth 37 4.4. PDE4B promotes melanoma and gastric carcinoma proliferation 42 4.5. Ectopic expression of PDE4B2 increases tumorigenicity of A375 melanoma cells 43
4.6. PDE4B2 expression rescues cell death upon depletion of PDE4B3 44 4.7. PDE4B2 promotes cell migratory abilities of A375 cell line 45 4.8. Ectopic expression of PDE4B2 enhances the growth of melanoma xenografts
in mice 46
4.9. PDE4 inhibitors suppressed cell proliferation in several human malignant cells 46
5. Discussion 53
6. References 56
AKNOWLEDGEMENTS / AGRADECIMENTOS
I would like to express my gratitude to my mentors and colleagues: to Prof. Phillip Koeffler (MD), thanks for giving me the opportunity to be part of the cancer research at CSI and for all the expert opinions and suggestions about my research progress; Special thanks to Lin De-chen (PhD) for welcoming me on his team and for all his time and patience teaching me from the beginning to the end. I also thank Meng Xuan, Lim Su-Lin and Xu Liang for always being there for me and for all the support. My appreciation also goes to all Lab members, excellent professionals who always received me so well and helped me when I most needed.
Gostaria de agradecer à Professora Deodália Dias (PhD) pelo seu grande apoio e disponibilidade em guiar-me durante a elaboração desta Tese de Mestrado.
Muito obrigada aos meus amigos por todo o apoio, carinho e palavras confortantes.
Um caloroso obrigado a toda a minha família por terem estado sempre presentes e por toda a força que mesmo à distância nunca deixou de cá chegar.
Agradeço especialmente aos meus queridos pais pelo seu amor e apoio incondicional e por sempre me terem amparado e encorajado nos momentos mais difíceis, não interessasse a hora ou o lugar.
E o maior obrigado de todos vai para o João Gaspar, meu companheiro nesta jornada, que sempre esteve ao meu lado nos bons e maus momentos, que me disse as palavras bonitas que eu precisava ouvir e que sempre me ajudou a levantar de todas as pequenas e grandes quedas que dei durante a minha caminhada.
RESUMO
Adenosina monofosfato cíclico (cAMP) é um mensageiro secundário que se tem conservado ao longo da evolução, desempenhando papéis fundamentais na sinalização celular e transcrição de genes. O cAMP é gerado a partir de ATP através da acção de adenilil ciclases, que se localizam na superfície citosólica da membrana plasmática e respondem a estímulos de receptores transmembranares acoplados a proteínas G. Após formado, cAMP interage com proteínas efetoras desencadeando respostas celulares a diversos níveis, tais como metabolismo, expressão génica e proliferação e ciclo celulares. Dada a sua grande importância para a célula, os seus níveis são altamente controlados de modo a manter um equilíbrio entre a sua produção e degradação.
Actualmente sabe-se que as concentrações de cAMP são compartimentalizadas e extremamente variáveis, podendo oscilar desde alguns minutos a várias horas. A criação destes gradientes de cAMP mostra o quão complexos e fundamentais são estes sinais na regulação celular. A estrutura dos gradientes é em parte dependente da restrita localização e actividade das proteínas G e adenilil ciclases. A activação específica de certas adenilil ciclases permite a formação de “nuvens” de cAMP que vão variando em concentração ao longo da membrana plasmática. Também a acção de determinadas proteínas organizadas em sub-populações dentro da célula contribui para o efeito de compartimentalização. Outro factor muito importante é a acção de fosfodiesterases (PDEs), proteínas responsáveis pela degradação de cAMP. Estas têm uma localização muito abrangente, podendo ser encontradas no citosol, membrana plasmática, núcleo ou citoesqueleto celular, o que também contribui para a modulação espacial e temporal dos gradientes de cAMP.
Fosfodiesterases foram primeiramente descritas por Sutherland et al., (1962) pouco depois da descoberta da adenosina monofosfato cíclico. São fosfohidrolases que catalisam de um modo selectivo a hidrólise das ligações 3’ de fosfato cíclico de adenosina e/ou guanosina 3’,5’ monofosfato cíclico. A classe PDE compreende cerca de vinte e um genes e é subdividida em onze famílias (PDE1-PDE11) que partilham 35% a 50% de similaridade entre sequências. Estas podem ainda ser divididas em sub-famílias que abrangem proteínas com diversas isoformas.
Fosfodiesterase-4 (PDE4) é um membro da super família PDE. Tendo sido uma das primeiras famílias PDE a ser descoberta, é também uma das mais bem estudadas ao nível bioquímico, genético e fisiológico. Esta família compreende quatro genes, PDE4A/B/C/D, que codificam para mais de vinte isoformas proteicas. A conservação entre espécies destas proteínas e a existência de variadas isoformas com a mesma função catalítica implica que cada uma delas seja funcionalmente importante e sugere que as sequências génicas tenham sido sujeitas a grandes pressões selectivas ao longo da sua evolução, de forma a protegê-las de eventos divergentes ou mutacionais. A produção das isoformas proteicas é controlada pela acção de promotores distintos e splicing de RNA mensageiro.
As isoformas PDE4 possuem uma estrutura modular que consiste de uma região N-terminal característica de cada uma, um domínio catalítico altamente conservado e de uma região C-terminal específico de cada sub-família. Podem ainda ser divididas em três categorias dependendo da sua estrutura: i) long-forms que têm dois módulos UCR1 e UCR2 posicionados entre a região N-terminal e a unidade catalítica, ii) short-forms que apenas possuem um módulo UCR2, iii) e super short-form que para além de não terem UCR1, o módulo UCR2 também se encontra truncado. Os módulos UCR1 e UCR2 estão interligados por regiões de ligação LR1 e LR2 e são de grande importância para a regulação destes genes pois funcionam como um domínio regulatório que controla a unidade catalítica e mecanismos de regulação por fosforilação. Especificamente, estes dois módulos parecem interagir entre si para alterar a conformação da unidade catalítica e mediar a fosforilação por parte de outras proteínas, nomeadamente PKA e ERK. Após o aumento intracelular de cAMP, PKA fosforila PDE4 levando à degradação de cAMP. A proteína ERK também fosforila PDE4, à excepção da sub-família PDE4A, o que inactiva as long-forms e activa as short-forms. Existem também outras formas de regulação, como a via CRE/CRE-binding protein e outras proteínas como arrestinas e proteínas ancoradoras de quinase-A.
PDE4s estão associadas a diversas doenças incluindo a asma, esquizofrenia e cancro. Vários compostos com capacidade para inibir os genes PDE4 têm vindo a ser desenvolvidos ao longo dos anos, contudo, embora alguns tenham mostrado ser bastante eficientes, os efeitos secundários adversos causados nos pacientes levaram a que as pesquisas fossem descontinuadas. Uma principal razão para o insucesso destes compostos é o facto de não serem específicos para cada isoforma de PDE, inibindo várias delas ou mesmo várias das famílias em muitos dos tecidos corporais, o que traz consigo muitos efeitos indesejados. Recentemente foi desenvolvido um novo grupo de moléculas, 7H-[1,2,4]triazolo[3,4-b][1,3,4]thiadiazines, que foram apresentadas como tendo potências inibitórias específicas para a família PDE4 na escala dos nanomolar. Estas moléculas ligam-se de maneira a bloquearem o domínio catalítico da fosfodiesterase-4, o que impede a aproximação de cAMP e a sua degradação.
A relação próxima entre cAMP e proliferação celular e o seu envolvimento no desenvolvimento de células malignas têm sido das principais motivações no desenvolvimento de inibidores de fosfodiesterases-4, que uma vez inactivas levam ao aumento dos níveis de cAMP e à desregulação celular. Em estudos com leucemina linfocítica crónica, a inibição de PDE4 com rolipram aumentou os níveis de cAMP induzindo apoptose das células dependendo do tempo e da dose (Kim and Lerner 1998). Em 2002, Chen e colegas sugeriram em estudos com células de glioma que após tratamento com rolipram, a proliferação celular foi cessada e a diferenciação estimulada, seguida de morte por apoptose (Chen, Wadsten et al. 2002). Também foi demonstrado que a inibição de PDE4 em células de leucemia linfoblástica causa abrandamento do ciclo celular e morte por apoptose (Ogawa, Streiff et al. 2002), e que a combinação da administração de drogas para inibir a
família PDE4 com outros tipos de terapia, como radiação e quimioterapia, pode ter efeitos sinergéticos com melhores resultados (Goldhoff, Warrington et al. 2008).
Recentemente o nosso grupo publicou um estudo onde microdeleções homozigóticas foram identificadas no locus do gene humano PDE4D, tanto em tumores primários como em várias linhas celulares de diferentes origens cancerígenas. Contudo, tais deleções não resultaram em inactivação do gene, pelo contrário, os níveis de expressão destas proteínas foi elevada em vários dos cancros analisados, contribuindo para a proliferação e sobrevivência das células tumorais (Lin, Xu et al. 2013). Desta forma, no presente estudo decidimos estudar o impacto de dois outros genes da mesma família, PDE4A e PDE4B, em diversas linhas celulares tumorais, nomeadamente de melanoma maligno, carcinoma gástrico e adenocarcinoma da mama e do endométrio.
De modo a estudar o impacto dos genes PDE4A e PDE4B na proliferação e sobrevivência celular, silenciámos ambos os genes através da infecção das células com partículas lentivirais a expressar shRNAs que têm como alvo todas as suas isoformas proteicas. Todas as linhas celulares, à excepção da MB-231 (cancro da mama), mostraram retardamento no crescimento e morte por apoptose após o silenciamento de pelo menos um dos genes. Por outro lado, ao expressar ectopicamente o gene PDE4B2 em células de melanoma e cancro gástrico, a proliferação celular resultou em aceleramento relativamente aos controlos, tanto in vitro como in vivo, evidenciando a contribuição destes genes para aumentar as características neoplásicas em linhas celulares cancerígenas, e como consequência a tumorigenicidade. De forma a confirmar os resultados obtidos, silenciámos o gene PDE4B em células estáveis a expressar ectopicamente a isoforma PDE4B2, e observámos que a expressão deste último é capaz de prevenir as células de sofrerem morte celular após o silenciamento de PDE4B.
Por fim testámos um grupo de moléculas descritas como tendo capacidades inibitórias específicas para os genes PDE4 (7H-[1,2,4]triazolo[3,4-b][1,3,4]thiadiazines) em variadas linhas celulares de diferentes cancros. Os resultados mostraram ser promissores, uma vez que foi observado uma redução dramática na proliferação celular com morte por apoptose após tratamento com doses crescentes. Também o aumento de cAMP intracelular foi confirmado, acompanhado de um acréscimo na quantidade de proteínas associadas ao controlo do ciclo celular e redução de proteínas associadas ao aceleramento do mesmo.
Para concluir, este estudo vem sugerir que a inibição do gene PDE4 é uma potencial terapia no tratamento do cancro.
Palavras-chave
ABSTRACT
Cyclic adenosine monophosphate (cAMP) is an evolutionarily conserved secondary messenger, which is important for cell signaling regulation and gene transcription. Thus, a certain balance of cAMP levels inside the cells is required. Phosphodiesterase 4 (PDE4) genes are master regulators of both spatial and temporal cAMP levels, being essential for cAMP degradation. If PDE4 genes are not functioning properly, cAMP levels will rise up causing instability inside the cell and probably inducing cell growth arrest or apoptosis in human cancer cells. In fact, PDE4D was previously shown to have high expression levels in multiple cancers, thus contributing to proliferation and survival of tumor cells, which suggests that this gene may be a potential therapeutic target.
In the present study we explored other two PDE4 members, namely PDE4A and PDE4B. We manipulated gene expression of these cells in a panel of different human cancer cell lines and our data suggests that these two genes are of great importance to cancer cells, without which cells cannot proliferate and survive. We also showed both in melanoma and gastric cancer that ectopic expression of PDE4B contributes to a better and faster proliferation of the cell lines and, for the specific case of melanoma, higher levels of PDE4B may be related to a higher capability of cell migration.
We also tested a set of novel small molecules reported to be selective inhibitors of PDE4 with nanomolar potencies. Our data suggests that this new compound possess anti-neoplastic capabilities against a wide panel of different human cancer cell lines, both in vitro and in vivo.
Keywords
LIST OF FIGURES
Figure 1. Map of pLKO.1 containing an shRNA insert. 23
Figure 2. Map of SHC003 (TurboGFP) vector. 27
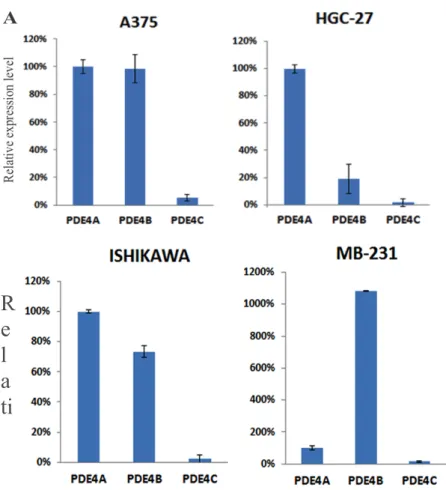
Figure 3. Determination by qPCR of PDE4 genes (A, B and C) mRNA relative expression
level in a panel of different cancer cell lines. Data represents the mean ± SD of two
independent experiments. 36
Figure 4. PDE4A/B knockdown was confirmed at 96 hours after infection in a number of
different cancer cell lines. Depletion of indicated PDE4 genes triggered apoptosis by cleavage of PARP. β-Actin was used as a loading control. N.D. means “no data”. Cells were infected for 48 hours, selected with puromycin for 48 hours, then cell lysates were subjected
to western blot using indicated antibodies. 37
Figure 5. After infection cells were seeded 3-4 × 10³ cells/well and cultured for 5 days. MTT
assay was performed in a panel of different cancer cell lines, using scramble shRNA as a control and shPDE4A (1,2) and shPDE4B (1,3) targeting each gene separately. Quantification is expressed by OD value 570nm. Data represents the mean ± SD of two
independent experiments. 38
Figure 6. Cells were infected for 48 hours with indicated shRNAs and selected with
puromycin for 48 hours. After that, cell morphologies were photographed. 39
Figure 7. (A) Cancer cell lines were subjected to western blot analysis 96 hours after
infection with lentiviral particles encoding either non-targeting shRNA (scramble) or shRNAs targeting human PDE4A and PDE4B genes. The knockdown was confirmed using PDE4A and PDE4B primary antibodies. Presence of apoptosis was verified with cleaved PARP antibody. β-Actin was used as a loading control. (B) Assessment of relative mRNA
expression level in representative cell lines. 41
Figure 8. A375 and HGC27 cells stably expressing either GFP or PDE4B2 were generated (A) and examined by short-term cell proliferation assay in the presence of 1% fetal bovine
serum (FBS). Data represents the mean ± SD of two independent experiments. Significant p-value is represented by (*). (B) Lysates from the respective cell lines were subjected to western blot analysis with indicated antibodies. β-Actin was used as a loading control. L.E means long exposure, S.E means short exposure. (C) Relative mRNA expression level of
PDE4B2 gene and GFP as a control. 42
Figure 9. A375 melanoma cell line and HGC27 gastric cancer cell line stably expressing
GFP (control) or PDE4B2 were seeded 500 cells per well in soft-agar in DMEM plus 10% FBS and incubated at 37ºC for 1 to 2 weeks. After incubation period, cells were stained with
crystal violet and (A) colonies were photographed (B) and counted. *P-value = 0.038. Data
represent the mean ± SD of two independent experiments. 43
Figure 10. A375 and HGC27 cell lines stably expressing PDE4B2 isoform were assessed by
Annexyn V-APC/proptidium iodide exposure after being transduced with shRNAs encoding either non-targeting (scramble) or PDE4B3 shRNAs. Protein analysis confirmed FACS results in A375 cells. Data represents the mean ± SD of two independent experiments. 44
Figure 11. Comparison of the cell migratory abilities of A375 and HGC27 cell lines stably
expressing either GFP (control) or PDE4B2. (A) Schematic of cell migration assay. (i) Cells were placed in the upper chamber of a cell culture insert in medium supplemented with 1% FBS, (ii) lowered into a well of a 24-well plate with fresh medium plus 10% FBS and incubated for 48 hours. (iii) Cells may adhere and migrate through the collagen membrane in response to the presence of FBS. (B) Crystal violet plus methanol staining of either GFP or PDE4B2 cell lines, which have adhered and migrated through the underside of the collagen. Six different sections were photographed and cells were counted (*P = 0.021). Data
represents the mean ± SD of three independent experiments. 45
Figure 12. In vivo effect of PDE4B2 ectopic expression in A375 human melanoma
xenografts in a murine model system. Pictures (A) and weights (B) of all of the dissected tumors (six tumors for each group). Tumors derived from A375 ectopically expressing PDE4B2 show dramatically higher weights and volumes comparing to control GFP (P =
0.0047). 46
Figure 13. PDE4 inhibitors suppressed the proliferation of human malignant cells from
various origins. (A) Chemical structures of the PDE4 inhibitors NCGC00165289 (PI-5), NCGC00167114 (PI-10) and NCGC00168459 (PI-18) as well as NCGC00165288 [inactive control (PI-control)] used in this study. (B) A panel of cancer cell lines was cultured in 6-well plates and treated with indicated compounds (1×10⁻⁶ M) for 10-14 days. Cells were
stained by crystal violet and photographed. The crystal violet staining was then measured by OD595PDE4 Inhibitor/OD595 Inactive control of each respective cell lines and expressed as a percentage
of proliferation in the inactive control. Data shown are representatives of three independent experiments. #, P < 0.01; *, P < 0.05 for the comparison of individual PDE4
inhibitor-treated samples with the inactive control inhibitor-treated samples. 47
Figure 14. Various cancer cell lines were seeded into 96-well plates at 2-5 × 10³ cells/well
and cultured overnight, then treated with increased concentrations of PI-18 and incubated for additional 48-72 hours. Cell proliferation was measured by MTT staining. 49
Figure 15. HGC27 cells were treated with either PI-control, PI-18 (1 × 10⁻⁶ M) or
Assay Kit (Cell Signaling Technology). SD represents data from two independent
experiments. *P < 0.05. 50
Figure 16. (A) Cancer cells were treated with either PI-18 (1×10⁻⁶ M) or inactive control (1×10⁻⁶ M) for indicated durations and subjected to flow cytometry (FCM) analysis by Annexin V-FITC/propidium iodide staining. Data are representatives of three independent experiments. *P < 0.05 for the comparison of PI-18- treated samples versus the inactive
control-treated samples. 50
Figure 17. After culturing cells with PI-18 in a time-dependent fashion, total cell lysates
were subjected to SDS-PAGE and western blotting analysis using the indicated antibodies.
GAPDH was used as internal loading control. 51
Figure 18. In vivo effect of PI-18 on A375 human melanoma xenografts in a murine model
1. INTRODUCTION
1.1 cAMP and the compartmentalization concept
Cyclic adenosine 3’, 5’-monophosphate (cAMP) is a ubiquitous second messenger which plays pivotal roles inside the cells. Basically, cells are able to recognize both chemical and physical signals from the exterior environment and translate them into their one “language”, thus generating coordinated responses and regulating processes like metabolism, cytoskeletal function, gene expression, proliferation and cell cycle (McCahill, Huston et al. 2008). Those signals will trigger changes in intracellular concentrations of the cyclic nucleotides, cAMP and also cyclic guanosine 3’, 5’-monophosphate (cGMP), which function as intracellular second messengers, together with other nucleotides, lipids and ions. Since its discovery, cAMP has been a focus of attention among the scientific community, appearing today as a picture of extreme complexity and indispensable for the regulation of downstream biological processes (Beavo and Brunton 2002)
cAMP is generated from ATP through the action of adenylyl cyclases (ACs) at the cytosol surface of the plasma membrane (Cooper 2003). This capacity of converting ATP into cAMP was adopted by diverse kinds of organisms, such as Paramecium, Euglena, Dictyostelium and Homo sapiens (Tang, Yan et al. 1998; Iseki, Matsunaga et al. 2002). These ACs are themselves activated by transmembrane G-protein coupled receptors (GPCRs), which after receiving an agonist stimulation will pair to stimulatory G-protein (Gs) to activate ACs and produce cAMP (McCahill, Huston et al. 2008). Once cAMP is generated, it interacts with several effector proteins, such as protein kinase A (PKA), exchange proteins activated by cAMP (EPACs) and cAMP-gated ion channels (CNGCs), thus triggering many different physiological responses (McCahill, Huston et al. 2008; Houslay 2010).
The changes in cyclic nucleotide concentrations can be extreme, being either short-lived or lasting for hours or days. So huge range of different durations in which the cyclic nucleotide signals develop, in addition to the evidence of intracellular targeting of signaling components, suggests that cyclic nucleotides transmits complex instructions to the cell. These signals are critical for interaction with the environment and shows a multidimensional nature, not only temporal but also spatial and concentration dependent(Conti and Beavo 2007).
It is now well recognized that cAMP signaling responses are compartmentalized. Brunton and collegues first originated the concept of compartmentalization back in 1981, originated from their work on cardiac myocytes. Their publication demonstrated that cAMP after being generated by stimulation of different Gs-coupled receptors led to differential activation of the type-I and type-II isoforms of PKA (Brunton, Hayes et al. 1981). From that time on, this idea has been extended to a variety of other cell types and processes (Beavo and Brunton 2002).
The structure of these cAMP gradients is in part dependent on the activity and restricted localization of GPCRs and adenylyl cyclases that generate cAMP to specific regions of the plasma membrane. Specific GPCRs activates also particular ACs, generating “clouds” of cAMP from different plasma membrane sites. Moreover, there are several ACs families identified, varying significantly outside of their conserved catalytic domains and each one being regulated by other signaling pathways (particularly Ca2+), which elevates even more the specificity of this signals
(Cooper 2003).
At the same time, soluble proteins PKA and EPAC, which are found in sub-populations in the cythosol, can also form distinct pools in a way to accomplish compartmentalization. These cAMP effectors are sequestered to specific intracellular complexes together with their downstream targets. In particular, A-kinase anchoring proteins (AKAPs) are a family of anchor proteins that specifically sequester PKA isoforms through the interaction of a short α-helical structure with PKA regulatory subunits (Houslay 2010). The cell-type-specific expression pattern of AKAPs, plus their particular intracellular distribution pattern, are responsible for the formation of PKA populations inside the cell and modulate their response to cAMP gradients (Houslay and Adams 2003).
The basis of such gradients not only depends upon the activity and localization of both adenylyl cyclases and cAMP effectors, but also depends on phosphodiesterases (PDEs), the proteins responsible for cAMP degradation. There is evidence showing that PDEs are localized in distinct intracellular sites in order to degrade cAMP produced, which in fact is the only way of reducing cAMP levels in the cell. PDEs activity may be found in a variety of different locations, including the cytosol, membrane, nucleus and cell cytoskeleton, thus modulating the spatial and temporal characteristics of cAMP gradients (Houslay and Adams 2003). Additionally, some AKAPs can bind other signaling proteins (protein phosphatases, protein kinases, GTPases and adaptor proteins) providing further regulation of these compartmentalized complexes (Tasken and Aandahl 2004; Carnegie, Means et al. 2009).
1.2 Phosphodiesterase Enzymes
1.2.1. PDE family and nomenclature
The cyclic nucleotide phosphodiesterase enzymes (PDEs) were first described in 1962 by Sutherland and colleagues right after cAMP discovery (Butcher and Sutherland 1962). PDEs are a family of related phosphohydrolases which catalyzes in a selective way the hydrolysis of the 3’ cyclic phosphate bonds of adenosine and/or guanosine 3’,5’ cyclic monophosphate. Mammalian PDE enzymes belong to class I of cyclic nucleotide PDEs, in a way to avoid confusion with class II, which are found in many species including mammals. Besides having different substrate selectivity they also catalyze the same reaction (Bender and Beavo 2006). Class I PDEs have an HD domain in
the C-terminal and show high affinity for cAMP and/or cGMP. Protein domains responsible for regulating PDE enzymatic activity and sub-cellular localization are mainly found in the N-terminal half (Omori and Kotera 2007).
There are twenty-one PDE genes in class I identified in humans, mouse and rat, and corresponding proteins have been characterized based on their regulatory and physicochemical properties. In terms of their structural similarity, such as sequence homology, protein domains, and enzymatic properties (specificity, kinetic properties and sensitivity to endogenous regulators and inhibitors) the class I of PDEs can be further subdivided into 11 families (PDE1-PDE11) (Conti and Beavo 2007; Omori and Kotera 2007). However, the twenty-one genes are not only transcribed in twenty-one mRNAs, due to the alternative transcriptional start sites and alternative splicing of mRNA precursor molecules. It is estimated that more than one hundred different mRNA products may exist, most of which can be translated into different proteins. Nonetheless, the number of different PDE mRNAs transcribed is still unknown, given the difficulty of predicting transcriptional start sites and splice variants (Bender and Beavo 2006).
Among the different PDE families, a sequence identity of 35% to 50% is shared, with approximately 270 amino acids in the C-terminal catalytic domain being conserved. Some PDE families are composed of two to four subfamily genes, showing more than 70% sequence identity and having equal proteins domains organization (Omori and Kotera 2007).
An example of a typical name for this PDE family would be HsPDE1A2. The Hs tells the specie of origin (Homo sapiens); PDE means 3’,5’ cyclic nucleotide phosphodiesterase; the first Arabic number (1) means that the gene is a member of PDE1 family; the following capital letter (A) indicates the subfamily gene and finally, the last Arabic number (2) corresponds to a specific splice variant (isoform) (http://depts.washington.edu/pde/).
1.2.2 PDE structure and main roles
In order to regulate the levels of cAMP and cGMP, all cells express PDEs to hydrolyze cAMP and cGMP to 5’-AMP and 5’-GMP, respectively. The unique features of each PDE gene family are defined by protein domains located from the N terminal to the catalytic unit. The GAF protein domain is very prevalent among the PDE families, being present in approximately half of them. This domain has as main roles the cGMP binding-mediated allosteric regulation (although some have been reported to also bind cAMP) and dimerization of GAFPDEs. The other PDEs, like PDE1, 3, -4, and PDE 7 – 9 have no GAF domain, being part of the non-GAF-PDE subfamily.
For each PDE there is a glutamine that stabilizes the binding of a purine ring in the binding pocket (Zhang, Card et al. 2004). PDEs bind to both cAMP and cGMP through hydrogen bonds, however, for the appropriate forming of these bonds, the glutamine must be able to rotate freely. But depending on its structure, PDEs fall into three categories: those that are specific for cAMP, those
specific for cGMP, and those that can bind and regulate both of the cyclic nucleotides (Zhang, Ibrahim et al. 2005). Therefore, for all the PDEs that hydrolyze both cAMP and cGMP, with relatively high affinity, this glutamine rotation happens freely. In the other hand, for PDEs with high affinity for cAMP at low substrate levels, the glutamine cannot rotate because it is constrained by residues that favor the orientation for cAMP binding. Exactly the opposite is observed for PDEs selective for cGMP, having a glutamine in different orientation (Zhang, Card et al. 2004).
The main role of many PDEs is to control the “clouds” of cAMP inside the cell, in terms of duration, three-dimensional shape and amplitude. However this concept is not so strict, since some PDEs may be specialized in keeping the cloud from spreading to not appropriate cell regions, while others regulate local access to specific cAMP and cGMP receptors in the cell (Bender and Beavo 2006).
1.3. Phosphodiesterase-4 (PDE4)
Phosphodiesterase-4 (PDE4) is a cAMP-specific member of the cyclic nucleotide PDE super family. This family was first described right after the development of assays specific to detect PDE activity at low substrate levels. This early discovery made this family one of the most well studied PDEs, with plenty of data published about its biochemistry, genetics and physiological function (Bender and Beavo 2006).
PDE4s are highly conserved over evolution, being also present in other species such as Drosophila melanogaster and Caenorhabditis elegans, and extremely identical between human and mouse as well. PDE4 comprises four genes, PDE4A/B/C/D, which encode over 20 distinct isoforms (Houslay 2010). This plethora of isoforms has been shown to be differentially involved in intracellular targeting with other signaling pathways and are expressed in a wide range of tissues and cell types, playing a role in a large number of physiological processes (McCahill, Huston et al. 2008).
However, what is the reason for existing so many PDE4 genes (plus isoforms) since they seem to have the same role, mainly hydrolyzing cAMP with identical Km and similar Vmax values?
Conservation among species and the existence of all these genes and isoforms with the same catalytic action implies functional importance for each of them (Houslay 2010), suggesting that these sequences have been subjected to strong selective pressure during evolution to protect them from diverging or getting mutations. This kind of evolution is by itself an evidence for the fact that PDE4 genes play key roles inside the cell (Houslay and Adams 2003).
Over the past decades, PDE4 family has been a focus of attention because of its selective inhibitors that have potential therapeutic use in a range of major diseases. As the knowledge and biology understanding of this enzyme grows, the development of increasingly efficacious inhibitors has progressed (Houslay, Schafer et al. 2005).
1.3.1. PDE4 structure
As mentioned above, the mammalian PDE4 family comprises around 20 isoforms. Each gene of the family is about 50 kb length and spans about 20 exons. The generation of these isoforms is under the control of distinct promoters and by alternative mRNA splicing (Houslay and Adams 2003).
The individual isoforms are each characterized by unique N-terminal regions, which in most of the cases is encoded by a single 5’ exon (Houslay and Adams 2003). The use of distinct promoters (Rena, Begg et al. 2001; Le Jeune, Shepherd et al. 2002) plus the control of mRNA stability (Liu, Palmer et al. 2000) leads to the formation of specific isoform expression patterns.
PDE4 isoforms have a modular structure that consists of an i) isoform-specific N-terminal region, which characterizes each isoform and allows the interaction with specific binding partners, ii) a highly conserved catalytic domain encoded by six exons, iii) and a sub-family-specific C-terminal region. They are divided into three main groups depending on variants of its genetic structure. These categories were first described by Bolger and collaborators (Bolger, Michaeli et al. 1993), which are divided into long, short and super-short forms. Long isoforms have two modules conserved in all four PDE4 subfamilies, called upstream conserved region 1 (UCR1) and upstream conserved region 2 (UCR2), positioned between the isoform specific N-terminal region and the catalytic unit. In contrast with long forms, short forms have an intact UCR2 but lack UCR1, while the super-short forms not only lack UCR1 but also contains an N-terminally truncated UCR2 (Houslay 2001). Finally there is still another category, called “dead-short” because it is catalytically inactive due to its truncated N- and C-terminals (Johnston, Erdogan et al. 2004). UCR1 and UCR2 are linked together by linker region 1 (LR1) and to the catalytic region by linker region 2 (LR2). The short connecting regions are not conserved, showing great variations between PDE4 sub-families (McCahill, Huston et al. 2008).
UCR1 and UCR2 are of great importance for PDE4 regulation, mainly functioning as a regulatory domain that provides the molecular machinery to control the catalytic unit and also determining PDE4 regulation through PKA and extracellular signal regulate kinase (ERK) phosphorylation (Beard, Olsen et al. 2000).
The first crystal structure of the PDE family was based on analysis of the compact core catalytic domain of the short isoform PDE4B2B, done by Xu and colleagues (Xu, Hassell et al. 2000). It revealed a compact α-helical structure consisting of 17 helices folded into three sub-domains. At the junction of the three sub-domains, a deep pocket can be found and is lined with highly conserved, hydrophobic and negatively charged residues. There are two metal ions coordinated by the residues, and apparently, these interactions seem to hold these three domains together. The first metal ion is zinc ion (Zn2+), which is coordinated by conserved (across all the PDE family members) and paired histidines and aspartates; and one water molecule, located at the wider side of the active site. At the same location is the second metal ion, a magnesium ion (Mg2+), which is coordinated by the same aspartate that coordinates Zn2+ and four water molecules (one of which bridges Mg2+ and Zn2+).
At the active site, three clusters of residues can be found, underpinning three different functions: (1) nucleotide recognition, where a cluster of residues determines the orientation of the amide group of a glutamine for selective binding to cAMP or cGMP; (2) substrate binding, where two conserved residues form a hydrophobic clamp; (3) hydrolysis, a cluster conserved residues responsible for cyclic nucleotide hydrolysis (Zhang, Card et al. 2004).
The mechanism of cyclic nucleotide hydrolysis is still unclear, but there are some theories about it. It is possible that the hydrolysis proceeds with a nucleophilic attack of the cyclic nucleotide phosphate. Back in 2001, Zhan & Zheng based their study on PDE4B structure, and through quantum chemical calculations they suggested that the bridging water between Zn2+ and Mg2+ ions is a hydroxyl that plays the nucleophile role in the hydrolysis (Zhan and Zheng 2001).
Later, co-crystal structures of PDE4B and PDE4D brought up a new idea about the hydrolysis mechanism. There is the possibility that an invariant aspartate serves as a general base to deprotonate the bridging water activated by the coordinated Zn2+ and Mg2+ ions. The resulting hydroxide may act as the nucleophile that attacks phosphorous through an associative mechanism (Huai, Colicelli et al. 2003; Xu, Rocque et al. 2004).
1.3.2. Regulation of PDE4
PDE4 activity is regulated at a number of different ways, either at the transcriptional level, through the regulation of mRNA stability or by multi-site phosphorylation at a post-translational level (McCahill, Huston et al. 2008).
UCR1 and UCR2 domains play a central role in coordinating the regulation by phosphorylation. These two domains seem to interact with each other via electrostatic interactions between the hydrophobic C-terminal portion of UCR1 and the hydrophilic N-terminal region of UCR2. This interaction possibly alters the conformation of the catalytic unit and mediates the outcome of phosphorylation by PKA and ERK (Houslay 2001).
The first clue about this UCR1/2 regulation capacity came up with N-terminal truncation studies, where the removal of UCR2 N-terminal portion caused an increase of PDE4 catalytic activity, suggesting that UCR2 may apply a constitutive inhibitory effect on the activity of PDE4 catalytic unit (Jin, Swinnen et al. 1992). The constitutive inhibitory effect of UCR2 on PDE activity can be attenuated by PKA phosphorylation at the N-terminal region of UCR1, which in short forms is absent, showing the importance of alternative splicing (MacKenzie, Baillie et al. 2002).
Upon elevation of intracellular cAMP, PKA phosphorylation of UCR1 leads to the activation of PDE4, providing a feedback mechanism to reduce cellular cAMP levels after stimulation. In fact, such PDE4 activation can be highly dramatic, around 60% in long isoforms of mammalian cells (MacKenzie, Baillie et al. 2002). Phosphorylation by PKA is also thought to cause a conformational
change that disrupts the interaction between UCR1 and UCR2, which also stimulates PDE4 activity (Beard, Olsen et al. 2000).
In addition to PKA phosphorylation, PDE4s can also be regulated via phosphorylation by the MAP kinase ERK. With only PDE4A exception, all the other PDE4 subfamilies contain a single ERK consensus motif (P-X-S-P) localized at the third sub-domain of their catalytic unit. The role of ERK MAP kinase signaling pathway relies on several growth factors and hormones that have a pivotal contribution in cell growth and survival (Houslay and Adams 2003; McCahill, Huston et al. 2008). PDE4 phosphorylation by ERK is dependent on the presence of UCR1 and UCR2, leading to different outcomes: long forms are strongly inhibited, short forms are activated, and super-short forms are slightly inhibited (Hoffmann, Baillie et al. 1999; MacKenzie, Baillie et al. 2000). This finding suggested that the presence of UCR1 domain determines the consequences of the phosphorylation at the C terminus. In long isoforms, inhibition induced by ERK phosphorylation can cause an increase in localized cAMP, leading to activation of PKA that, in turn, phosphorylates UCR1 to activate the PDE4 enzyme and cease ERK inhibition, in a feedback regulatory system. Therefore, a huge characteristic of ERK-mediated inhibition of PDE4 isoforms is its transience, because rapidly can be reversed by PKA. Also, such inhibition will depend greatly on the cell type, the nature of the stimuli and timing/duration (Houslay and Adams 2003).
Regulation of PDE4 also occurs at the transcriptional and translational levels. PDE4 gene products have a very wide distribution and many of the isoforms and variants are tissue and cell type specific. The expression pattern specificity of different isoforms is very important in determining response to their phosphorylation by PKA and ERK however, some other regulation mechanisms appear to be in operation. Several PDE4 intronic promoters have been described and one of the common findings for many of them is regulation by cAMP via CRE/CRE-binding protein. The existence of multiple promoters allows different combinations of long and short isoforms to be expressed as required (McCahill, Huston et al. 2008). The expression of some of the PDE4 isoforms was shown to be sensitive to cAMP. This effect is mediated by elements involved in cAMP response (CREs), in the promoter regions of PDE genes. After the binding of a ligand to a receptor coupling to a G-protein, adenylyl cyclases are stimulated and produce cAMP. Binding of cAMP to PKA triggers the dissociation of the catalytic subunits of PKA from the regulatory subunits. These catalytic subunits phosphorylate CREB (CRE binding protein), which in turn modulates gene transcription (Mayr and Montminy 2001).
A variety of other agents have been reported to regulate PDE4 expression. Arrestin gene family is an example of those agents. It has been shown that β-arrestins form a complex with PDE4 enzymes, thus delivering them to the site of active cAMP synthesis in the plasma membrane (Perry, Baillie et al. 2002). Also AKAPs (A kinase-anchoring proteins) are involved in PDE4 regulation. Although PKA may interact directly with PDEs, these scaffold proteins mediate most interactions with kinases and phosphatases. AKAPs interact with PKA, phosphatases and PDEs, anchoring these
complexes in specific sub-cellular domains. They are able to detect intracellular gradients of cAMP and generate a compartmentalized response on PKA targets. PKA activation by local cAMP phosphorylates and activates PDE4, which in turn reduces cAMP (Conti and Beavo 2007).
1.4. PDE4 inhibitors as a therapy
The importance of PDE4 subfamily was first highlighted from studies in D. melanogaster showing that the gene encoding for a family of PDE4 isoforms, dunc, is actually related to the learning and memory functions (Davis 1996). Later on, diverse studies about PDE4 inhibitors were done showing anti-depressant and cognitive enhancement results (O'Donnell and Zhang 2004). Also in 2009, Vecsey and colleagues showed that sleep disturbances result in up-regulation of a specific PDE4A isoform, leading to cognitive deficits that are further improved upon PDE4 inhibitor treatment. PDE4s have been linked to a wide range of other diseases, such as schizophrenia (Fatemi, King et al. 2008), ischemic stroke (Munshi and Kaul 2008), asthma (Himes, Hunninghake et al. 2009), osteoporosis (Reneland, Mah et al. 2005) and cancer (Kim and Lerner 1998; Chen, Wadsten et al. 2002; Ogawa, Streiff et al. 2002; Goldhoff, Warrington et al. 2008; Lin, Xu et al. 2013).
Right after PDE activity discovery, it was found that caffeine was an effective inhibitor of these enzymes, leading to the production of a widely used therapeutic agent for bronchial asthma treatment, theophylline (caffeine analog). However, it comes along with harsh side effects like cardiac dysarhythmias and nausea, probably resulting from non-selectivity among PDEs (Page 1999). In fact, most of the early PDE inhibitors had a very narrow therapeutic index due to the fact that its non-specificity would cause inhibition of most PDE activity in every tissue, which is also harmful to the body.
First-generation PDE4 inhibitors include rolipram and Ro20-172 that belong to the catechol diether class. But once more, the side effects including nausea, vomiting and increased gastric acid secretion interrupted their development for the treatment of chronic obstructive pulmonary disease (COPD). As a result, contemporary drug discovery efforts in PDE4 have been conducted in order to design novel inhibitors with reduced side effects while keeping the anti-inflammatory properties of rolipram (Zhang, Ibrahim et al. 2005).
Other second and third-generation PDE4 inhibitors have been developed, however, a lot of them have been also discontinued due to narrow therapeutic index.
One significant reason for PDEs being considered good therapeutic targets is related to the basic pharmacological principle that regulation of degradation of any ligand or second messenger can often make a faster and larger percentage change in concentration when compared to regulation of the rates synthesis. This property can be further enhanced if the machinery in the cell that works on the degradation has an intrinsically higher Vmax value than the machinery for synthesis, and in fact, it
is already known that most of the tissues contain a higher maximal activity of PDE than cyclase activity for either cAMP or cGMP. As mentioned above, there is a large number of PDE subfamilies
and respective isoforms expressed in mammalian tissues, and each one is believed to have an unique active site, leading to different physiological functions in the body. Thus, the development of isoform selective inhibitors that can target specific pathological conditions with low and nonspecific side effects is currently the main goal in PDE4 inhibitors development.
Another reason for the suitability of PDE as a drug target is the fact that levels of cAMP in most of the cells are usually less than 1-10 µM. This means that a competitive inhibitor would not need to compete with very high levels of endogenous substrate to be effective (Bender and Beavo 2006).
Recently, a series of substituted 7H-[1,2,4]triazolo[3,4-b][1,3,4]thiadiazines were introduced as potent PDE4 inhibitors. Skoumbourdis and colleagues (Skoumbourdis, Leclair et al. 2009) analyzed several new analogues and evaluated their inhibitory potency against PDE4A. From this study they selected some compounds with good potency profiles, called 5, 10 and 18. These molecules were shown to be highly selective for PDE4 versus other PDE family members, although it does not posses subtype selectivity across PDE4 isozymes. Moreover, the selected analogues were analyzed in terms of the ability of PDE4 to reduce cAMP and PKA activity, demonstrating both experiments the high utility of these novel reagents. Also docking studies explored the binding modality of these compounds, revealing that the catachol diether forms an integral hydrogen bond with Q443 and the aromatic moiety is localized between the conserve leucine and phenylalanine. The rest of the molecule is extended into the catalytic domain, quite close to both Zn2+ and Mg2+ metals.
This orientation seems to block the approach of cAMP to the catalytic domain, inhibiting its degradation.
1.5. cAMP and cell growth control
The possibility that cyclic nucleotides are involved in cell growth and differentiation is not new. Indeed, a few studies suggested inhibitory effects of cAMP in cell proliferation, becoming a source of interest and attention to scientific community (Friedman 1976).
The fact that cAMP appears to be an important mediator of cellular proliferation implies that its intracellular concentration must be very well controlled. As mentioned above, the level of cAMP in the cell is determined by the activity of adenylate cyclase, which catalyzes the production of this cyclic nucleotide from ATP.
Studies with fibroblasts, which exhibit density-dependent inhibition of growth, have demonstrated that cAMP levels increase when cells approach confluency, causing growth arrest. This event is probably caused by the rising of adenylate cyclase activity. In NRK cells, the same was observed as the cells reached confluency and growth slowed down, adenylate cyclase activity kept rising up. It suggests that the elevated cyclase activity reflects an increased population of cells arrested in the G1 (G0) phase of the cell cycle, probably induced by cell-to-cell contact (Pastan,
Generally, factors capable of decreasing cAMP levels stimulate cultured cells proliferation, while factors that increase cAMP levels should cause a decrease in cellular growth rate. In neoplastic cells, normal growth control mechanisms were lost and they show the ability to grow faster without any limits. This uncontrolled growth may in part be caused by altered cAMP metabolism. For this reason, the levels of adenylate cyclase activity are often lower in transformed cells, as observed in hepatoma cells lines (Pastan, Johnson et al. 1975).
Cyclase activity varies at different time points in the cell cycle and along with increasing cell population density. When cells enter the G1 state, a sequence of events begins leading to DNA
replication, chromosome condensation and mitosis. The finding that cAMP concentrations vary with the stage of synchronized cells suggests that cAMP play a regulatory in the cell cycle. Friedman (Friedman 1976) reviewed several studies about measuring cAMP levels along the cell cycle. Despite being very troublesome synchronizing the cells, the most reproducible cell-cycle change in cAMP content, independently of the cell type, is the diminished levels during mitosis. Another generalization might be about the maximum levels achieved frequently during middle or late G1
period, although sometimes these levels are even prolonged to S phase. The finding that cAMP levels drop to low levels during late G2 and mitosis is consistent with the idea that cAMP levels must
be low in order for cells to traverse G2.
The lower level of cAMP in transformed cells compared to normal cells seems to be involved in many of the transformed cells properties, including their altered morphology, motility and adhesiveness. Apparently, cAMP play roles in microtubules and microfilaments, and when its levels are altered transformed cells properties may arise. Moreover, in neuroblastoma, beyond morphological changes, the PDE inhibitor DBcAMP markedly diminished the growth rate and final cell density (Prasad, Gilmer et al. 1973).
1.6. PDE4 and cancer
The findings about the close relation between cAMP and cell growth and its involvement in cell malignancy have evoked great interest on the usage of PDE4 inhibitors to raise up cAMP levels in cancer cells. In 1998, Kim and Lerner showed that treatment of Chronic Lymphocytic Leukemia (CLL) cells with PDE4 family-specific inhibitor rolipram increased cAMP levels and induced apoptosis in a dose- and time dependent manner (Kim and Lerner 1998).
Also in 2002, Chen and colleagues reported that glioma cells treated with rolipram underwent growth arrest and differentiation, followed by apoptotic cell death. Specifically, A-172 glioma cells harbor a mutant form of the tumor suppressor p53. p53 can transcriptionally stimulate p21Cip1
expression causing cell cycle arrest in response to different types of cellular stress, as chemotherapy and radiation. In this study, the authors suggested that rolipram is able to stimulate p21Cip1 and
induce growth arrest, even in the absence of p53 (Chen, Wadsten et al. 2002). In human acute lymphoblastic leukemia cells (ALL) the efficacy of a variety of PDE inhibitors was also tested,
which demonstrated additive effects of these PDE inhibitors with adenylyl cyclase activator. These combinations involved inhibition of PDE4 subclass and leaded to cell cycle arrest and apoptosis of ALL cells (Ogawa, Streiff et al. 2002).
In 2008, Goldhoff and colleagues showed that PDE4 inhibition may also be used together with other therapies, since they demonstrated that PDE4 inhibition could promote regression of malignant brain tumors when administered as an adjunct to established therapies, such as radiation and chemotherapy (Goldhoff, Warrington et al. 2008).
Cancer genomes are characterized by a high number of copy number amplifications and deletions, which target driver genes and tumor-suppressor genes, respectively. These genomic events may be a source of unique vulnerabilities in cancer cells (Muller, Colla et al. 2012). In a very recent study, Lin el al. identified homozygous microdeletions in the human PDE4D gene locus both in primary tumors and in various established cancer cell lines. However, deletions did not result in inactivation of PDE4D, but PDE4D protein expression levels were elevated in multiple types of cancers contributing to proliferation and survival of tumor cells. This study presents PDE4D as a vulnerability of cancer cells and a potential therapeutic target (Lin, Xu et al. 2013).
2. AIMS
This study aims to investigate the role of PDE4A and PDE4B genes in a panel of different cancer cell lines and to evaluate how dependent tumor cells are on these genes in order to keep their neoplastic phenotype. We also asked whether a recently reported molecule compound that inhibits PDE4 family was able to induce anti-neoplastic events.
Thus, to accomplish these aims it is essential to use cell lines from different cancers, including stomach, breast, endometrium and skin. The first goal was achieved through biological study, making use of either shRNA constructs targeting PDE4A and PDE4B, or PDE4B2 vectors. The genes were manipulated, either for depletion or ectopic expression in order to assess cell proliferation, protein content and migration capabilities. The second goal was achieved by a cytotoxicity study, in which a wide panel of cancer cell lines was exposed to the drug and different parameters were analyzed in a way to evaluate its anti-neoplastic potency. For both goals in vivo experiments were also performed.
3. MATERIALS AND METHODS
3.1. Human cell lines, cell culture and chemicals
The following experiments involve the use of well-characterized human cancer cell lines. All of the human cancer cell lines were maintained at 37ºC in a 5% CO2 air humidified incubator in
ATCC (American Type Culture Collection) suggested conditions. Malignant melanoma (A375, M368), endometrial adenocarcinoma (Ishikawa), gastric carcinoma (HGC-27) and breast adenocarcinoma (MDA-MB-231, MCF-7) cell lines were grown in monolayer in DMEM medium supplemented with 10% fetal bovine serum (FBS). Culture medium was changed every 2 days and cells were split when 95% of confluence was reached. Cells were kept as a stock in FBS supplemented with 10% Dimethyl Sulfoxide (DMSO) at -80ºC.
Cells were always handled inside the laminar flow hood, using sterile materials. Since the cells grow in monolayer attached to the plate surface, trypsine-EDTA (0,5%)1 diluted 1:10 in 1 x PBS2, is
added to the cells, following 2-3 minutes incubation (depending on the cell line) inside the incubator. Trypsine is an enzyme capable of removing adherent cells from a culture surface. After incubation, adding culture medium to the cells stops the Trypsine effect. Finally, cells are split into other plates according to the experiment in progress.
8-chloro-cAMP (Cl-cAMP) was purchased from Biolog (Bremen, Germany). Other chemicals used were of the highest grade available from Sigma-Aldrich. Enzymes and respective buffers were bought from New England Biolabs, unless other brand is mentioned.
3.2. Construction of shRNA vectors
As a cloning vector, pLKO.1 TRC3 (Addgene) was used (Figure 1). pLKO.1 is a replication-incompetent lentiviral vector chosen by the The RNAi Consortium for expression of shRNAs. It is used as a backbone that can either be introduced into cells via direct transfection, or be converted into lentiviral particles for subsequent infection of the target cells. This vector contains on its structure a puromycin resistance marker (allowing convenient stable selection) and a U6 promoter.
1 Sigma-Aldrich. “Trypsin-EDTA solution from porcine pancreas Cell Culture Tested”. Trypsine-EDTA 0,5% (10×) is
diluted 1:10 in 1 × PBS.
2 1x Phosphate buffered saline is diluted from 10 x PBS. The resultant 1x PBS should have a final concentration of 137
mM NaCl, 10 mM Sodium Phosphate dibasic, 2.7 mM KCl, and adjusted pH to 7.4.
3 Addgene - pLKO.1 – TRC Cloning Vector. Source: http://www.addgene.org/tools/protocols/plko (last consulted on 1st
September, 2013).
Figure 1. Map of pLKO.1 containing an shRNA insert3.
Table 1. Annealing Oligos Mix.
The shRNAs target sequences used are listed in Supplemental Table S1. The shRNA oligos were designed according to the following construction:
• Forward oligo: 5’ CCGG-21bp sense-CTCGAG-21bp antisense-TTTTTG3’ • Reverse oligo: 5’AATTCAAAAA-21bp sense-CTCGAG-21bp antisense 3’
The process of cloning shRNAs into pLKO.1 comprised the following steps:
Oligos annealing
Oligos concentration was first adjusted to 20
µ
M and mixed together according to Table 1. The mixture was kept at 95ºC in water bath for 4 minutes and then gradually cooled down to room temperature.Phosphorylation of annealed oligos
The vector termini have phosphorus (P) groups,
however the insert termini have hydroxyl groups (OH). Replacing insert OH for P might enhance the efficiency of ligation between them. The phosphorylation consists on the mixture described at Table
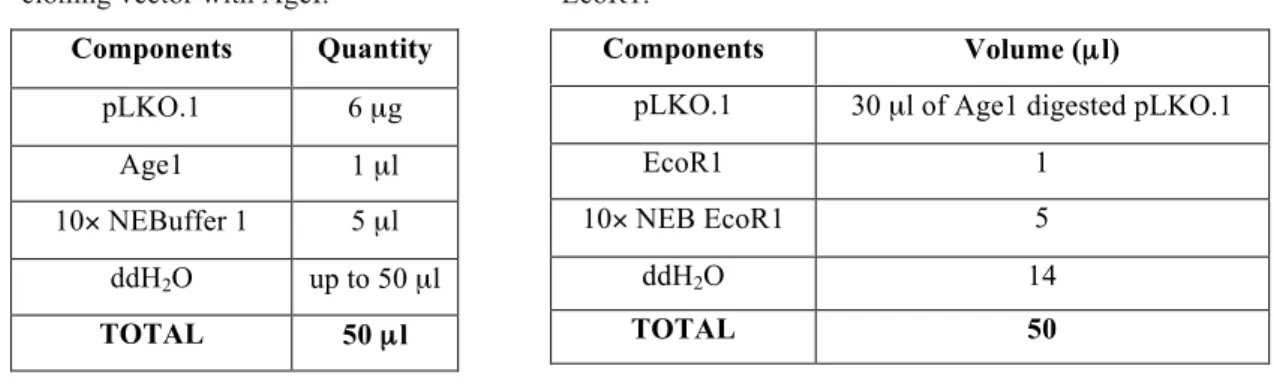
2, followed by incubation at 37ºC for 30 minutes and heating at 70ºC for 10 minutes. pLKO.1 TRC-cloning vector digestion
In order to insert the shRNA into the vector, pLKO.1 must be digested first with Age1 and EcoR1 enzymes, according to
Table 3 and Table 4, respectively. After the first digestion with
Age1 enzyme, the mixture was incubated at 37ºC for 2 hours and purified with Wizard SV Gel and PCR Clean-Up System (Promega) according to manufacturer’s instructions. Subsequently, pLKO.1 was subjected to a second digestion with EcoR1, and once more incubated at 37ºC for 2 hours. After that, the digestion product was ran in agarose12 gel and the presence of two bands was
confirmed, one of 7kb and one of 1.9kb. 7kb band was then purified and eluted in 30
µ
l ddH2O.12 Molecular Biology Agarose (BIORAD).
Components Volume (µl) Forward Oligo 5 Reverse Oligo 5 10× NEB buffer 2 5 ddH2O 35 TOTAL 50 Components Volume (µl) ATP 1 Buffer T411 1 T4 PNK 0.5 Insert 0.5 ddH2O 7 TOTAL 10 Table 2. Insert phosphorylation Mix.
Ligation
In this step, pLKO.1 vector (already digested) and the shRNA insert were ligated together. In order to do that, 1 µl of vector pLKO.1, 1.3 µl of T4 buffer and 1 µl of T4 Ligase were added to the phosphorylation product and incubated at 16ºC overnight.
Transformation
The ligation product was transformed into TOP 10 competent cells. The whole volume of ligation product was added to the bacteria and kept in ice for 20 minutes. Subsequently, the tube was placed in water bath at 42ºC for 90 seconds for heat shock and then put back on ice for 2 minutes. 500 µl of 1 × LB medium4 was added to the tube and shaken at 37ºC for 1 hour. After that, the bacteria were plated in 1 × LB Agar + Ampicillin (Amp)5 surface and incubated at 37ºC overnight.
On the next day, 3 single colonies were picked up and shaken overnight at 37ºC in 5 ml of 1 × LB medium+Amp (100mg/ml). Subsequently, plasmids were extracted using E.Z.N.A Plasmid Mini Kit I (Omega Biotek), according to supplier’s instructions. Briefly, bacteria were centrifuged at 6000 × g for 3 minutes and the pellet was resuspended in Solution 1/RNaseA for RNA digestion. Solution II was added in order to lyse the cells and a solution III was subsequently used to cause precipitation of all cell components except non-genomic DNA. The suspension was then washed using HiBind DNA mini Column and finally eluted in 30 µl of elution buffer. Plasmid was sent for SANGER sequencing for inserts screening.
4 1 × LB medium (1L): 10 g of trypton, 5 g of yeast extract and 10 g of NaCl, filling up 950 ml with ddH
2O water and pH
adjusted to 7.0. Volume ajdusted to 1 liter with H2O. 5
1 × LB Agar + Ampicillin: 35.6 g of premix LB Agar powder (Sigma-Aldrich) per Liter of dH2O, plus Ampicillin in a
total concentration of 100 mg/ml.
Components Quantity pLKO.1 6 µg Age1 1 µl 10× NEBuffer 1 5 µl ddH2O up to 50 µl TOTAL 50 µl Components Volume (µl)
pLKO.1 30 µl of Age1 digested pLKO.1
EcoR1 1
10× NEB EcoR1 5
ddH2O 14
TOTAL 50
Table 3. Digestion of pLKO.1 TRC-cloning vector with AgeI.
Table 4. Digestion of pLKO.1 TRC-cloning vector with EcoR1.
Midi prep
After screening for the inserts presence, midi prep was performed to obtain larger shRNA yields using Plasmid Midi Kit (QIAGEN), according to supplier’s instructions. First, 1 µl of the mini prep was used for transformation and shaken in 300 ml of 1 × LB+Amp at 37ºC overnight. On the next day, the bacteria were centrifuged at 6000 × g for 10 minutes and the pellet was resuspended in 4 ml of buffer P1 (containing RNase) to digest the RNA. Subsequently, 4 ml of buffer P2 was gently mixed with the bacteria to cause the lysis of the cells, taking a 5 minutes period of incubation at RT. Next the precipitation was caused by adding 4 ml of buffer P3 and incubation for 15 minutes on ice. The precipitated material contained genomic DNA, proteins, cell debris and Sodium dodecyl sulfate (SDS), present in buffer P2. A clear supernatant was obtained through centrifugation at 15,000 × g for 30 minutes at 4ºC, followed by another centrifugation of 15 minutes in the same conditions, in order to avoid clogging of QIAGEN-tip or elimination of gravity flow by suspended material. The supernatant flowed gravitationally through a column, followed by wash buffers in order to remove all contaminants present in the majority of plasmid DNA preparations. DNA was finally eluted in 5 ml of elution buffer and precipitated by adding 3.5 ml of isopropanol and centrifuging at 15,000 × g for 40 minutes at 4ºC. After this step, supernatant was decanted and 1.5 ml of 70% ethanol was added to the tube, followed by centrifuge at 16,000 × g for 10 minutes. The supernatant was decanted once more and the pellet was left to dry at RT for a few minutes. Finally, DNA was resuspended in 150 µl of nuclease free water and kept at RT for about 2 hours. Quality of the DNA and respective concentration were analyzed using Nanodrop (Thermo Scientific). After this, storage should be at -20ºC.
It is relevant to mention that we confirmed the ability of each shRNA to target all the PDE4B (1,2,3) and PDE4A (1,2) isoforms.
3.3. Lentiviral based expression
The open reading frame of the isoform of human PDE4B2 transcript was cloned by PCR. The vector was kindly provided by Ricardo Aguiar (University of Texas Health Science Center at San Antonio). Upon arrival, the piece of paper containing the vector was soaked in 100-200 µl of nuclease free water, mixed by vortex and kept at RT for about 2 to 3 hours. After this time, the vector was already dissolved in the water, so a transformation was performed in order to amplify the plasmid number. On the next day, the colonies were picked up, shacken in 1× LB+Amp and the plasmid was purified as a mini prep, exactly as described above. PDE4B2 cloning was done by Polymerase Chain Reaction (PCR). Accordingly, the lenti-SHC-PDE4B2 expression vector was
generated based on the backbone SHC0036 (Sigma-Aldrich, Figure 2) using Nhe I and Fse I cloning sites. SHC003 also contains a puromycin resistance marker (allowing convenient stable selection) and a U6 promoter
.
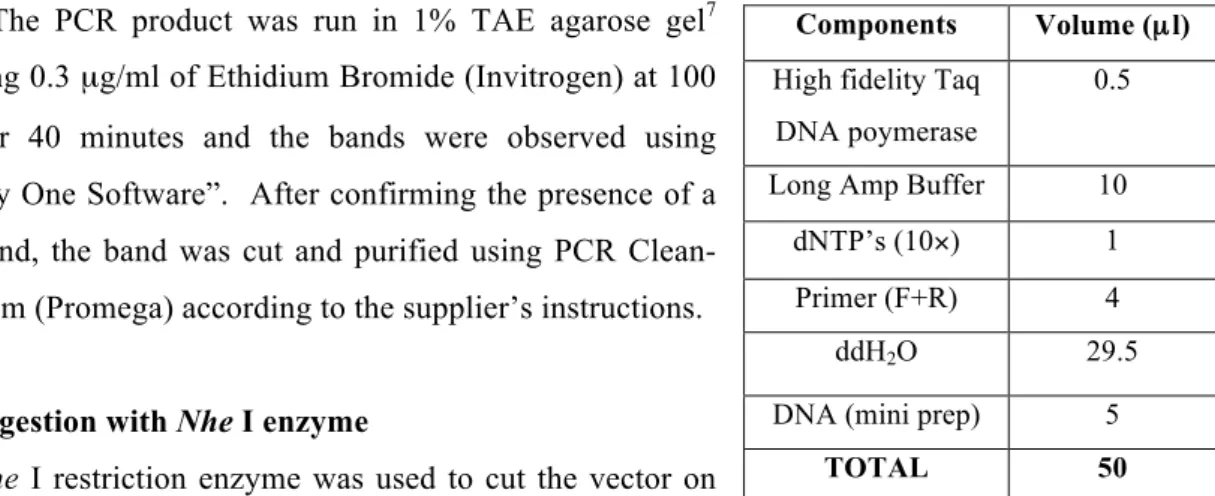
Polymerase Chain Reaction (PCR)
PCR was used to clone PDE4B2 gene. The primers are listed at Supplemental Table S2.
The components of the PCR mixture are shown at Table 5. A total volume of 50 µl reaction was used. PCR reaction was incubated for 2 minutes at 95ºC, followed by 25 amplification cycles composed by 30 seconds denaturing at 95ºC, 40 seconds annealing at 58ºC and
3 minutes extension at 72ºC.
The PCR product was run in 1% TAE agarose gel7 containing 0.3 µg/ml of Ethidium Bromide (Invitrogen) at 100 Volts for 40 minutes and the bands were observed using “Quantity One Software”. After confirming the presence of a 1.9kb band, the band was cut and purified using PCR Clean-Up System (Promega) according to the supplier’s instructions.
Digestion with Nhe I enzyme
Nhe I restriction enzyme was used to cut the vector on
one of its restriction sites. To 40 µl of PCR template was added 1 µl of Nhe I enzyme (Thermo Scientific), 5 µl of 10 × Tango Buffer (Thermo Scientific) and 5 µl of 1 × Bovine Serum Albumin (BSA)8. The mixture was incubated at 37ºC for 4 hours, followed by purification.
Digestion with Fse I
The second cut was made at Fse I restriction site. To 35 µl of the first digestion product, it was added 1 µl of Fse I enzyme (Thermo Scientific), 5 µl of NEBuffer 4, 5 µl of BSA and 4 µl of
6 Sigma-Aldrich SHC003 (TurboGFP) vector. Source:
http://www.sigmaaldrich.com/catalog/product/sigma/shc003?lang=en®ion=SG (last consulted on 1st September, 2013).
7
50 × TAE Buffer (1stBase) was diluted 1:50 in dH2O. Agarose gel (BIORAD) was diluted 1:100 (w/v) in 1 × TAE Buffer. 8 10 × Bovine Serum Albumin (Thermo Scientific) was diluted 1:10 in nuclease free water.
Components Volume (µl)
High fidelity Taq DNA poymerase
0.5
Long Amp Buffer 10
dNTP’s (10×) 1
Primer (F+R) 4
ddH2O 29.5
DNA (mini prep) 5
TOTAL 50
Table 5. PCR components for PDE4B2 cloning.
Figure 2. Map of SHC003 (TurboGFP) vector6.