Setembro, 2019
Andreia Filipa Morgado Furtado
Mestre em Controlo da Qualidade e Toxicologia dos Alimentos
Rastreabilidade Metrológica das Medições
de Massa Volúmica e das Determinações
Reológicas de Líquidos
Dissertação para obtenção do Grau de Doutor em
Ciência e Engenharia de Materiais,
Especialidade em Ciência de Materiais
Orientador:
Doutora Maria Teresa Varanda Cidade,
Professora Auxiliar com Agregação,
Faculdade de Ciências e Tecnologia da
Universidade Nova de Lisboa
Júri:
Presidente: Prof. Doutor João Jorge Ribeiro Soares Gonçalves de
Araújo
Arguentes: Prof. Doutora Catarina Almeida da Rosa Leal
Doutor Markus Schiebl
Vogais: Prof. Doutora Maria Teresa Varanda Cidade
i
Rastreabilidade Metrológica das Medições de Massa Volúmica e das Determinações Reológicas de Líquidos
Copyright © Andreia Filipa Morgado Furtado, Faculdade de Ciências e Tecnologia, Universidade Nova de Lisboa.
A Faculdade de Ciências e Tecnologia e a Universidade Nova de Lisboa têm o direito, perpétuo e sem limites geográficos, de arquivar e publicar esta dissertação através de exemplares impressos reproduzidos em papel ou de forma digital, ou por qualquer outro meio conhecido ou que venha a ser inventado, e de a divulgar através de repositórios científicos e de admitir a sua cópia e distribuição com objetivos educacionais ou de investigação, não comerciais, desde que seja dado crédito ao autor e editor.
iii
A vós, às minhas doces Marias e aos meus desafiantes Estarolas.
v
A
GRADECIMENTOS
“Panta Rhei”, Heraclitus. Tudo flui. Por terem tornado possível e incentivarem a elaboração desta tese, de todas as experiências e projetos nos quais me envolvi ao longo destes anos, o meu mais sincero agradecimento ao Instituto Português da Qualidade, e à Direção de Departamento de Metrologia, a Doutora Isabel Godinho e à Direção do Laboratório Nacional de Metrologia, ao Doutor João Alves e Sousa, muito obrigada. À Faculdade de Ciências e Tecnologia da Universidade Nova de Lisboa, também a minha casa há quase 20 anos, e em especial à minha Orientadora, à Professora Maria Teresa Varanda Cidade, pelo seu envolvimento, pela sua ajuda e preciosa orientação, por me fazer chegar até aqui. Também agradeço a especial importância dos membros da CAT no suporte e finalização desta tese, obrigada.
My acknowledgment to the EMRP and EMPIR projects in which I was involved and that allowed the development of parts of this thesis work. These projects were carried out with funding of European Union and are jointly funded by the participating countries within EURAMET and the European Union.
“Se um dia não souberes algo, escreve um livro sobre esse assunto”, e foi o que fiz. Disse-me, há alguns anos atrás, o meu colega de trabalho, e de buscas incessantes a respostas às mais variadas questões, Olivier Pellegrino. E a ele agradeço o constante incentivo por essa busca. Mas não poderia ficar por aqui. Aliás, os protagonistas são vários, e a todos eles agradeço, dedico, e em certo modo “devo”, os resultados deste trabalho: à Adelaide Rodrigues, pelo contante apoio “maternal”, por me manter “viva” e por sempre acreditar em mim, todos os dias, nestes últimos 13 anos; à Ana Rita Madeira, pelo companheirismo neste crescimento; ao Jorge Pereira, ao meu companheiro de batalha nestes assuntos dos líquidos, obrigada por acreditares (em mim) e por toda a confiança, acho que fazemos uma ótima equipa; ao Luís Ribeiro, pela sua pluripotência e paciência na resolução de problemas e pela partilha de conhecimento; ao Vítor Cabral, o meu vizinho da frente, pela sua curiosa e simpática inquietude, a todos vós do “clube do café com docinhos e curiosidades”, e a tantos outros colegas do IPQ, a quem devo, minutos, horas, dias, anos de sorrisos, gargalhadas e de consolo, a quem não nunca poderei agradecer de igual modo.
“Apfelschörle, Quark und Physik”. Ihnen, mein lieber Freund Henning Wolf, dafür, dass Sie an meine Arbeit, an mich und an meine Zukunft glauben, dass Sie so geduldig sind, dass ich in dieser Metrologie-Welt „wachsen“kann.
“Porque eu sou do tamanho do que vejo, e não do tamanho da minha altura”, Fernando Pessoa. À minha família de estarolas, por me quererem fazer “ser mais, ser melhor”: ao Pedro Matos, o nosso comandante e pacificador, por todos os conselhos, e por partilhares as dores comigo; ao João Fadista, por seres o meu doce estarola; ao André Santos, por todas as guerrilhas; ao meu querido André Rosa, ao meu austero assentimental, por seres um dos mosqueteiros, por me fazeres acender a luz no fundo do túnel, por fazeres as flores brotar e os flocos de neve tomarem formas inimagináveis, a ti devo conseguir olhar além; à Vitória Cunha, por toda a energia, por todo o apoio em momentos angustiantes, por me ouvires, por não me teres deixado baixar os braços; a todos vós estarolas que trago e sempre levarei no meu coração: André Galvão, Irene Izquierdo, Verónica Azevedo; Elizabete Almiro, Mónica Estevão, Hélder Cruz, a todas as nossas mini-estarolinhas, a todos a vós devo.
Às flores do meu caminho. Às “Marias” do meu coração: à minha avó, à minha querida e doce mãe-avó
que me carrega e carregou; à minha mãe amiga, por crescermos juntas e juntas estaremos sempre; à minha irmã Joana por seres a minha pequenina e tão grande; à minha tia Zézinha, por nos completares; ao meu pai (“grande maluco”); aos meus irmãos “gémeos” (Rúben e Daniela); a todos os meus tios-pai (Zézinho e Chico), tia Lena, Tia Teresa, Tété (por ter feito crescer em mim este “bichinho das ciências”), primos e primas irmãos (Sara, Marcos, Carina, Daniela, Isa, Pedro e Nádia); aos meus avós paternos, à minha Família, por me sempre fazerem acreditar que posso ser aquilo que anseio, por me deixarem descansar nos vossos colos, por me secarem as lágrimas e por me fazerem sorrir e querer sorrir, dia após dia, mesmo que as “pedras do nosso caminho” se transformem em montanhas. A vós dedico todo este trabalho, porque ele a vós devo. Obrigada.
vii
Abstract
Density is one of the main drivers of economic transactions in a wide range of products, from fuels to food products. Actual consumption of liquids of high commercial value, such as wine, olive oil and fuels, can and should be regarded as of high importance within the European economy. The physical properties of these liquids, such as density, surface tension, viscosity and elasticity, among others, cover a wide range of variation. Furthermore, such liquids are often handled over a wide range of temperatures and pressures during the processing, control and transport steps. Since currently available density measurement methods are influenced by one or more of these properties inherent in liquids, as well as temperature and pressure, their robustness should be carefully evaluated. Still being urgent the establishment of an adequate density metrological traceability chain, not only in Portugal, but also in the European space, and throughout the world. Thus, the main objective of this thesis work was to study the influence of such properties of liquids on the result of measurements made by oscillation-type density meters, from ambient pressure to pressures up to 600 bar. The influence of viscosity in Newtonian liquids, and viscoelasticity in non-Newtonian liquids, on the accuracy and precision of the density measurement results was investigated using hydrostatic weighing and pycnometry as comparative methods. The mechanical characterization of viscoelastic samples was performed using rotational rheometry. The knowledge acquired during this work will be disseminated in international guides and standards of scientific and applied metrology (EURAMET guides and ISO standards) and legal metrology (OIML and WELMEC documents), in order to fill the lack of documentation in this area of knowledge.
Another aspect of high importance and impact in the scientific field is the development of methods for determining the salinity of seawater. This parameter allows describing the ocean currents that will be used as a basis for climate modelling. In this sense, the investigations carried out were able to prove the compatibility of salinity determinations by measuring density and refractive index.
ix
Resumo
A massa volúmica é um dos principais elementos impulsionadores de transações económicas dos mais variados produtos, desde combustíveis até produtos alimentícios. O consumo real de líquidos de elevado valor comercial, tal como o vinho, o azeite e os combustíveis, pode e deve ser encarado de elevada importância no seio da economia europeia. As propriedades físicas destes líquidos, tais como: a massa volúmica, tensão superficial, viscosidade e elasticidade, entre outras, cobrem um amplo espectro de variação. Além disso, esses líquidos são frequentemente manipulados num amplo intervalo de temperaturas e pressões, durante as etapas de processamento, controlo e transporte. Dado que os métodos de medição de massa volúmica atualmente disponíveis são influenciados por uma ou mais destas propriedades inerentes aos líquidos, bem como pela temperatura e pela pressão, a sua robustez deve ser cuidadosamente avaliada. Sendo ainda premente, o estabelecimento de uma cadeia de rastreabilidade metrológica de massa volúmica adequada, não só em Portugal, como no espaço europeu, e em todo o mundo. Assim, o objetivo principal deste trabalho prendeu-se com o estudo da influência de tais propriedades dos líquidos no resultado das medições efetuadas por densímetros de tubo vibrante, a pressão ambiente e altas pressões (até 600 bar). A influência da viscosidade, em líquidos Newtonianos, e da viscoelasticidade, em fluidos não-Newtonianos, na exatidão e na precisão dos resultados de medição da massa volúmica foi investigada usando como métodos comparativos a pesagem hidrostática e a picnometria, respetivamente. A caracterização mecânica das amostras viscoelásticas foi realizada por recurso a reometria rotacional. Os conhecimentos adquiridos durante este trabalho serão disseminados em guias e normas internacionais de metrologia científica e aplicada (guias EURAMET e normas ISO) e de metrologia legal (documentos OIML e WELMEC), com intuito de colmatar a falta de documentação existente nesta área de conhecimento.
Outro aspeto de elevada importância e impacto, no meio científico, prende-se no desenvolvimento dos métodos de determinação da salinidade da água do mar. Parâmetro que permite descrever as correntes oceânicas que serão utilizadas como base para a modelação climática. Neste sentido, as investigações realizadas conseguiram comprovar a compatibilidade das determinações de salinidade por meio da medição da massa volúmica e do índice de refração.
Termos chave: Metrologia de Líquidos; Rastreabilidade Metrológica; Massa volúmica; Viscosidade; Viscoelasticidade; Reologia
xi
Content Index
I.Thesis Research Framework ... 1
II.INTRODUCTION ... 3
II.AMETROLOGICAL TRACEABILITY OF DENSITY MEASUREMENTS OF LIQUIDS ... 5
II.A.1. Realisation of density unit ... 5
II.A.2. Dissemination of density unit ... 7
II.A.2.1 Primary measurement standard of the density unit ... 8
II.A.2.2 Secondary measurement standard of the density unit ... 9
II.A.2.3 Working measurement standards and instruments... 9
II.BMETROLOGICAL TRACEABILITY OF VISCOSITY AND RHEOMETRIC MEASUREMENTS ... 11
II.B.1 Realisation and dissemination of viscosity unit ... 11
II.B.2 Traceability of rheological determinations ... 13
II.B.2.1 Calibration of Rheometers ... 14
II.B.2.1.1 Direct method... 14
II.B.2.1.2 Indirect method ... 14
II.CMEASUREMENT UNCERTAINTY ... 15
II.C.1 Uncertainty budget of rheometers’ calibration ... 18
II.C.1.1 Direct method calibration ... 18
II.C.1.2 Indirect method calibration ... 19
II.DLIQUIDS’DENSITY METROLOGY AT IPQ ... 21
II.D.1 Primary Method: Hydrostatic Weighing ... 22
II.D.1.1 Participation in International Comparisons ... 23
II.D.1.1.1 EURAMET Project 858 ... 23
II.D.1.1.2 EURAMET.M.D-K2 (Project 1019) ... 24
II.D.1.2 Apparatus’ improvements after comparisons ... 25
II.D.2 Secondary Method: Oscillation-type density meters ... 27
II.D.2.1 Participation in International Comparisons ... 28
II.D.2.1.1 Tri-Lateral DMA Comparison ... 29
II.D.2.1.2 EURAMET Project 1214 ... 29
II.D.2.1.3 EURAMET Project 1240 ... 30
II.D.2.1.4 Next scheduled comparisons: Key comparison CCM.D-K5 ... 31
II.D.3 Roadmaps for next developments in Liquids’ Density Metrology ... 32
II.D.3.1 Establishing traceability for liquid density measurements in Europe: 17RPT02-rhoLiq a new EMPIR joint research project ... 32
xii
III.METROLOGICAL ASSESSMENT OF OSCILLATION-TYPE DENSITY METERS ... 35
III.1 Oscillation-type density meters ... 36
III.1.1 Measuring Principle ... 36
III.1.2 Functional Units ... 37
III.1.3 Excitation and Evaluation of the Oscillation ... 38
III.1.4 Mathematical Model ... 39
III.1.5 Calibration and Adjustment ... 40
III.1.6 Uncertainty Budget ... 41
III.AVISCOSITY-INDUCED ERRORS ... 43
III.A.1 Viscosity tests with DMA 5000 – Part I ... 44
III.A.1.1 Materials and Methods ... 44
III.A.1.1.1 Density meter calibration for viscosity damping ... 44
III.A.1.2 Results and Discussion ... 44
III.A.1.2.1 Density meter calibration for viscosity damping ... 44
III.A.1.3 Conclusions ... 47
III.A.2 Viscosity tests with DMA 5000M – Part II ... 48
III.A.2.1 Materials and Methods ... 48
III.A.2.1.1 Viscosity estimation from damping indication parameter ... 48
III.A.2.1.2 Viscosity estimation from density indication ... 48
III.A.2.1.3 Samples characterization ... 48
III.A.2.1.4 Viscosity-induced errors ... 48
III.A.2.2 Results and Discussion ... 49
III.A.2.2.1 Results for single devices ... 49
III.A.2.2.1.1 Viscosity estimation from damping parameter ... 49
III.A.2.2.1.2 Viscosity estimation from density indications ... 50
III.A.2.2.1.3 Regressions residual analysis ... 51
III.A.2.2.2 Combined results for two devices ... 53
III.A.2.3 Conclusions ... 55
III.A.3 Viscosity tests with DMA 5000M and DMA HP ... 57
III.A.3.1 Materials and Methods ... 57
III.A.3.1.1 Samples characterization ... 57
III.A.3.1.2 Viscosity induced errors ... 57
III.A.3.2 Results and Discussion ... 57
III.A.3.2.1 Samples characterization ... 57
III.A.3.2.2 Viscosity-induced errors ... 58
III.A.3.3 Conclusions ... 61
III.BVISCOELASTICITY-INDUCED ERRORS ... 63
III.B.1 Introduction ... 64
III.B.1.1 Viscoelasticity ... 64
III.B.1.1 Oscillatory tests ... 64
III.B.1.1.1 Balance of materials’ viscoelastic behaviour ... 65
III.B.1.1.2 Time-dependent structural decomposition and regeneration ... 65
III.B.1.2 Viscoelasticity tests in oscillation-type density meters ... 65
III.B.2 Viscoelasticity tests with DMA 5000 – Part I ... 66
III.B.2.1 Materials and Methods ... 66
III.B.2.1.1 Test fluids ... 66
III.B.2.1.2 Viscoelastic samples characterization ... 66
III.B.2.1.2.1 Density measurements ... 66
III.B.2.1.2.2 Rheological determinations ... 67
III.B.2.3 Results and Discussions ... 67
xiii
III.B.2.3.2 Rheological determinations ... 68
III.B.2.4 Conclusions ... 69
III.B.3 Viscoelasticity tests with DMA 5000 – Part II ... 70
III.B.3.1 Materials and Methods ... 70
III.B.3.1.1 Test fluids ... 70
III.B.3.1.1.1 PVA and Borax solution ... 70
III.B.3.1.1.2 Carbopol solution ... 70
III.B.3.1.1.3 Hydroxyethyl-cellulose solution ... 71
III.B.3.1.1.4 Starch solution ... 71
III.B.3.1.1.5 P(Aam-co-DADMAC) Carbopol solution ... 71
III.B.3.1.2 Viscoelastic samples characterization ... 71
III.B.3.1.2.1 Density measurements ... 71
III.B.3.1.2.2 Uncertainty budget ... 72
III.B.3.1.2.3 Rheological determinations ... 72
III.B.3.3 Results and Discussions ... 73
III.B.3.3.1 Comparison of the density results ... 73
III.B.3.3.2 Relation with samples’ mechanical properties ... 75
III.B.3.3.3 Relation with samples’ time-dependent relaxation/recovery behaviour ... 80
III.B.3.4 Conclusions ... 81
III.B.4 Viscoelasticity tests in DMA 5000 M and DMA HP ... 83
III.B.4.1 Materials and Methods ... 83
III.B.4.1.1 Test fluids ... 83
III.B.4.1.1 Viscoelastic samples characterization ... 83
III.B.4.1.1.1 Viscosity and density ... 83
III.B.4.1.1.2 Rheological characterization ... 83
III.B.4.2 Results and Discussion ... 85
III.B.4.2.1 Viscoelastic samples characterization ... 85
III.B.4.2.1.1 Viscosity and density ... 85
III.B.4.2.1.2 Rheological characterization ... 85
III.B.4.2.2 Viscoelasticity induced errors ... 91
III.B.4.3 Conclusions ... 95
III.CPRESSURE-INDUCED ERRORS ... 97
III.C.1 Development of a high-pressure density apparatus up to 650 bar ... 98
III.C.1.1 General Materials and Methods ... 98
III.C.1.1.1 Apparatus ... 98
III.C.1.1.2 Samples tested ... 99
III.C.1.1.3 Samples preparation and loading ... 99
III.C.1.1.4 Apparatus cleansing ... 100
III.C.2.2 Calibration of the high-pressure density apparatus... 101
III.C.2.2.1 Methods ... 101
III.C.2.2.2 Results ... 101
III.C.2.2.3Conclusions ... 102
III.C.2.3 Validation of density measurements obtained by the high-pressure density apparatus103 III.C.2.3.1 Methods ... 103
III.C.2.3.2 Results ... 103
III.C.2.3.3 Conclusions ... 104
III.C.2.4 Density measurements with the high-pressure density apparatus up to 650 bar ... 105
III.C.2.4.1 Methods ... 105
III.C.2.4.2 Results ... 105
III.C.2.4.2.1 Measurements results of Newtonian liquids ... 105
xiv
III.C.2.4.2.1.b. Dodecane... 106
III.C.2.4.2.1.c. Oil 50B ... 107
III.C.2.4.2.1.d. Oil 100B ... 108
III.C.2.4.2.2 Measurements results of non-Newtonian liquids ... 109
III.C.2.4.2.2.a. NNTF1 ... 109
III.C.2.4.2.2.b. NNTF1 diluted ... 110
III.C.2.4.2.2.c. NNTF2 ... 111
III.C.2.4.2.2.d. NNTF2 diluted ... 112
III.C.2.4.3 Conclusions ... 114
III.C.2.5 Determination of high-pressure density apparatus internal volume ... 115
III.C.2.5.1 Methods ... 115
III.C.2.5.2 Results ... 115
III.C.3.5.3 Conclusions ... 117
IV.METROLOGICAL COMPATIBILITY OF OSCILLATION-TYPE DENSIMETRY AND REFRACTOMETRY MEASUREMENT RESULTS... 119
IV.1 Determination of sugar and salt mass fractions in aqueous solutions ... 120
IV.2 Calibration of oscillation-type density meters for viscosity-induced damping with ICUMSA sucrose solutions ... 123
IV.2.1 Introduction ... 123
IV.2.2 Materials and Methods ... 124
VI.2.2.1 Density meter calibration for viscosity-induced damping ... 124
IV.2.2.2 Determination of refractive index and density of sucrose solutions ... 124
IV.2.2.3 Determination of the density of sucrose solutions through ICUMSA tables ... 124
IV.2.3 Results ... 125
IV.2.3.1 Validation of damping curve with sucrose solutions ... 126
IV.2.4 Conclusions ... 126
IV.3 Determination of absolute salinity by densimetry and refratometry ... 127
IV.3.1 Introduction ... 127
IV.3.2 Materials and Methods ... 128
IV.3.2.1 Preparation of test solutions ... 128
IV.3.2.2 Refractive index measurements ... 129
IV.3.2.3 Density measurements ... 129
IV.3.2.4 From refractive index and density to absolute salinity ... 129
IV.3.2.5 Uncertainty budget of determination of the absolute salinity values from density and refractive index ... 130
IV.3.2.6 Study of the metrological compatibility of the absolute salinity values obtained by refractometry and by densimetry ... 132
IV.3.2.7 Study of the effect of the seawater matrix on the determination of the absolute salinity by refractometry and by densimetry ... 132
IV.3.2.8 Assessment of the metrological compatibility of the absolute salinity results... 133
IV.3.3 Results and Discussion ... 133
IV.3.3.1 Study of the metrological compatibility of the absolute salinity values obtained by refractometry and by densimetry ... 133
IV.3.3.2 Study of the effect of the seawater matrix on the determination of salinity by refractometry and by densimetry ... 136
IV.3.4 Conclusions ... 138
V.General Conclusions & Future Work ... 139
xv
Index of Figures
Figure II.1 Hierarchy scheme of dissemination of the density unit for liquids. ... 7
Figure II.2 Schematic representation of the actuating forces on sphere in liquid. ... 8
Figure II.3 Hierarchy scheme of dissemination of viscosity measurements. ... 12
Figure II.4 First implemented IPQ’s hydrostatic weighing apparatus ... 22
Figure II.5 First IPQ’s measuring vessel filled with the liquid sample during the weighing of the sinker (A) and then during the weighing of the suspension (B); and lifting device (C). ... 22
Figure II.6 IPQ’s hydrostatic weighing vessels ... 25
Figure II.7 Actual hydrostatic weighing apparatus at IPQ for density measurements of liquids; A: suspension connected to the balance; B: no balance connection. ... 26
Figure II.8 IPQ’s setup assembled to measure fluids’ density for pressures up to 10 bar ... 28
Figure II.9 Resume of IPQ’s results in the EURAMET Project 1214 ... 29
Figure III.10 Schematic representation of the functional units of an oscillation-type density meter... 38
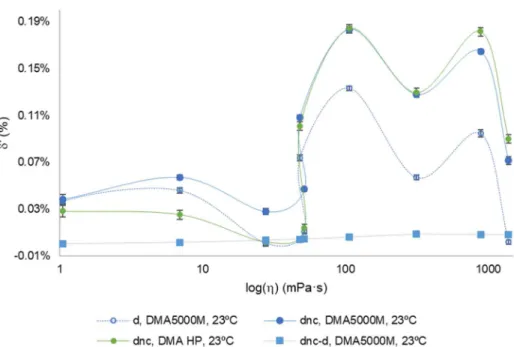
Figure III.11 Schematic representation of a commercial version of an oscillation-type density meter. 39 Figure III.12 Relative density deviations, in %, of the density indication with viscosity correction,δd of the density indication without viscosity correction,δdnc and difference between the indication without and with viscosity correction (dnc-d), against dynamic viscosity, in mPa·s, obtained in the tests with CRM oils performed at 20 ºC with a DMA 5000 (Anton Paar) density meter ... 45
Figure III.13 Relative density deviations, in %, of the density indication with viscosity correction,δ’d, of the density indication without viscosity correction,δ’dnc and difference between the indication without and with viscosity correction (dnc-d), against the log(η), in mPa·s, obtained in the tests with CRM oils performed at 20 ºC with a DMA 5000 (Anton Paar) density meter ... 46
Figure III.14 Linear relation was obtained between the relative density deviation without viscosity correction, δ'dnc, against the difference between the indication without and with viscosity correction dnc -d, obtained in the tests with CRM oils performed at 20 ºC, in the viscosity interval from 1-590 mPa·s, with a DMA 5000 (Anton Paar) density meter.. ... 47
Figure III.15 Regression curve of the dynamic viscosity η, in mPa⋅s, at 20 ºC and 23 °C, against Q measured by density meters (1) and (2) (DMA 5000M, Anton Paar). ... 50
Figure III.16 Regression curve of the dynamic viscosity η, in mPa⋅s, at 20 ºC and 23 °C, against D, in kg⋅m-³, measured by density meters (1) and (2) (DMA 5000M, Anton Paar). ... 50
xvi
Figure III.17 Residuals analysis of the regressions curves of dynamic viscosity η against Q, measured
by density meters (1) and (2) (DMA 5000M, Anton Paar), at 20 °C and 23 °C... 51 Figure III.18 Residuals analysis of the regressions curves of dynamic viscosity η against D, measured
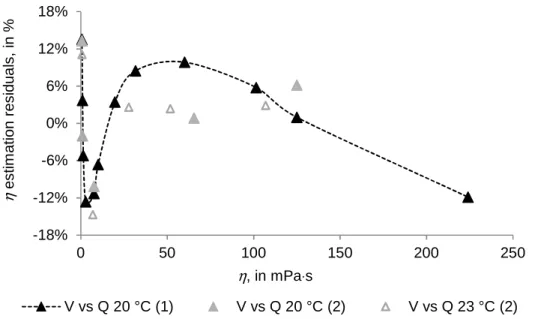
by density meters (1) and (2) (DMA 5000M, Anton Paar), at 20 °C and 23 °C... 52 Figure III.19 Curve of the regression of dynamic viscosity η against the Q obtained for the combined data set of density meters (1) and (2) (DMA 5000M, Anton Paar), at 20 °C and 23 °C, and residuals curve of dynamic viscosity η estimation, in %, from the exponential regression curve ... 54 Figure III.20 Curve of the regression of dynamic viscosity η, in mPa·s against the D, in kg·m-3, obtained
for the combined data set of density meters (1) and (2) (DMA 5000M, Anton Paar), at 20 °C and 23 °C,
and residuals curve of dynamic viscosity η estimation, in %, from third-degree polynomial curve. ... 54
Figure III.21 Relative density deviations, in %, of the density indication with viscosity correction,δd of
the density indication without viscosity correction,δdnc and difference between the indication without and
with viscosity correction (dnc-d), against dynamic viscosity, in mPa·s, obtained in the tests with CRM oils
performed at 23 ºC with a DMA 5000M and DMA HP (Anton Paar) density meters.. ... 59 Figure III.22 Relative density deviations, in %, of the density indication with viscosity correction,δ’ρ, of the density indication without viscosity correction,δ’ρnc and difference between the indication without and
with viscosity correction (ρnc-ρ), against the log(η), in mPa·s, obtained in the tests with CRM oils
performed at 23 ºC with a DMA 5000M and DMA HP (Anton Paar) density meters. ... 60 Figure III.23 Linear relation was obtained between the relative density deviation without viscosity correction, δ'dnc, against the difference between the indication without and with viscosity correction dnc
-d, obtained in the tests with CRM oils performed at 23 ºC, in the viscosity interval from 0,7-1400 mPa·s,
with a DMA 5000M (Anton Paar) density meter. ... 60 Figure III.24 Assembling used for filling the Gay-Lussac pycnometer with the non-Newtonian liquids tested by means of a peristaltic pump (ISM831C, ISMATEC) with a Tygon HC F-4040-A tube from ISMATEC. ... 66 Figure III.25 Graphic representation of the density deviation δρ (i.e., ρ'OD c - ρPN) and the complex
viscosity |η*| of the 7 viscoelastic samples, at 20 ºC, against the damping values tanδ of the samples
for frequency fρ... 77 Figure III.26 Curves of the data obtained in (Furtado et al., 2017) with Newtonian liquids by using
oscillation-type density meters (DMA 5000M, Anton Paar). Dynamic viscosity η, at 20 ºC and 23 °C, and
relative density deviation δρ (i.e., ρ'OD c - ρPN), both against Q factor. ... 78 Figure III.27 Graphic representation of oscillation damping values Q and the the relative density deviation δρ (i.e., ρ'OD c - ρPN) of the 7 viscoelastic samples, at 20 ºC, against samples’ complex viscosity |η*| determined for frequency fρin frequency sweep tests. ... 78
Figure III.28 Graphic representation of oscillation damping values Q (black filled circles) (Table III.27) and the the relative density deviation δρ (i.e., ρ'OD c - ρPN) of the 7 viscoelastic samples, at 20 ºC, against
samples’ viscous η' portion of the complex viscosity |η*| determined for frequency fρ in frequency sweep
tests. ... 79 Figure III.29 Graphic representation of oscillation damping values Q against the loss factor tanδ of the 7 viscoelastic samples determined for the frequency fρ in frequency sweep tests. ... 79 Figure III.30 Graphic representation of relation between density deviations, ∆ρOD c and ∆ρOD nc, both in
%, obtained by an oscillation-type density meter (DMA 5000, Anton Paar) when measuring the density of the 7 viscoelastic samples, and the hysteresis area obtained in time-dependent relaxation/recovery behaviour investigation tests performed at 20 ºC. ... 81 Figure III.31 Platinum resistance thermometer, connected to a data acquisition unit 34970A (Agilent), placed inside the hole of the cup of the coaxial-cylinder (CC27) measuring geometry, in the MCR 502 (Anton Paar) rheometer. ... 84
xvii
Figure III.32 Results of the amplitude sweep test of NNTF1, at 23 C, performed in a CC27, with a constant angular frequency, ω of 10 rad/s in CSD in the deformation rate, γ interval from 0,01 % to 100 %... 85 Figure III.33 Results of the amplitude sweep test in terms of shear stress (τ) of NNTF1, at 23 C,
performed in a CC27, for a constant angular frequency (ω) of 10 rad/s in CSD in the deformation rate
(γ) interval from 0,01 % to 100 %.. ... 86 Figure III.34 Results of the frequency sweep test of NNTF1, at 23 C, performed in a CC27, with a
constant deformation rate (γ) of 1 % in the angular frequency interval (ω) from 100 rad/s to 0,01 rad/s..
... 86 Figure III.35 Results of the amplitude sweep test of NNTF1 diluted 1:1 m:m, at 23 C, performed in a
CC27, with a constant angular frequency (ω) of 10 rad/s in CSD in the deformation rate (γ) interval from
0,01 % to 100 %. ... 87 Figure III.36 Results of the amplitude sweep test in terms of shear stress (τ) of NNTF1 diluted 1:1 m:m, at 23 C, performed in a CC27, with a constant angular frequency (ω) of 10 rad/s in CSD in the
deformation rate (γ) interval from 0,01 % to 100 %, with a MCR 502 (Anton Paar) rheometer.. ... 87
Figure III.37Results of the frequency sweep test of NNTF1 diluted 1:1 m:m, at 23 C, performed in a
CC27, with a constant deformation rate (γ) of 1 % in the angular frequency interval (ω) from 100 rad/s
to 0,01 rad/s.. ... 88 Figure III.38 Results of the amplitude sweep test of NNTF2, at 23 C, performed in a CC27, with a
constant angular frequency (ω) of 10 rad/s in CSD in the deformation rate (γ) interval from 0,01 % to
100 %.. ... 88 Figure III.39 Results of the amplitude sweep test in terms of shear stress (τ) of NNTF2, at 23 C,
performed in a CC27, with a constant angular frequency (ω) of 10 rad/s in CSD in the deformation rate
(γ) interval from 0,01 % to 100 %, with a MCR 502 (Anton Paar) rheometer... 89 Figure III.40 Results of the frequency sweep test of NNTF2, at 23 C, performed in a CC27, with a
constant deformation rate (γ) of 1 % in the angular frequency interval (ω) from 100 rad/s to 0,01 rad/s.
... 89 Figure III.41 Results of the amplitude sweep test of NNTF2 diluted 1:1 V:V, at 23 C, performed in a
CC27, with a constant angular frequency (ω) of 10 rad/s in CSD in the deformation rate (γ) interval from
0,01 % to 100 %. ... 90 Figure III.42 Results of the amplitude sweep test in terms of shear stress (τ) of NNTF2 diluted 1:1 V:V, at 23 C, performed in a CC27, with a constant angular frequency (ω) of 10 rad/s in CSD in the deformation rate (γ) interval from 0,01 % to 100 %. ... 90 Figure III.43 Results of the frequency sweep test of NNTF2 diluted 1:1 V:V, at 23 C, performed in a
CC27, with a constant deformation rate (γ) of 1 % in the angular frequency interval (ω) from 100 rad/s
to 0,01 rad/s. . ... 91 Figure III.44 Density relative indication errors results (in %) obtained, at 23 ºC, with a DMA 5000 M (Anton Paar) oscillation-type density meter, against the dynamic viscosity (in mPa·s) of the set of Newtonian and of non-Newtonian liquids samples tested. ... 92 Figure III.45 Relative density indication errors results (in %) obtained, at 23 ºC, with a DMA HP (Anton Paar) oscillation-type density meter, against the dynamic viscosity (in mPa·s) of the set of Newtonian and of non-Newtonianliquid samples tested... 93 Figure III.46 Relative difference between density indications, (dnc – d) in %, against dynamic viscosity of the Newtonian and non-Newtonian liquids samples tested, at 23 ºC, with a DMA 5000 M (Anton Paar) density meter. ... 94 Figure III.47Curve of dynamic viscosity against relative difference between density indications (dnc –
d), at 23 ºC, obtained with the Newtonian liquids tested in the DMA 5000 M density meter, in the viscosity
xviii
Figure III.48 Scheme of the assembling used to measure density, at 23 °C, in the pressure interval from atmospheric pressure up to 650 bar. ... 98 Figure III.49 Picture of the NNTF1 bottle inside the vacuum oven (OVA031.XX1.5 ,GALLENKAMP) showing the air bubbles formed in vacuum. ... 99 Figure III.50 Curves of reference density values from CIPM formulation, and density indication values given by the DMA HP (Anton Paar), at 23 ºC, versus pressure, in the interval from 1 bar to 650 bar, for ultra-pure degassed water. ... 102 Figure III.51 Calibration curve of relative density deviation, at 23 ºC, versus pressure, in the interval from 1 bar to 650 bar of DMA HP, Anton Paar. ... 102 Figure III.52 Curve of n-Nonane density values, at 23 ºC, versus pressure, in the interval from 1 bar to 300 bar... 103 Figure III.53 Curve of n-Nonane density values, at 23 ºC, versus pressure, in the interval from 1 bar to 650 bar... 104 Figure III.54 Curve of n-Nonane density and density relative error values, at 23 ºC, versus pressure, in the interval from 1 bar to 650 bar. ... 105 Figure III.55 Curve of n-Nonane density values, at 23 ºC, versus pressure, in the interval from 1 bar to 650 bar... 106 Figure III.56 Curve of dodecane density and density relative error values, at 23 ºC, versus pressure, in the interval from 1 bar to 650 bar. ... 106 Figure III.57 Curve of dodecane density values, at 23 ºC, versus pressure, in the interval from 1 bar to 650 bar... 107 Figure III.58 Curve of oil 50B density and density relative error values, at 23 ºC, versus pressure, in the interval from 1 bar to 650 bar ... 107 Figure III.59 Curve of oil 50B density, at 23 ºC, versus pressure, in the interval from 1 bar to 650 bar. ... 108 Figure III.60 Curve of oil 100B density and density relative error values, at 23 ºC, versus pressure, in the interval from 1 bar to 650 bar, measured with a DMA HP from Anton Paar. ... 108 Figure III.61 Curve of oil 100B density relative error, at 23 ºC, versus pressure, in the interval from 1 bar to 650 bar... 109 Figure III.62 Curve of NNTF1 density and density relative error values, at 23 ºC, versus pressure, in the interval from 1 bar to 650 bar. ... 109 Figure III.63 Curve of NNTF1 density relative error, at 23 ºC, versus pressure, in the interval from 1 bar to 650 bar... 110 Figure III.64 Curve of NNTF1 diluted density and density relative error values, at 23 ºC, versus pressure, in the interval from 1 bar to 650 bar. ... 110 Figure III.61 Curve of NNTF1 diluted density relative error, at 23 ºC, versus pressure, in the interval from 1 bar to 650 bar. ... 111 Figure III.66 Curve of NNTF2 density and density relative error values, at 23 ºC, versus pressure, in the interval from 1 bar to 650 bar ... 111 Figure III.67 Curve of NNTF2 density relative error, at 23 ºC, versus pressure, in the interval from 1 bar to 650 bar... 112 Figure III.68 Curve of NNTF2 diluted density values, at 23 ºC, versus pressure, in the interval from 1 bar to 650 bar... 112 Figure III.69 Curve of NNTF2 diluted density and density relative error values, at 23 ºC, versus pressure, in the interval from 1 bar to 650 bar ... 113 Figure IV.70 Schematics of the experimental methodology to obtain the mass fraction value of glucose and sodium chloride aqueous solutions from refractive index measurement results from a refractometer. ... 121 Figure IV.71 Schematics of the experimental methodology to obtain the mass fraction value of glucose and sodium chloride aqueous solutions from density measurement results from a density meter. .... 121
xix
Figure IV.72 Density deviation, δρnc, and difference between DMA 5 000 density indication without viscosity correction and with viscosity correctionρnc-ρ as a function of viscosity, at 20 ºC. ... 125 Figure IV.73 Relation between the deviation of DMA 5000 density indication without viscosity correction,
δρnc, and the difference between the indication without and with viscosity correction ρnc-ρ, at 20 ºC.125 Figure IV.74 Cause-and-effect diagram of the contributions to the standard uncertainty of the determination of the absolute salinity results, SA, from the different input quantities refractive index, n and density, ρ. ... 131 Figure IV.75 Relative expanded uncertainty, U’ SA(n) andU’ SA(ρ), of the absolute salinity values, SA
obtained from the measured values of refractive index, n and density,ρ, at 20 °C, for the solutions of
NaCl in ultrapure water, in OSIL SSW and in ERM SSW. ... 137 Figure IV.76 Relative expanded uncertainty, U’ SA(ρ), of the absolute salinity values, SAobtained from
the measured values of density, ρ, at 20 °C, for the solutions of NaCl in ultrapure water, in OSIL SSW
and in ERM SSW. ... 137 Figure IV.77 Relative difference between pairs of salinity values obtained by refractometry and by
densimetry ∆ ′ as a function of the nominal value of the absolute salinity, SA, for the solutions of NaCl
xxi
Index of Tables
Table II.1 Example of an uncertainty budget of the measurement of a Newtonian oil using a rheometer with a concentric cylinder system according to DIN 53019 with the following input quantities (and
t = 20 °C). ... 18 Table II.2 Metrological features of the measuring instruments used by LPL in the hydrostatic weighing apparatus from 2005-2011. ... 23 Table II.3 Resume of the IPQ and INRIM results obtained for the n-Nonane sample on EURAMET Project 858. ... 23 Table II.4 Resume of IPQ’s results obtained on EURAMET Project 1019. ... 24 Table II.5 Uncertainty budget of IPQ’s results for water at 20 ºC obtained on EURAMET project 1019 (Comparison of liquid density standards). ... 25 Table II.6 Metrological features of the measuring instruments presently used in IPQ in hydrostatic weighing apparatus. ... 26 Table II.7 Main metrological features of the IPQ' s oscillation-type density meter. ... 27 Table II.8 Main features of the actual IPQ’s setup to measure liquids’ density at high-pressure. ... 28 Table II.9 Resume of the IPQ’s results obtained in EURAMET Project 1240. ... 30 Table III.10 Generic uncertainty budget of density, ρ measurements performed with an oscillation-type density meter (with A and B spring constants), performed at temperature, t and pressure, p, of fluid sample with viscosity, η. ... 41 Table III.11 Calibration results of DMA 5000 (Anton Paar) calibration for viscosity-induced errors with Newtonian reference liquids. ... 44 Table III.12 Resume of the results of Q and D, in kg⋅m-3, obtained at 20 °C and 23 C by density meters
(1) and (2). ... 49 Table III.13 Resume of the coefficients (a and b) and relative standard deviations s of the regressions of η, in mPa⋅s, against Q, at 20 °C and 23 °C, obtained by density meters (1) and (2) (DMA 5000M,
Anton Paar), in the viscosity interval from 0,7 mPa⋅s to 220 mPa⋅s... 51 Table III.14 Resume of the coefficients (a, b, c, and d) and relative standard deviations s of the regressions of η, in mPa⋅s, against D, in kg·m-³, at 20 °C and 23 °C, obtained by density meters (1) and
(2) (DMA 5000M, Anton Paar), in two viscosity intervals (V1: 0,7 mPa s to 7 mPa s, V2: 7 mPa s to 220 mPa s). ... 51 Table III.15 Resume of the relative residuals, in %, of the regression equations of dynamic viscosity η against Q, and against D, obtained at 20 °C and 23 °C, by density meters (1) and (2) (DMA 5000M,
xxii
Table III.16 Resume of the coefficients (a and b) and relative standard deviations s of the regressions
of η, in mPa⋅s, against Q, at 20 °C and 23 °C, for the combined data set obtained by density meters (1)
and (2) (DMA 5000M, Anton Paar), in the viscosity interval from 0,7 mPa s to 220 mPa·s, ... 53 Table III.17 Resume of the coefficients (a, b, c and d) and relative standard deviations s of the regressions of η, in mPa⋅s, against D, in kg·m-³, at 20 °C and 23 °C, in two viscosity intervals (V1:
0,7 mPa s to 7 mPa·s, V2: 7 mPa s to 220 mPa·s), for the combined data set obtained by density meters (1) and (2). ... 53 Table III.18 Resume of the relative residuals, in %, of the combined regression of dynamic viscosity η against Q and against D obtained, at 20 °C and 23 °C, by density meters (1) and (2) (DMA 5000M,
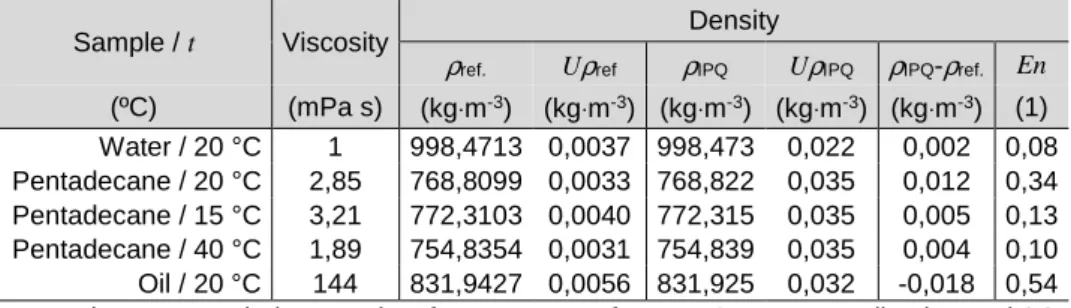
Anton Paar). ... 55 Table III.19 Dynamic viscosity η and density values ρ, at 23 ºC, of the Newtonian liquids tested. ... 57 Table III.20 Resume of density indication values, and , of the Newtonian liquids obtained at 23 ºC, with 2 different oscillation-type density meters (DMA 5000M and DMA HP, Anton Paar). ... 58 Table III.21 Resume of the density relative indication errors, δ’′ and δ’′ , obtained, at 23 ºC, for the Newtonian liquids tested with 2 different oscillation-type density meters (DMA 5000M and DMA HP, Anton Paar). ... 58 Table III.22 Summary of the density deviations, δd, of the results obtained by the oscillation-type density
meter (dnc, dc and d’c) and the results obtained by gravimetric method using a Gay-Lussac pycnometer
(ρpic) of the 5 viscoelastic samples, at 20 ºC. ... 67
Table III.23 Summary of viscosity values estimated by the results of the oscillation-type density meter (DMA 5000, Anton Paar), ηest. and the dynamic viscosity values, η’ext.,estimated by extrapolation of the
log (η’) curves as a function of log (f) determined by the rheometer (Mars III, ThermoScientific) with a
plate-plate (PP35TiL) measurement geometry, for the frequency values, fρ, measured by the
oscillation-type density meter for each sample. ... 69 Table III.24 Codification of the test fluids (F#). ... 70 Table III.25 Compilation of the density results of the 7 test fluids obtained at 20 ºC and ambient pressure
by using an oscillation-type density meter (DMA 5000, Anton Paar) (ρOD) and a pycnometer (ρPN). ... 74
Table III.26 Summary of the density deviations, δρ, of the results obtained by the oscillation-type density
meter (DMA 5000, Anton Paar) (ρOD) and the results obtained by gravimetric method using a pycnometer
(ρPN) of the 7 test fluids. ... 74
Table III.27 Oscillation frequencies, fρ and dynamic viscosity ηest. values estimated with the
oscillation-type density meter (DMA 5000, Anton Paar) and viscous, η'(fρ), elastic, η''(fρ) complex, |η*(fρ)| viscosities
and loss factor tanδ for fρ, determined by extrapolation of the data obtained in frequency sweep tests
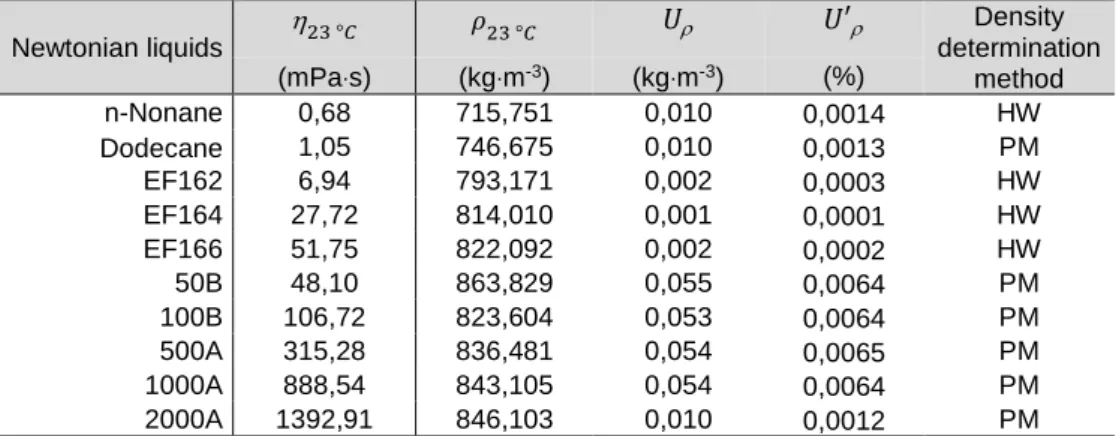
performed with the rheometer. ... 75 Table III.28 Summary of the viscoelastic prevalent behavior of the 7 tested samples in the linear viscoelastic range (in amplitude sweep tests at low frequency) and under high frequencies (in frequency sweep tests), performed at 20 ºC. ... 76 Table III.29 Summary of sensibility of density measurements results to the 7 test samples’ time-dependent relaxation/recovery behaviour in terms of variation of: density indication ∆ρOD; first and
second oscillationsperiods, τ1 and τ2 and damping indication parameter Q. ... 80
Table III.30 Summary of the rotational tests results performed to characterize the thixotropic behavior of the 7 test fluids, at 20 ºC. ... 80 Table III.31 Dynamic viscosity η and density values ρ, at 23 ºC, of the non-Newtonian liquids tested.85 Table III.32 Resume of the density indication values, and (in kg·m-3), of a DMA 5000 M and a
DMA HP (Anton Paar) oscillation-type density meters obtained with non-Newtonian liquid (NNL) samples tested at 23 ºC. ... 91 Table III.33 Resume of the density relative indication errors, δ′’ and δ’′ (in %), of a DMA 5000 M and a DMA HP (Anton Paar) oscillation-type density meters obtained with non-Newtonian liquid (NNL) samples tested at 23 ºC ... 92
xxiii
Table III.34 Composition and preparation procedure of the non-Newtonian liquids tested. ... 99 Table III.35 Uncertainty budget for the n-Nonane density measurements, at 23 °C, in the pressure interval from 1 bar to 300 bar, performed by the high-pressure density apparatus. ... 104 Table III.36 Parameters of the second-degree polynomial equation of density, ρ in kg⋅m-3, at 23 °C,
dependence on pressure, p in bar, in the interval from 1 to 650 bar, of the Newtonian liquids tested and expanded uncertainty, Uρ (with k =2) of the density measurements. ... 113 Table III.37 Parameters of the second-degree polynomial equation of density, ρ in kg⋅m-3, at 23 °C,
dependence on pressure, p in bar, in the interval from 1 to 650 bar, of the non-Newtonian liquids tested and expanded uncertainty, Uρ (with k =2) of the density measurements. ... 114 Table III.38 Uncertainty budget of the liquid’s density measurements, at 23 °C, in the pressure interval from 1 to 650 bar, performed by the high-pressure density apparatus. ... 114 Table III.39 Results of the determination of high-pressure density apparatus internal volume by gravimetric method using ultra-pure water. ... 116 Table III.40 Uncertainty budget of determination of high-pressure density apparatus internal volume by gravimetric method using ultra-pure water. ... 116 Table III.41 Results of the error determination of the displaced volume, V of syringe pump (100DM, Teledyne ISCO) used in the high-pressure density apparatus by gravimetric method using ultra-pure water. ... 116 Table III.42 Uncertainty budget of the error determination of the displaced volume (0,25 mL) of syringe pump (100DM, Teledyne ISCO) used in the high-pressure density apparatus by gravimetric method using ultra-pure water. ... 117 Table III.43 Uncertainty budget of the error determination of the displaced volume (10 mL) of syringe pump (100DM, Teledyne ISCO) used in the high-pressure density apparatus by gravimetric method using ultra-pure water. ... 117 Table IV.44 Results of the determination of mass fraction at 20 ºC of the glucose aqueous solutions by refractometry, Xm(n) and densimetry, Xm(ρ), and respective uncertainty values. ... 122 Table IV.45 Results from validation of damping curve tests with sucrose solutions. ... 126 Table IV.46 Summary of the density, ρ and refractive index, n values, at 20 ºC, corresponding to the absolute salinity, SA interval studied (*(Söhnel and Novotny, 1985); **(Wolf, 1966)). ... 129
Table IV.47 Uncertainty budget of the absolute salinity results, SA, obtained via density, SA(ρ) and
refractive index, SA(n) measurements, at 20 ºC. ... 132
Table IV.48 Absolute salinity, SA results of the solutions of sodium chloride in ultrapure water obtained
from the measured values of refractive index, SA(n), and density, SA(ρ), and respective expanded
uncertainties, (k =2). ... 133 Table IV.49 Absolute salinity, SA results of the solutions of sodium chloride solutions in OSIL SSW
obtained from the measured values of refractive index, SA(n), and density, SA(ρ), and respective expanded uncertainties, (k =2). ... 134 Table IV.50 Absolute salinity, SA results of the solutions of sodium chloride in ERM SSW obtained from
the measured values of refractive index, SA(n), and density, SA(ρ), and respective expanded
uncertainties, (k =2). ... 134 Table IV.51 Assessment of the metrological compatibility of the relative differences between pairs of
salinity values obtained by refractometry and by densimetry ∆ ′, and their correspondent relative
uncertainty ′∆ obtained for sodium chloride solutions in ultrapure water. ... 135 Table IV.52 Assessment of the metrological compatibility of the relative differences between pairs of
salinity values obtained by refractometry and by densimetry ∆ ′, and their correspondent relative
uncertainty ′∆ , obtained for sodium chloride solutions in OSIL SSW. ... 135 Table IV.53 Assessment of the metrological compatibility of the relative differences between pairs of
salinity values obtained by refractometry and by densimetry ∆ ′, and their correspondent relative
xxv
List of Abbreviations and Acronyms
API American Petroleum Institute
ASTM American Society for Testing and Materials (standards, USA)
BEV-PTP
Federal Office of Metrology and Surveying - Physico-technical testing service (the Austria’s NMI, in German: Bundesamt für Eich- und
Vermessungswesen -Physikalisch-technische Prüfdienst)
BIPM International Bureau of Weights and Measures (in French, Bureau
international des poids et mesures)
BRML Biroul Roman de Metrologie Legala (the Romania’s NMI)
BS British standards
CCM Consultative Committee for Mass and Related Quantities (in French,
Comité Consultatif pour la Masse et les Grandeurs Apparentées)
CGPM General Conference on Weights and Measures
CIPM International Committee for Weights and Measures (in French, Comité
International des Poids et Mesures)
CIPM MRA Comité international des poids et mesures - Mutual Recognition
Arrangement
CMC Calibration and Measurement Capability
CMI Ceský metrologický institut (the Czech Republic’s NMI)
CP cone-and-plate (measuring systems)
(C)RM (Certified) Reference Material
CSD (or CD) controlled shear deformation
CSR (or CR) controlled shear rate
CSR (or CR) controlled shear rate
CSS (or CS) controlled shear stress
xxvi
DIN Deutsches Institut für Normung (the German’s standards organization)
DMA Dynamic-Mechanical Analysis
DMDM Ministarstvo privrede Direkcija za mere i dragocene metale (the
Serbia’s NMI)
EC European Commission
EMPIR European Metrology Programme for Innovation and Research
EMRP European Metrology Research Programme
EURAMET European Association of National Metrology Institutes
EURAMET TC-M EURAMET Technical committee for metrology in Mass and Related
Quantities
FCT/UNL Faculdade de Ciências e Tecnologia da Universidade Nova de Lisboa
GUM Guide to the Expression of Uncertainty in Measurement
GUM GUM Central Office of Measures (the Poland’s NMI, In Polish: Glowny
Urzad Miar)
HP High-Pressure
HW Hydrostatic Weighing
IMBiH Institut za mjeritejstvo Bosne i Hercegovine (the Bosnia and
Herzegovina’s NMI)
INM I.P. Institutul National de Metrologie (the Republic of Moldova’s NMI)
IPK International Prototype of the Kilogram
IPQ Portuguese Institute for Quality (in Portuguese, Instituto Português da
Qualidade)
IPR Intellectual Property Rights
ISO Internal Organization for Standardization
JRP Joint Research Project
JV Justervesenet (the Norway’s NMI)
KC Key Comparison
KCDB Key Comparison Database
LNM National Metrology Laboratory (in Portuguese, Laboratório Nacional de
Metrologia)
LPL Laboratory of Properties of Liquids (in Portuguese, Laboratório de
Propriedades de Líquidos)
LVE Linear viscoelastic
MKEH Hungarian Trade Licensing Office (the Hungary’s NMI), now renamed
as to Government Office of the Capital City Budapest, BFKH
NIST National Institute of Standards and Technology (North American NMI)
NL Newtonian liquid
NMI National Metrology Institute
NNL Non-Newtonian Liquid
NPL National Physical Laboratory (the UK’s NMI)
xxvii
OIML International Organization of Legal Metrology (in French, Organisation
Internationale de Métrologie Légale)
PAO Poly-alpha-olefin
PP Parallel plate (measuring systems)
PRT Platinum resistance thermometer
PT Proficiency Testing
PTB Physikalisch-Technische Bundesanstalt (the Germany’s NMI)
RMO Regional Metrology Organisation
SC Stakeholder Committee
SC Subcommittee
SDS Safety Data Sheet
SI International System of Units (in French, système international
d’unitées)
SMOW Standard Mean Ocean Water
SVM Stabinger’s viscometer
TC Technical Committee
TUBITAK Türkiye Bilimsel ve Teknolojik Araştırma Kurumu (the Turkey’s NMI)
VIM International Vocabulary of Metrology (in French, Vocabulaire
International de Métrologie)
VSL Van Swinden Laboratory (the Netherlands’ NMI)
VSMOW Vienna Standard Mean Ocean Water
xxix
List of symbols and signs
L
ATIN CHARACTERS(
SMALL LETTERS)
f frequency [Hz]
g gravitation constant [m/s2]
h gap dimension, layer thickness, fluid level [m]
k coverage factor (JCGM 100:2008)
lg logarithm (to the basis 10)
ln natural logarithm (to the basis e, Euler’s number)
m mass [kg]
p pressure [0,1 MPa =1 bar]
r radius [m] t temperature [ºC] u standard uncertainty (JCGM 100:2008) U expanded uncertainty (JCGM 100:2008) v velocity [m/s] V volume [m3]
L
ATIN CHARACTERS(
CAPITAL LETTERS)
A area [m2]
F force [N]
G shear modulus [Pa]
G*, G’, G’’ complex shear modulus, storage modulus, loss modulus [Pa]
J (shear) compliance (creep tests) [Pa-1]
M torque [mNm]
Q quality factor (of a harmonic oscillation) [1]
xxx
T (absolute) temperature [K]
G
REEK CHARACTERSγ deformation or strain [%], [1]
γ shear rate (strain rate; dγ/dt) [s-1]
δ phase shift angle, loss angle [º]
tanδ loss factor, damping factor [1]
η (shear) viscosity [Pa s]
η*, η’, η’’ complex viscosity, and its real and imaginary part [Pa s]
ν kinematic viscosity [m2/s]
ρ density [kg⋅m-3]
τ shear stress [Pa]
1
I.
Thesis Research Framework
The dimension of the impact of metrological traceability of density measurements and rheological determinations of liquids in our daily life may not be very clear at first sight for all citizens. A Metrology Scientist will take only few minutes to get a rough idea on the influence of these two parameters in our Society. In terms of economic impact, one can think of the commercial transactions that are made with basis on the density of the liquids, such as in the oil and food industries. It is easy to realize that the liquids produced, controlled and manipulated by these industries have very different physical properties, such as density, viscosity and viscoelasticity that may influence the density measurements results when some types of measurement methods are used. Of equal importance is to be able to obtain accurate density and viscosity measurements, of all these liquids, with application in the design of the production and filling lines in these industries. For instance, the economic impact of a correct line design can be, among others, related with the efficiency of the use of the pumps, namely when non-Newtonian liquids are concerned. In other hand, and not less important, the knowledge of these parameters has a great impact in operational safety. As example, one can think about the disaster occurred in 2010 in the Deepwater Horizon drilling rig at Gulf of Mexico, with great impact in terms of Human and animal lives loss as well as environmental. When drilling deep for gas and oil or for the purpose of building bridge piles or taking core samples for a future tunnel, non-Newtonian drilling fluids are used. Other example is when the pressurised fluids transports hydraulic power to the down hole drilling assembly and the drill bit, the balance of fluid pressure in the pores of the surrounding formation, stabilises the borehole walls, washes the cuttings out of the well, and lubricates the drill bit.
Practical metrological needs and requirements can illustrate the relevance of this topic. Other situation, with a large importance in the actual consumption patterns, are the prepacked products, i.e. a product contained inside a package that is sale with the quantity (volume or mass) displaying a predetermined value. When the quantity of a liquid product in a package is expressed in terms of volume but verified by weighing, it is also necessary to determine the density of this product. The quantities of prepacked products are regulated by European Directives (Council Directive 76/211/EEC; Council Directive 80/232/EEC and Directive 2007/45/EC of the European Parliament and of the Council). It has been seen that, in practice, the methods for measuring density of these liquid products are frequently not well understood by the end-users, leading to significant systematic errors (OIML G 14:2011). The Guide 14
2
(2011) and the Bulletin number 96 (1984), produced by the International Organization of Legal Metrology (OIML, in French, Organisation Internationale de Métrologie Légale), pointed out oscillation-type density meters as suitable measuring instruments to determine the density of several of these types of liquids, such as: liquids without dissolved carbon dioxide or other gases; viscous liquids, e.g., lubricating oils, paints, varnishes; solvents; cleaning, cosmetic and washing products. This wide variety of liquids, ranging in a broad density, viscosity and viscoelastic ranges requires sophisticated calibration procedures of these instruments. In addition, some of these products are produced, manipulates, packed and transport at high temperatures and pressures. The European Directives regarding the mandatory control of the volume of the liquid contained in prepacked products for consumer protection as well as the introduction of these products in the market, had intensified the request of these industries, and others stakeholders, to National Metrology Institutes (NMI) to provide the proper calibration services. For this, and other for reasons, the improvement of the metrological quality of density, viscosity and viscoelasticity measurements will have direct an impact on the industrial site, leading, for instance, to a reduction of the production of non-conforming products in pre-packaged industries and, therefore, leading to a better competitiveness. In terms of society, having the proper methods to control the volume inside a prepacked liquid will boost the confidence on the markets.
In short, the establishment of a proper and recognised traceability chain for density, viscosity and viscoelasticity measurements of liquids is mandatory for the enhance of the confidence and competitiveness of national industries, as well to potentiate the research developed in several laboratories. Additionally, from the environmental site, a highest-level aspect is the need for accurate density measurement of seawater (for salinity determination) in the European marginal seas to be used for the description of oceanic currents as base for climate modelling.
3
II.
I
NTRODUCTION
This chapter aims to frame, in the big picture, the question discussed in this work. For that, the metrological traceability of density, viscosity and viscoelasticity measurements, of liquids, are described in some extent, including the realization and dissemination of the respective units, all way through the metrological hierarchy pyramid, from the SI, to primary standards down to the working instruments used for field measurements. Thus, given state-of-the-art information about the uncertainties associated with the existing measurement methods used to determine these quantities, allowing to frame the magnitude of uncertainties obtained throughout the present work. Another explored point, to some extent, was the calculation of measurement uncertainties by presenting their assumptions and describing practical examples, specifically in the case of rheometry. The roadmap of liquids' density metrology at IPQ is also described in detail.
5
II.A
M
ETROLOGICAL
T
RACEABILITY OF
D
ENSITY
M
EASUREMENTS OF
L
IQUIDS
The density ρ, of a body is defined as the quotient of its mass m, and its volume V (ρ = m/V). The unit of density is therefore kg⋅m-3. Given this relation, and mainly in liquids, it is often the case that their mass
is determined based on volume and density measurements. Density is of great economic importance, for instance, everywhere the price of a product is related with its volume, but where the mass is measured (or vice-versa). Whereas for this purpose, a relative standard uncertainty of density
measurements from 1⋅10‒4 up to 1⋅10‒3 is found sufficient, while in oceanography, in which the ocean
currents caused by density differences are studied, relative uncertainties lower than 1⋅10‒5 are found as
required. Within the scope of the discussions on climate change, such measurements are of great interest, especially for model calculations where an accurate knowledge of water density as a function of temperature and pressure is necessary. The existence of reference tables and formulas for water density allow the use of ultra-pure water as a liquid density standard, with a low relative uncertainty of 1⋅10‒5 (Bettin, Borys & Nicolaus, 2008). Similarly, vacuum oils (a recent substitution of pure mercury)
are used as a density standard to trace back the pressure measurement to the height measurement of a vacuum oil column (the pressure p of a liquid column is p = gρh, where g is the gravitational acceleration of the Earth, ρ the density of the liquid and h the height of the liquid column) (Ehlers et al., 2019).
II.A.1. R
EALISATION OF DENSITY UNITThe concept of metrological traceability is defined as the property of a measurement result whereby the result can be related to a reference through a documented unbroken chain of calibrations, each contributing to the measurement uncertainty (JCGM 200:2012). This property of a measurement result is assured by ensuring a documented, unbroken chain of instrument calibrations, from the working instruments used for field measurements, all the way up the metrological hierarchy pyramid to the primary standard (JCGM 200:2012). At the top of this pyramid is an internationally defined and accepted
6
reference, in most cases the International System of Units (SI), whose technical and organizational infrastructure has been implemented and developed by the International Bureau of Weights and Measures (BIPM, in French Bureau International des Poids et Mesures).
The SI was previously defined in terms of seven base units, and derived units that where defined as products of powers of the base units. The seven base units were chosen, for historical reasons, and were, by convention, regarded as dimensionally independent: the meter, the kilogram, the second, the ampere, the kelvin, the mole, and the candela. In a landmark decision, the BIPM's Member States voted on the 16th of November 2018 to revise the SI, changing the world's definition of the kilogram, the
ampere, the kelvin and the mole. This decision, made at the 26th meeting of the General Conference on
Weights and Measures (CGPM), would mean that from 20th of May 2019, all SI units will be defined in
terms of constants that describe the natural world. This would assure the future stability of the SI and would open the opportunity for the use of new technologies, including quantum technologies, to implement the definitions. So, the present SI is now defined in terms of seven defining constants:
caesium hyperfine frequency ∆νCs; speed of light in vacuum c; Planck constant h; elementary charge e;
Boltzmann constant k; Avogadro constant NA; and luminous efficacy of a defined visible radiation Kcd. As the authors Cabiati & Bich (2009) described, to define the units by reference to fundamental constants implies to abandon the identification of the unit with its primary standard, as in the old metrological tradition. Meaning that to realise a unit will consist in assigning a value to a primary standard, consistent with the fixed values of the reference constants, by means of an experimental procedure, independent of a specific definition. The primary standard should be suitable to dissemination by direct comparison, thus essentially stable and accessible with the highest precision, while the role of the realisation experiment would be mainly related to indirect measurements, typical of scientific activity, which involves the coherence of the unit system. The two distinct roles, of unit realisation and primary standard, correspond to different uncertainty components, of which only one is implied in dissemination activity, just aiming at compatibility of measurements of a specific quantity. Each of the two uncertainty components has a different evolution from the time of the unit redefinition. At the national level, practical realisation, maintenance and dissemination of the SI quantities, is one of the main tasks of the National Metrology Institutes (NMI), that it is the case of the Portuguese Institute for Quality (IPQ). So, each NMI must maintain the national primary standards and intercompare them periodically, issuing quantitative equivalence statements published in the key comparisons database of the BIPM (KCDB-BIPM). The third link in the traceability assurance chain is from the responsibility of calibration laboratories, accredited in accordance to the international standard ISO/IEC 17025 (2017). Accreditation ensures that the calibration methods they employ are appropriate, well executed and recognised worldwide. Importantly, it also ensures that the unbroken chain of calibrations is well documented, i.e. metrological traceability is assured.
In the past hundred years, the accuracy of the realization of the density unit has improved by a factor of
nearly 100. At the beginning of the 20th century, an uncertainty of approximately 2⋅10‒6 was achieved
when it was checked whether the mass of the kilogram prototype was in agreement with the former
definition as the mass of 1 dm3 of water at 4 °C. Currently, the most accurate primary density standards
have an uncertainty of approx. 4⋅10‒8, whereby an improvement to 1⋅10‒8 was aspired within the scope
of the Avogadro Project (Bettin, Borys & Nicolaus, 2008).
After the implementation of the revised SI, the kilogram changed from being equal to the mass of the International Prototype of the Kilogram (IPK) to a quantity related to a fixed numerical value of the Planck constant. At this point the IPK changed from having a fixed mass without uncertainty to having a mass with a finite uncertainty which can change with time. Directly after the implementation date of the revised SI, the IPK will inherit the uncertainty that had previously been associated with the Planck constant,