Business Model Benchmarking:
How a Machine Learning-Based Tool Can
Support Business Model Innovation
Luca Lenz
Dissertation written under the supervision of Prof. René Bohnsack
Dissertation submitted in partial fulfilment of requirements for the
MSc in International Management at the the Universidade Católica
Abstract 1
Abstract
An increasing body of literature has developed around business models and business model innovation in recent years, establishing the concepts’ relevance for the competitiveness of a firm. The process of innovating a business model is less researched and still constitutes a com-plex and challenging task for businesses. Despite the advancements of technology, only few tools have been developed to support said process. Thus, present work focuses on how this process can be facilitated by introducing the concept of benchmarking and complementing it through a machine learning model. A machine learning supported multi-case theory building approach was followed to indicate how benchmarking business models might benefit compa-nies and to arrive at a machine learning model supporting this endeavour. The business models of 306 firms were evaluated to do so. Benchmarking business models can benefit a company by monitoring and learning from other organizations to spark innovation and support idea cre-ation. The machine learning model predicts business model patterns which are used to make processes across companies comparable. The present thesis results in a business model bench-marking tool which supports managers and entrepreneurs alike in their quest of business model innovation.
Keywords: Business Models, Business Model Innovation, Benchmarking, Business Model Pat-terns, Artificial Intelligence, Machine Learning
Title: Business Model Benchmarking: How a Machine Learning-Based Tool Can Support Busi-ness Model Innovation
Sumário 2
Sumário
Nos últimos anos, um número significativo de estudos foram desenvolvidos em torno de modelos de negócios e na inovação dos mesmos, afirmando a relevância destes conceitos para a competitividade de uma empresa. O processo de inovação de um modelo de negócio não só é pouco estudado, como ainda constitui uma tarefa complexa e desafiadora para as empresas. Apesar dos avanços da tecnologia, apenas algumas meios foram desenvolvidos para dar suporte ao referido processo. Assim, a presente dissertação realça como este processo pode ser facilitado, introduzindo o conceito de benchmarking e completando-o através do modelo ‘machine learning model’. Multi-case theory building foi apoiado pelo modelo ‘machine
learning model’ para indicar como a análise de benchmark dos modelos de negócio podem
beneficiar as empresas e para alcançar um machine learning model que suporte esse esforço. Nesse sentido, os modelos de negócio de 306 empresas foram avaliados. A aprendizagem e monitorização de outras organizações pode beneficiar o modelo de negócio de uma empresa, estimulando a inovação e a criação de novas ideias. Machine learning model é um modelo que prevê os padrões de modelos de negócio que são utilizados para tornar os processos entre empresas comparáveis. A presente dissertação desenvolveu um método de análise de benchmark de modelos de negócio que apoia gerentes e empreendedores na pesquisa pela inovação de modelos de negócio.
Palavras-chave: Palavras-chave: Modelos de Negócios, Inovação de Modelos de Negócios, Benchmarking, Padrões de Modelos de Negócios, Inteligência Artificial, Machine Learning Título: Benchmarking de modelos de negócios: como um método baseado no machine learning
model pode apoiar a inovação de modelos de negócios.
Acknowledgements 3
Acknowledgements
After nearly two years of studying at Católica Lisbon School of Business and Economics, the conclusion of this work marks another milestone of my life. Starting in September 2018, I could have never imagined what challenges lay ahead, how much I would learn, and how many great friends I was about to make. To everyone who was part of this journey, thank you.
This intense time created new and fastened old friendships which I am thankful of. To mention just a few, I want to wholeheartedly thank my friends and proofreaders, Lea and Vivien, who not only supported me throughout my studies, but in every aspect of my life. No matter how far the distance was. Matthias, for being the best friend in the most difficult times. And of course, my girlfriend Claudia. The person who stood by and motivated, but also intellectually chal-lenged me during all this time. Without you, this time would have never been so bright. Moreover, I want to thank my supervisor René Bohnsack for his guidance and valuable input which contributed to the high quality of this work. Additionally, to all contributors of his smart city innovation lab and participants of the bi-weekly calls. A special thanks hereby, to the ML expert, our collaboration and discussions have majorly contributed to my comprehension of this challenging topic.
Lastly, I want to thank my family. Without you, this journey would not have even started. I want to thank my brother, who has the wonderful gift of simultaneously cheering one up and relaxing one just with his sheer presence. Most importantly, I want to thank my mother and father. There are simply no words to express how much I owe and thank you. For your unwa-vering belief in us and your relentless support of whatever idea comes to our mind. For all of this, I am eternally grateful.
Table of Contents 4
Table of Contents
Abstract ... 1 Sumário ... 2 Acknowledgements ... 3 Table of Contents ... 4 List of Figures ... 6 List of Tables ... 7 List of Abbreviations ... 8 Introduction ... 9 1 Literature Review ... 11 1.1 Business Models ... 111.2 Business Model Dynamics in the Context of Competition ... 12
1.2.1 Competition and Business Model Innovation ... 12
1.2.2 Impediments to Business Model Innovation ... 14
1.2.3 Business Model Benchmarking ... 16
1.2.4 Business Model Patterns for Business Model Innovation ... 18
1.3 Artificial Intelligence and Machine Learning ... 19
1.3.1 Definition of Concepts ... 19
1.3.2 Artificial Intelligence in Business and Implications for Competition ... 20
2 Methodology ... 23
2.1 Exploratory Data Analysis ... 24
2.2 Multi-Case Theory Building ... 30
2.3 Machine Learning Support for Theory Building ... 32
2.4 Benchmarking Processes ... 34
3 Findings ... 37
3.1 Machine Learning Results ... 37
3.2 Multi-Case Theory Building Results and Visualization ... 39
Table of Contents 5
4.1 Managerial Implications ... 46
4.2 Theoretical Implications ... 47
4.3 Limitations and Future Research ... 48
Conclusion ... 50
References ... 51
Appendix I: Business Model Pattern Description ... 62
Appendix II: F1-Scores Original ML Model ... 70
Appendix III: Detailed Elaboration on EDA ... 73
Appendix IV: Results of Upstart Allocation ... 74
Appendix V: F1-Scores Final ML Model ... 78
Appendix VI: Algorithm Training and Testing Data ... 80
List of Figures 6
List of Figures
Figure 1: Business Model Innovation Process ... 14
Figure 2: Forms of Benchmarking ... 17
Figure 3: Usage and Benefits of Artificial Intelligence in Business ... 22
Figure 4: Count of Predicted BMPs by Original ML Model ... 25
Figure 5: Top Ten Most Predicted BMPs by Original ML Model ... 25
Figure 6: Accuracy Evaluation of Machine Learning Models ... 26
Figure 7: Relationship Between Number of BMPs and Market Value ... 27
Figure 8: Proportional Distribution of BMPs Across Industries ... 29
Figure 9: Distribution of Industries Within OD, S&P 500 and Upstarts Datasets ... 31
Figure 10: Orignial Machine Learning Model ... 33
Figure 11: Model for Conception of a Benchmarking Project ... 35
Figure 12: Detection of the BMPs Experience Selling (ES) and Leverage Customer Data (LCD) ... 41
Figure 13: Visualization of the Benchmarking Tool, Example: GM ... 45
Figure 14: Process of Compiling the Cases and Utilization ... 74
Figure 15: Customer Journey of Smart Business Modeling Tool ... 81
List of Tables 7
List of Tables
Table 1: Split of BMP Allocation ... 32
Table 2: Meta-Components for BMP Categorization ... 36
Table 3: Machine Learning Experiment Results ... 37
Table 4: Most Employed BMPs Within Upstarts and OD ... 39
Table 5: Detection of Revenue Sharing and Two-Sided Market Within Datasets ... 42
Table 6: BMP Description Overview ... 69
Table 7: F1-Score Results of K-Fold Cross Validation, Original Model ... 72
Table 8: Resulting Allocation of BMPs to Upstarts ... 77
List of Abbreviations 8
List of Abbreviations
AI Artificial Intelligence
BM(s) Business Model(s)
BMI Business Model Innovation
BMP(s) Business Model Pattern(s)
EDA Exploratory Data Analysis
GICS Global Industry Classification Standard
MCTB Multi-Case Theory Building
ML Machine Learning
OD Original Dataset
VCap Value Capture
VC Value Creation
VD Value Delivery
Introduction 9
Introduction
Around the world, the demise of former business giants such as Blockbuster serve as primary examples for the effects of external shocks on the competitiveness of firms. A common source of such shocks are technological changes (Ansari et al., 2016; Benner, 2010; C. M. Christensen & Rosenbloom, 1995; Hill & Rothaermel, 2003; Sood & Tellis, 2011; Tushman & Anderson, 1986). Amplifying this disruptive force or causing it as well are innovative business models (BMs) (Casadesus-Masanell & Zhu, 2013; Kapoor & Klueter, 2015; Markides, 2006). For in-stance, when Netflix expanded its online business by introducing a high-tech streaming platform, the video rental company Blockbuster fought back by extending its brick and mortar stores and online rental offering (C. M. Christensen, McDonald, Altman & Palmer, 2018). Whereas Blockbuster rented out DVDs and charged excessive late-fees, Netflix employed a complex but customer-friendly ‘all-you-can-watch, on-demand, low-price, high-quality, highly
convenient’ subscription model (C. M. Christensen et al., 2015, p. 7). Today, out of the formerly
9000 blockbuster stores the company owned in 2004, only one remains (Olito, 2020).
The previous example illustrates how changes in technology and BMs need to be accounted for by companies. Regarding technological change, there is currently no other theme as imminent as artificial intelligence (AI). Although AI is feared to automate jobs, researchers and practi-tioners alike are working on concepts of how AI can be embraced to reinforce human capabilities, rather than replacing them (Dellermann et al., 2018; Raisch & Krakowski, 2020; Wilson & Daugherty, 2018).
Despite the establishment of the BM in management literature as an organization’s way of doing business, (Cachon, 2019; Täuscher, 2018) and growing research in how to innovate a BM (Foss & Saebi, 2017), changing or innovating one still seems to be a laborious task. The fact that BMs are built upon internal and external factors (Teece, 2018) and include transactions with various stakeholders (Zott & Amit, 2010) complicates business model innovation (BMI). In a focus group conducted by Frankenberger et al. (2013), the interviewed managers stated their difficul-ties of monitoring important changes and the lack of a tool to ‘support idea generation for
business models’ (Frankenberger et al., 2013, p. 9). Although IT-tools are primed to support the
BM design process (Del Giudice & Straub, 2011), little has been done to do so (Ebel et al., 2016). Thus, in order to address these deficiencies, present work asks:
Introduction 10
How can monitoring firms and learning from them benefit the business model innovation process and how can artificial intelligence support it?
Present thesis is structured along four chapters. In the first chapter, a comprehensive literature review delineates the concepts of BMs and BMI and describes how benchmarking, business model patterns (BMPs) and the use of AI can benefit the BMI process. Chapter two outlines how the research questions are addressed, following a machine learning (ML) supported multi-case theory building approach by Tidhar and Eisenhardt (2020). Subsequently, the third chapter illustrates the findings of this study and introduces a ML supported tool for benchmarking BMPs. Lastly, chapter four discusses the managerial and theoretical implications of this thesis and concludes with its limitations and future research suggestions.
Literature Review 11
1 Literature Review
The following literature review describes business models in the context of competition and investigates the basis and drivers of business model innovation. Subsequently, benchmarking is introduced to facilitate the BMI process. Lastly, the application of artificial intelligence and its managerial benefits for decision-making are outlined.
1.1 Business Models
In recent years, extensive literature has developed around BMs as a concept in management theory (Massa et al., 2017), disproving Porter’s (2001) criticism of the BM as ‘an invitation for
faulty thinking and self-delusion’ (Porter, 2001, p. 13). Besides the research on BMs, a
ubiqui-tous definition of BMs has not been obtained until today (Massa et al., 2017). The most prevalent definitions describe BMs on a meta-level as an activity system of a firm (Zott et al., 2011). An activity system of a firm refers to transactions with various stakeholders such as suppliers and customers (Amit & Zott, 2001; Zott & Amit, 2010). Such an activity can be un-derstood as any transaction of physical or capital resources that a relevant party contributes to achieve a focal firm’s objective (Amit & Zott, 2001; Zott & Amit, 2010). Supporting this view, Teece (2010; 2018) describes the BM as the architecture of a firm’s activities to satisfy customer needs. Key element of this definition is the focus on the creation of value for customers. Thereby, a business model focuses on how value is created for them, the value delivery as well as capturing said value (Teece, 2010, 2018).
Synthesizing the literature, it becomes apparent that BMs are utilized as a relatively new unit of analysis to investigate the value creation process of firms (Zott et al., 2011). Most definitions of BMs have in common that they focus on the realization of customer needs, how to address them most efficiently, and how to capture the created value (Cachon, 2019; Gassmann et al., 2014; Teece, 2018; Zott et al., 2011). Since Teece’s (2018, p. 41) definition of the BM appro-priately harmonizes mentioned theories, present work will refer to a BM as:
‘The design or architecture of the value creation, delivery, and capture mechanisms it employs. The essence of a business model is in defining the manner by which the enterprise delivers value to customers, entices
Literature Review 12
1.2 Business Model Dynamics in the Context of Competition
To understand why and how companies reconfigure their business model, the following chap-ters elucidate BMs under the aspect of competition and the corresponding process of business model innovation. It further illustrates the drawbacks of business model innovation and opens a way out by introducing the concept of benchmarking and business model patterns.
1.2.1 Competition and Business Model Innovation
Markets and competition are changing with increasing speed and require companies to respond quickly and decisively to new environments (Hermelo & Vassolo, 2010; Yoo et al., 2012). Thus, superior performance and its antecedent competitive advantage are more short-lived for the majority of firms (Wiggins & Ruefli, 2005). Sustainable competitive advantage has become rare and is rather a concatenation of short-term advantages over time (Wiggins & Ruefli, 2005). Additionally, digitization and technological advancements increase the pace of how markets and products change which requires companies to quickly adapt their activities and innovations (Yoo et al., 2012). This, and the more frequent appearances of new competitors in a market, lead to a more intense competition in general (Hermelo & Vassolo, 2010; McNamara et al., 2003).
Managing BMs stipulates one possible option of competing on the firm-level in the modern era (Casadesus-Masanell & Zhu, 2010). Hereby, BMI became a central theme to competition, de-scribing the “designed, novel and nontrivial changes to the key elements of a firm’s BM and/or
the architecture linking these elements” (Foss & Saebi, 2017, p. 201). Thus, in order to stay
competitive or react to new entrants, companies reconfigure their BM (Abdelkafi et al., 2013; Casadesus-Masanell & Zhu, 2013; Saebi et al., 2017), adopt or develop a new BM (Fjeldstad & Snow, 2018; Martins et al., 2015), or build up a BM portfolio including multiple BMs (Ahuja & Novelli, 2016; Eklund & Kapoor, 2019; Tripsas & Gavetti, 2000).
To innovate a BM successfully, a firm should base it on the resources and capabilities of the firm (Barney, 1991; Teece, 2018; Teece et al., 1997) and adjust it to the opportunities in its external environment (Baden-Fuller & Haefliger, 2013; Baden-Fuller & Morgan, 2010). For instance, Kind et al., (2009) find that media outlets adjust their BMs according to their compe-tition. In the absence of substitute products, media companies are more inclined to choose a subscription model since customers do not have an alternative to turn to and thus are considered less price sensitive. If there are one or more substitute products present, media firms rather
Literature Review 13
bundle their activities to increase the customer base by offering their product for free and using an advertising BM for value capture (Kind et al., 2009).
Alternatively, firms can also diversify their BMs, i.e. employing various BMs in a BM portfolio (Aversa et al., 2017). When employing a BM portfolio, it is imperative for the BMs to be aligned, meaning to share resources and create synergies amongst them (Sabatier et al., 2010). By doing so, the BM portfolio will support sustaining advantages but also spread business risk by diversifying revenue streams and creating valuable capabilities in the future (Casadesus-Masanell & Tarzijan, 2012; Sabatier et al., 2010). Amazon’s success in recent years exemplifies latter process (Aversa et al., 2017). Starting with a simple e-commerce BM of selling books, Amazon invested heavily in IT infrastructure and developed the necessary capabilities to em-ploy digital platforms in recent years. At present, the company leverages these capabilities in different business units which employ various BMs such as Amazon Web Services (Aversa et al., 2017). In general, the successful innovation of a BM has been found to potentially build a basis for competitive advantage (Desyllas & Sako, 2013; Frankenberger & Sauer, 2019; Teece, 2010).
To support adjustments to the external environment, firms also base their activities regarding BMI on diverse learning processes (Andries & Debackere, 2013; Foss & Saebi, 2017; Frankenberger & Sauer, 2019; McDonald & Eisenhardt, 2019). Hereby, firms compare own processes to peers and competitors to ensure an effective BM design (Casadesus-Masanell & Zhu, 2013; McDonald & Eisenhardt, 2019). Explicitly, McDonald and Eisenhardt (2019) found that firms which successfully implemented a BM that increases customer value, integrated pro-cesses of BMs as prototypes to imitate firms in nascent markets. The prototypes were tested to establish hands-on learning with the company’s customers. In addition, firms also borrow at-tributes from well-established firms which were already legitimized by their customers (Martins et al., 2015; McDonald & Eisenhardt, 2019). For instance, part of Tesla’s positioning includes its vertical integration and focus on high-end, luxurious design and technology (Wang, 2018). Thus, similarly to Apple’s activity system and its focus on design and technology, Tesla chose to reveal its products on a prominent stage at their headquarter and sells through privately owned high-end stores in shopping-centers (Martins et al., 2015).
A framework of how to approach the BMI process is provided by Frankenberger et al. (2013), as shown in Figure 1. According to the researchers, the BMI process starts with Initiation which encompasses the monitoring and comprehension of the external environment of a firm. Hereby, it is crucial to monitor other players regarding their movements and choices. Additionally, the
Literature Review 14
root causes of changes in the environment should be understood. The second step, Ideation, refers to the creation of ideas about how to innovate a BM. The challenges to conquer in this stage consist of overcoming the current business logic, difficulties in thinking in BMs and the lack of tools to develop new ideas. Activities in the Integration phase regard the development of a new BM by considering all processes and stakeholders. Lastly, the Implementation phase focuses on an iterative process of incorporating a BM within a company. (Frankenberger et al., 2013)
Figure 1: Business Model Innovation Process
Based on (Frankenberger et. al, 2013)
1.2.2 Impediments to Business Model Innovation
While competing through BMs can result in the superior performance of a firm (Desyllas & Sako, 2013), the neglection of BMI can accrue high costs and severe consequences for a firm, impeding the innovation of its BM. These obstacles can be categorized into complexity and associated costs as well as managerial cognition and timing.
As activity systems for value creation, delivery, and capture, BMs are comprised of various, interdependent processes within an organization (Foss & Saebi, 2017). Thus, BMs can be seen as complex systems in accordance to Simon’s (1962, p. 468) definition of such systems as var-ious parts which ‘interact in a non-simple way’ (Foss & Saebi, 2017). Therefore, changing a component of a BM correlates with a strenuous architectural change which is often accompa-nied by high costs due to these interdependencies (Foss & Saebi, 2017). Indeed, Eklund and Kapoor (2019) find that innovating a firm’s BM comes with significant costs. When incumbents try to adapt to a new entrant with a superior BM, they incur adjustment costs which are caused by implementing new processes and assets while managing the activities of the old value gen-erating BM (Eklund & Kapoor, 2019). Additionally, when incumbents invest in a new model,
Literature Review 15
their market valuation decreases, resulting in lower liquidity of the incumbent (Eklund & Kapoor, 2019).
Moreover, the emergence of a more value generating BM can result in an inertia of managers caused by their limited cognition (Tripsas & Gavetti, 2000). For example, Tripsas and Gavetti (2000) demonstrate that Polaroid faced the emergence of a new technology which was accom-panied with a transformation of the value creating Razor and Blade BM1. Not accepting the new
reality, the managers’ inertia prevented the firm from adapting its BM which, in combination with the new technology, eventually resulted in Polaroid’s collapse (Tripsas & Gavetti, 2000). Further evidence from the photography industry shows that by changing their BM to a low cost one (No Frills), Kodak was able to challenge the position of the hitherto most successful in-cumbents in that market, Canon and Sony (C. M. Christensen, 2006; Lucas & Goh, 2009). This transformation established the firm as the biggest player in digital photography at that time (C. M. Christensen, 2006).
Managerial cognition, especially the attention of managers to external factors, can also influ-ence the design and success of BMI. Whereas Frankenberger and Sauer (2019) find that the attention to a certain topic such as a new source of value creation influences the design of a BM, McMullen et al. (2009) argues that managerial attention to competitive intelligence is a determinant of whether a company is able to sustain its performance when facing a competitive threat. Closely linked to managerial attention is the timing of BMI. The literature on competitive responses and dynamic capabilities highlights the importance of making timely decisions when responding to a competitive threat (Barreto, 2010; Bowman & Gatignon, 1995). This was also found to be true for BMI as Kim and Min (2015) denote the timing of BMI as one determinant of its success. However, managerial attention is a limited cognitive resource an thus subject to delusion and faulty thinking (Kahneman et al., 1992; Murphy et al., 1992). This illustrates the need for portraying changes within a company’s environment timely and comprehensively. Whereas monitoring of a firm’s environment is critical to commence BMI (Frankenberger et al., 2013), it also determines a BM’s design (Frankenberger & Sauer, 2019). Further, being linked to managerial attention and the timing of a decision, monitoring also influences the suc-cess of BMI (Frankenberger et al., 2013; Kim & Min, 2015; McMullen et al., 2009).
1 The sales of a basic, low price product which needs specific consumables to be used. The consumables are highly
Literature Review 16
1.2.3 Business Model Benchmarking
As previously highlighted, important factors to the design and success of BMI are monitoring a focal firm’s environment and learning from other organizations. Benchmarking stipulates an acknowledged practice for businesses and management which allows companies to address shortcomings in their organizational processes by learning from other’s best practices (Kunisch, 2017; Watson, 2007).
In general, benchmarking describes the process of comparing one focal object’s implicit stand-ing to another reference point (Bamberger & Fiegenbaum, 1996; Feststand-inger, 1954; Zucker, 1987). Its business application denotes the process of comparing the performance and process characteristics between two or more organizations in order to learn how to improve (Watson, 2007). The usage of benchmarking is intended to generate organization-wide core competencies to support achieving a competitive advantage (Bamberger & Fiegenbaum, 1996; Watson, 1993). The process can be partitioned into identifying key areas for improvements and address-ing these needs by learnaddress-ing from other organizations’ similar operations which are regarded as best practices (Bamberger & Fiegenbaum, 1996; Elnathan & Kim, 1995). Hereby, the organi-zation identifies and studies standards and best practices of other organiorgani-zations according to which it implements processes and systems to enhance its own productivity and performance (Camp, 1989). Thus, previously described characteristics of the benchmarking process resem-ble some components of BMI such as understanding and learning from a firm’s environment. Most forms of benchmarking can be categorized as being either based on the nature of the ref-erence point or the process which a firm demands to be improved (Wolfram Cox et al., 1997). Based on said differentiation, Wolfram Cox and colleagues (1997) provide a comprehensive overview of categorizations for benchmarking projects as illustrated in Figure 2. Benchmarking based on the reference point is focused on the organizations a firm compares itself to. The ge-neric Best in Class benchmarking relates to the best performing firm, whereas Industry benchmarking includes competitors and non-competitors of a given market. Competitive bench-marking narrows the reference points down to direct competitors, whereas Internal benchmarking only focuses on processes within the company and across different departments. Benchmarking based on processes distinguishes Global benchmarking, considering all organi-zations that employ a process, and Strategic benchmarking which focuses on a rather long-term improvement in a process. Performance based benchmarking considers the outcome of the
Literature Review 17
benchmarked process whereas Functional benchmarking solely regards a precisely defined pro-cess or system. Effectively, these categories can be utilized to understand the theoretical concept of benchmarking but are often combined in practice. (Wolfram Cox et al., 1997)
Figure 2: Forms of Benchmarking
Based on Watson (2007) and Wolfram Cox et al. (1997)
Bearing in mind that BMI partly relies on monitoring its external environment and learning from others, there are several interconnections in the literature of how the benchmarking prac-tice can benefit BMI. First, industry benchmarking offers a structured approach to seize and react to external opportunities (Watson, 2007). To facilitate an effective BM design companies study and learn from competitors and other market participants (McDonald & Eisenhardt, 2019). Further, effective BM design includes the consideration of “the broader business
envi-ronment” (Teece, 2010, p. 21). Addressing named characteristics, industry benchmarking
contributes to understanding and learning from competitors and non-competitors in a defined milieu. Thereby, it might benefit BMI since the utilization of BMs has been found to be subject to the industry a firm operates in (Saebi et al., 2017).
Second, the interdependency of a firm’s strategy and its activity system of a BM includes vari-ous organizational processes to which strategic benchmarking can respond to. Strategic benchmarking could enhance BM design since it focuses on the long-term content of what is benchmarked. Content relates to processes or systems of strategic importance on an organiza-tional level (Watson, 2007). Thus, strategic benchmarking for BMs could benefit the BMI
Literature Review 18
process by offering a governed approach to monitor and compare how organizations compete through BMs.
Overall, benchmarking could address the need of BMI for monitoring and learning by offering a structured approach. However, a prerequisite of benchmarking are defined processes, con-trasting the complex activity systems of business models.
1.2.4 Business Model Patterns for Business Model Innovation
In order to mitigate the complexity of benchmarked processes (Saebi et al., 2017), BMPs offer a possible solution. In general, patterns are defined as solutions to recurring problems (Alexander et al., 1977). Moreover, patterns describe ‘the core of the solution to that problem,
in such a way that you can use this solution a million times over, without ever doing it the same way twice’ (Alexander et al., 1977, p. 1216). Integrating this into a BM context, the academic
literature conceives BMPs in three pre-eminent ways as:
1. Generalizations of different activities to increase customer value (Amshoff et al., 2015); 2. Solutions to recurring business problems (Abdelkafi et al., 2013);
3. Descriptions of the core of a solution and as such only solving a specific part of a prob-lem (Remane et al., 2017).
Consolidating these conceptions yields in considering BMPs as proven and documented solu-tions to recurring business problems which can be replicated by others (Amshoff et al., 2015). Further, BMPs might be combined to optimize how businesses generate, deliver, and capture value (Abdelkafi et al., 2013; Osterwalder & Pigneur, 2010). Therefore, a BM of a firm can be replicated by cumulating one or more BMPs (Gassmann et al., 2014).
Academic research on BMPs mostly comprises lists of different applicable patterns (Remane et al., 2017). Hereby, the literature concentrates on a few proven ways to employ BMs, such as Arora et al. (2017) who focus on paid and advertising BMs. Similarly, Rietveld (2018) solely investigates the freemium model. However, this pared representation of value activities is scarcely sufficient to describe the various options of how firms design their activities to generate value (Tidhar & Eisenhardt, 2020).
In contrast, practitioner work often consists of long lists of BMPs which are compiled through studying and observing various companies and conceptualizing their value mechanisms
Literature Review 19
(Remane et al., 2017; Tidhar & Eisenhardt, 2020). For example, Gassman et al. (2014) com-posed a BMP list which is able to represent 90% of all BMIs within the last 50 years. Hereby, BMPs are categorized within four dimensions, by defining who the target customer is; what the value proposition describes; how the value chain is structured to produce the respective offering; and why it generates value with the selected profit mechanism (Gassmann et al., 2014). How-ever, such long lists – ranging from 55 (Gassmann et al., 2014) up until 182 accumulated BMPs (Remane et al., 2017) – are often based on atheoretical research or coincide with each other (Tidhar & Eisenhardt, 2020). In general, the benefit of thinking in patterns lies in a reduction of complexity and the ability to make different business processes comparable.
1.3 Artificial Intelligence and Machine Learning
The digitalization and the effects of today’s data abundance are far-reaching and a major driver of changes (Bharadwaj et al., 2013; Iansiti & Lakhani, 2020; Warner & Wäger, 2019). One theme of technological advancements is artificial intelligence which is utilized not only in a practical context but also in business model research (Dellermann et al., 2018; Szopinski et al., 2019). Following chapters introduce the concepts of artificial intelligence and their applications in business.
1.3.1 Definition of Concepts
The notion of AI originated in computer science (Russell et al., 2010) being defined as “the
study of the design of intelligent agents” (Poole et al., 1998, p. 1). Thereby, an intelligent agent
is a system that acts under perceptual limitations in combination with flexibility towards envi-ronmental and goal-related changes considering the appropriateness of the situation, while learning from experiences (Poole et al., 1998). Today, AI is conceptualized to span a broad field with various definitions. To better comprehend the concept, it can be distinguished between
general AI and narrow AI (Broussard, 2018). General AI describes software and programs that
can think and act fully independently (Raj & Seamans, 2019). However, this form does not exist yet. Therefore, in the present work the connotation of AI is referred to the definition of narrow
AI, which describes highly elaborated and on algorithm-based procedures supposed to find
pat-terns in datasets and making predictions about the future based on these (Broussard, 2018; Raj & Seamans, 2019).
Machine learning is one subcategory of AI and can be understood as a process of how a com-puter is trained on data of a specific task in order to improve its performance on said task (Witten
Literature Review 20
et al., 2017). Within the domain of ML there are three distinguishable learning models (Jordan & Mitchell, 2015):
1. Supervised Learning describes a function that maps (x, y)-pairs of an input object x and predicts a desired outcome measure y. The algorithm is trained and tested with a labelled dataset in order to predict a new unlabeled dataset, e.g. an email spam filter categorizes an email as “no spam” or “spam” based on a dataset with ordinary and spam emails (Hastie et al., 2009; Jordan & Mitchell, 2015; Lecun et al., 2015).
2. Unsupervised Learning denotes a model that analyses unlabeled data and describes pat-terns within the dataset assuming general structural properties, but with no outcome measures to guide the process (Hastie et al., 2009; Jordan & Mitchell, 2015).
3. Reinforcement Learning describes a model that improves by receiving positive or neg-ative feedback after performing a specific task (Sutton & Barto, 2018).
1.3.2 Artificial Intelligence in Business and Implications for Competition
To comprehend the applications of AI in a business context, it is useful to distinguish between two different domains: automation and augmentation (Davenport & Kirby, 2016; Wilson & Daugherty, 2018). The more prevalent reference to AI is the process of automation which de-scribes largely automated and computer-controlled systems, that can execute repetitive procedures (Raisch & Krakowski, 2020). This eventually results in a previously human-per-formed task being now undertaken by a machine (Raisch & Krakowski, 2020; Raj & Seamans, 2019). The application of AI as augmentation describes the process of a human collaborating closely with a machine and thus making decisions that are supported by AI (Amershi et al., 2014; Raisch & Krakowski, 2020). Latter domain is increasingly applied by various companies, i.e. Microsoft and Deutsche Telekom leverage technology to complement or enhance rather than replace human capabilities (Raisch & Krakowski, 2020).
Hitherto, automation was likely to be prioritized in organizations since it increases operational efficiencies, eventually decreasing costs (Davenport & Kirby, 2016). Prerequisites for automa-tion are easily replicable and highly routinized processes (Raisch & Krakowski, 2020). In addition to process optimization, automation also finds applications in other fields, such as HR (Stephan et al., 2017). At JP Morgan Chace, experienced HR managers worked with an AI-based solution to assess and forecast performance in the field of talent acquisition. Originally designed to supplement managers’ decision-making, the US bank automated the whole process
Literature Review 21
in order to increase the fairness of the assessment as well as making the process faster and more efficient. (Raisch & Krakowski, 2020; Riley, 2018)
Automation also benefitted strategic functions: Ferreira et al. (2016) used ML to optimize the price setting of an online retailer. Hereby, algorithms were utilized to forecast consumer de-mand for products which have never been sold before. This was especially useful to optimally price new products and had a positive financial impact on the focal firm (Ferreira et al., 2016). Whereas automation is aimed to eliminate humans from the equation, augmentation describes a co-evolutionary process of humans and machines (Raisch & Krakowski, 2020). Through the interactions and iterations with humans, augmentation is not as sophisticated in scaling effi-ciencies when compared to automation (Davenport & Kirby, 2016). However, managers’ tasks are often too complex to be modelled in an algorithm which necessitates the inclusion of experts in a certain task (Brynjolfsson & Mitchell, 2017; Raisch & Krakowski, 2020). Although not as widely applied as automation, augmentation is also used in areas such as product innovation (Wilson & Daugherty, 2018). K. Christensen et al. (2017) worked with a text mining algorithm to source comments from external online communities and analyzed them based on users’ needs and proposals. The resulting algorithm was then used to filter possible ideas for product inno-vation and was evaluated by a knowledgeable manager (K. Christensen et al., 2017). Further, augmentation was determined to be beneficial for retailing in areas such as Customer Relation-ship Management and Supply Chain Management for supporting decisions like inventory planning or make-or-buy decisions (Min, 2010; Shankar, 2018).
In terms of competition, automation improves the speed of standardized processes and ensures greater information-processing, rationality, and consistency (Raisch & Krakowski, 2020). These attributes ultimately result in cost-efficiencies of an organization which are one building block of creating a competitive advantage through AI (Brynjolfsson & McAfee, 2014). In con-trast, augmentation necessitates constant human involvement and experimentation (Amershi et al., 2014). Hence, the managers involved in the augmentation process play a crucial role provid-ing the algorithm with their capabilities, intuition, and emotion. The resultprovid-ing outcome is based on a particular algorithm with human input which is nearly impossible to replicate (Holzinger, 2016). The contribution of augmentation to competition is increased productivity, a higher ex-tent of organizational learning, and fostering innovation (Brynjolfsson & McAfee, 2014; Davenport & Kirby, 2016; Wilson & Daugherty, 2018).
Although the differentiation between automation and augmentation is useful for understanding how AI can impact and benefit companies, in reality the two domains are highly interdependent
Literature Review 22
and intertwined (Raisch & Krakowski, 2020). For example, considering the aforementioned use of AI in the recruiting process of JP Morgan Chase. Although the algorithm automatically anal-yses an applicant’s profile, it was initially initiated by domain experts (Raisch & Krakowski, 2020). This process is unlikely to stop since the continuous changes in candidate requirements have to be implemented by managers working closely with the algorithm in order to make the model robust (Davenport & Kirby, 2016). Further, combining both paradigms might result in synergies which accrue in additional benefits, i.e. by freeing up resources through automation, augmentation might be enabled which could then be used to identify models for further auto-mation (Raisch & Krakowski, 2020). In fact, by applying both autoauto-mation and augmentation, organizations are enabled to combine machine rationality with human intuition and cognition which enables organizations for greater learning and adaptability (Calabretta et al., 2017; Raisch & Krakowski, 2020), as depicted in Figure 3.
Figure 3: Usage and Benefits of Artificial Intelligence in Business
Considering the benefits of AI to enhance the innovativeness of firms, such as in product inno-vation (K. Christensen et al., 2017), AI was also found to offer possibilities for BMI. A first advance in this domain undertook Ebel et al. (2016) by developing an IT-tool to support BM design including various stakeholders. Further, ML was utilized by Dellermann et al. (2018) to design a support system for entrepreneurs to evaluate and validate their BMs. Due to the capac-ity of AI to identify complex patterns, its scalabilcapac-ity, and its benefits for innovation, present work utilizes ML to facilitate the benchmarking of BMPs.
Methodology 23
2 Methodology
The purpose of present thesis is to illustrate the benefits of benchmarking to BMI and derive a ML supported tool to do so. Therefore, a novel theory building method which was first applied by Tidhar and Eisenhardt (2020) is adapted. The method is comprised of three steps: exploratory data analysis (EDA), multi-case theory building (MCTB), and machine learning. Chosen meth-odology suits the purpose of present work exceptionally well since the MCTB indicates possible opportunities for BMI which arise from differences in the employment of BMs by companies. The ML model is leveraged to support these findings and can ultimately be utilized for the resulting tool. To visualize the findings, a benchmarking framework is applied.
In order to evaluate BMs and make them comparable, present work utilizes the 55 BMPs which were developed for BMI by Gassmann et al. (2014). This extensive list allows for an accurate replication of BMs and is thereby particularly well suited for the task of benchmarking. An existing algorithm will be analyzed and evaluated in regard to its performance. Said algorithm was created to predict the 55 BMPs to companies based on aggregated company descriptions. Appendix I offers a short explanation of each BMP; more elaborate descriptions can be found in Gassmann et al.'s, (2014) book ‘The Business Model Navigator’.
The exploratory data analysis investigates the original dataset (OD) of 256 firms for which previously mentioned algorithm predicted the BMPs based on their annual reports. To uncover shortcomings and achieve a more accurate understanding of the firms, the dataset was re-eval-uated and BMPs allocated by the researcher. The findings of the EDA are elaborated and guide the theoretical sampling of the MCTB. Hereby, an additional 50 firms were evaluated and BMPs assigned based on primary and secondary data. To understand if there are differences in the utilization of BMs, the datasets were contrasted based on their industry affiliation. Further, the aforementioned algorithm was improved through different experiments in order to predict BMPs to the S&P 500 constituents. This dataset is then used to gain further insights for the MCTB. Lastly, a benchmarking framework was utilized for an academically grounded approach to compare and evaluate companies which eventually results in the conception of the BM bench-marking tool.
Methodology 24
2.1 Exploratory Data Analysis
The goal of the EDA is to comprehend the given dataset and discover patterns within it (Behrens, 1997). In order to do so, the data is often investigated visually (Tidhar & Eisenhardt, 2020). The process of EDA begins with an investigation through generic categories, breaking them down into sub-categories by defining dimensions along the process until a certain granu-larity is achieved (Behrens, 1997; Tidhar & Eisenhardt, 2020). Present work will start the EDA by analyzing the dataset which was generated by the previously developed algorithm. Descrip-tive statistics will be used to understand the data and achieve a first comprehension.
The original algorithm was trained and tested upon a hand-picked dataset of 44 firms which were chosen to represent all 55 BMPs defined by Gassmann et al (2014). After training and testing, the algorithm was then applied to 256 firms to predict BMPs and complement the BMI process. Thus, for starters, the EDA will be based on the dataset of 256 firms to which the algorithm predicted the BMPs. All firms within the dataset are public and based in the United States.
On average, 7.68 (SD = 2.49) BMPs were predicted for each company, resulting in 1967 BMPs in total. The company to which the most BMPs were predicted to was Adobe Inc with 16 BMPs. In contrast, the companies with only two and therefore least allocated BMPs were Honeywell International Inc. and Rollins Inc. The BMPs which were detected the most were Layer Player (239), Solution Provider (216), and Customer Loyalty (204). The 14 BMPs which were not identifiable were: Add-On, Affiliation, Aikido, Barter, Crowdfunding, Fractional Ownership,
Lock-In, Pay per Use, Pay What You Want, Razor and Blade, Robin Hood, Trash to Cash, User Design, and White Label.
In order to get a first overview of the predicted BMPs, the overall count of allocated patterns is plotted in Figure 4. It can be seen that the algorithm has a strong tendency of predicting some BMPs more often than others. This indicates that the algorithm is biased and skewed.
Methodology 25
Figure 4: Count of Predicted BMPs by Original ML Model
Zooming in on the ten most predicted BMPs, the dominance of some becomes even more ob-vious. The three aforementioned BMPs with more than 200 allocations dominate Figure 5. However, the patterns Target the Poor and Franchising are nearly as dominant with 174 and 166 allocations respectively. Accumulated, the top five most detected BMPs represent more than 51% of all allocated patterns.
Figure 5: Top Ten Most Predicted BMPs by Original ML Model
Considering the existence of extreme outliers with five BMPs accounting for more than 51% and 14 BMPs not being allocated at all raises doubts on the accuracy of the algorithm.
When evaluating an algorithm which allocates subjects to a given category, its accuracy is used to determine its performance. Thereby, confusion matrices are created as depicted in Figure 6.
0 50 100 150 200 250 No . o f d etec ted B MP s
Business Model Patterns
239 216 204 174 166 120 97 91 61 61 0 50 100 150 200 250 No . o f d etec ted B MP s Layer Player Solution Provider Customer Loyalty Franchising Target the Poor Open Business Digitization Orchestrator Direct Selling
Methodology 26
Based on the correctly and falsely predicted responses, the accuracy measures precision and
recall can be calculated as follows (Han et al., 2012):
1) 𝑃𝑟𝑒𝑐𝑖𝑠𝑖𝑜𝑛 = 𝑇𝑟𝑢𝑒 𝑃𝑜𝑠𝑖𝑡𝑖𝑣𝑒𝑠
𝑇𝑟𝑢𝑒 𝑃𝑜𝑠𝑖𝑡𝑖𝑣𝑒𝑠+𝐹𝑎𝑙𝑠𝑒 𝑃𝑜𝑠𝑖𝑡𝑖𝑣𝑒𝑠
2) 𝑅𝑒𝑐𝑎𝑙𝑙 = 𝑇𝑟𝑢𝑒 𝑃𝑜𝑠𝑖𝑡𝑖𝑣𝑒𝑠
𝑇𝑟𝑢𝑒 𝑃𝑜𝑠𝑖𝑡𝑖𝑣𝑒𝑠+ 𝐹𝑎𝑙𝑠𝑒 𝑁𝑒𝑔𝑎𝑡𝑖𝑣𝑒𝑠
Whereas precision stipulates a measure of exactness, recall is a measure for completeness (Han et al., 2012). For instance, precision measures what percentage of positive labelled instances are actually positive, whereas recall measures what percentage of positively labelled instances were labelled as such (Han et al., 2012). Since using one measure isolated can result in an inaccurate model (Han et al., 2012), it is useful to combine them into the F1-Score:
3) 𝐹1 = 2 ×𝑝𝑟𝑒𝑐𝑖𝑠𝑖𝑜𝑛 ×𝑟𝑒𝑐𝑎𝑙𝑙
𝑝𝑟𝑒𝑐𝑖𝑠𝑖𝑜𝑛+𝑟𝑒𝑐𝑎𝑙𝑙
The F1-Score is used since it balances the trade-off between precision and recall and represents
a measure to create a balanced classification model (Han et al., 2012). The results of the training and testing of the original ML model are included in Appendix II. These show that some BMPs such as Digitization have relatively high scores (F1 = 0.91) meaning that on average, the
pre-diction of this BMP is in nine out of ten cases correct. However, calculating the average F1
-score for the model reveals an accuracy of F1 = 0.46 when omitting the BMPs which were not
able to be allocated. Thus, the overall accuracy of the algorithm is on average worse than chance for predicting 41 BMPs. This requests a re-evaluation of the companies to gain valuable in-sights.
Methodology 27
In order to balance the inaccuracy and understand the distribution of BMPs across companies and industries better, the whole dataset was re-evaluated by the researchers based on the com-pany’s descriptions. In contrast to the allocation of the algorithm, the manual allocation resulted in 1485 total allocated patterns, implying an average allocation of BMPs of 5.80 per company (SD = 2.94). Thus, on average, there were 1.88 less BMPs determined per firm in the sample. The two companies with the most assigned patterns were Microsoft (19) and Alphabet (18). Conversely, the firms with the least allocated patterns were Marathon Oil, and Pioneer Natural Resources Inc, both with one allocated BMP. The most assigned BMPs were Solution Provider (164), Digitization (108), and Affiliation (95). In the dataset of manually allocated BMPs
Crowdfunding, Pay What You Want, Razor and Blade, and Robin Hood were found to be not
employed.
As a first step, the relationship between the usage of total BMPs by a company is plotted against its market value. As it can be seen in Figure 7, there is a slight tendency of having an increased market value by employing more BMPs. However, with Apple, Alphabet and Microsoft em-ploying twelve or more BMPs and being close or above a valuation of one trillion dollars, there are extreme outliers. Further, after investigating the dataset for OLS assumptions, too many observations would have been deleted, making the dataset not suitable for linear regression.
Figure 7: Relationship Between Number of BMPs and Market Value
In order to dissect the dataset, the distribution of BMPs across industries was examined. Re-search in BMI commonly distinguishes between BMs that are already applied in an industry,
Apple
Alphabet Microsoft
Methodology 28
BMs which are new to an industry but already employed in a different industry, and BMs which are entirely new or disruptive to an industry (Foss & Saebi, 2017). This gives rise to the as-sumption that BMPs vary across industries. Thus, the dataset was segmented according to the Global Industry Classification Standard (GICS) developed by MSCI.
The GICS classifies companies along four categories from eleven industry sectors (included in Figure 9) over industry groups and industries into 158 sub-industries. The GICS is acknowl-edged for various practical applications by, for example investment banks to classify industries, as well as its solid academic standing (Bhojraj et al., 2003; Kadan et al., 2012). Dissecting for industries suits the approach of present work since companies within an industry can be as-sumed to share certain characteristics. Thus, a difference in employed BMPs could indicate learning potential for firms regarding BMI. The fact that the two companies with the least allo-cated BMPs (Marathon Oil, and Pioneer Natural Resources Inc) are both part of the Oil, Gas & Consumable Fuels Industry (GICS: 101020) strengthens this assumption.
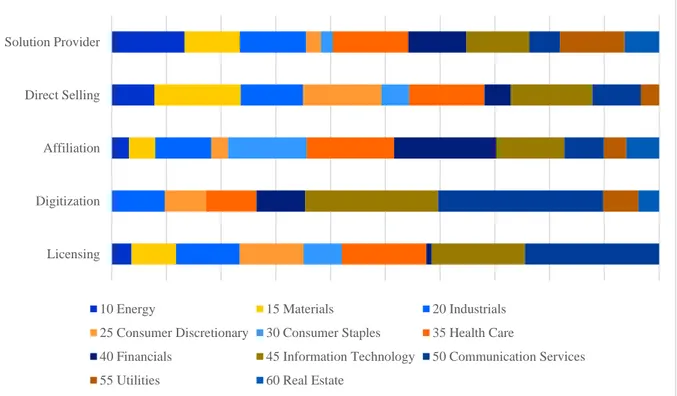
As can be seen in Figure 8, which illustrates the distribution of the five most detected BMPs for all industries, there are indeed differences in the utilization of BMPs across industries. One example from the depicted industry sectors will underline this conclusion and be reinforced by a brief evaluation of industry groups. A more comprehensive analysis is included in Appendix III. The BMPs Direct Selling and Affiliation both describe how firms deliver value. Whereas
Direct Selling refers to selling to the consumer without any intermediary, Affiliation refers to
the direct opposite, meaning selling to or buying from an intermediary. The firms within the industry sectors Materials (67%), Information Technology (63%), and Consumer Discretionary (61%) employ Direct Selling the most. Contrastingly, the firms within the Financials (65%), Health Care (56%), and Consumer Staples (50%) industry sectors are employing the BMP
Methodology 29
Figure 8: Proportional Distribution of BMPs Across Industries
Increasing granularity by investigating the 24 industry groups according to the GICS adds ad-ditional insights. For example, all insurance companies within the sample (n = 14) utilize the
Affiliation BMP, whereas only 21% employed the BMP Direct Selling. Further, 85% of the 13
firms within the Pharmaceuticals, Biotechnology and Life Sciences Industry group used
Licens-ing as a BMP for value creation. Only the BMP Make More of It was used for value capture
within this industry group.
It was refrained from increasing granularity even further to the industry or sub-industry levels since the sample size would not allow for valuable insights. Combining the insights of the EDA yields several results to guide MCTB and the remainder of the methodology. First, the algorithm seems heavily biased due the overrepresentation and extreme outliers. Second, there seems to be a difference in the application of BMPs within different industries. Third, some BMPs seem to be less employed than others even within an industry. Lastly, the accuracy of the algorithm has to be improved in order to facilitate a benchmarking process based on a ML model.
Solution Provider
Direct Selling
Affiliation
Digitization
Licensing
10 Energy 15 Materials 20 Industrials
25 Consumer Discretionary 30 Consumer Staples 35 Health Care
40 Financials 45 Information Technology 50 Communication Services
Methodology 30
2.2 Multi-Case Theory Building
The purpose of present work’s application of MCTB is to draw on cases and investigate differ-ences within the application of BMPs across firms and industries. Such differdiffer-ences could potentially benefit the BMI process of firms. Therefore, present work follows Tidhar and Eisenhardt's (2020) adapted approach of using many “thin”2 and mostly cross-sectional cases rather than a few “thick” cases (Eisenhardt et al., 2016). The MCTB approach using many “thin” cases suits present work since the resulting tool will show a snapshot of the currently employed BMPs of considered companies. In contrast, using “thick” cases is usually utilized to understand processes (Tidhar & Eisenhardt, 2020). Additionally, the multiple “thin” cases contribute to the algorithm, serving as a dataset for testing and learning and thus building the groundwork for a possible improvement of the algorithm. Subsequently, 50 firms were chosen using theoretical sampling in order to build the theory and improve the algorithm based on them.
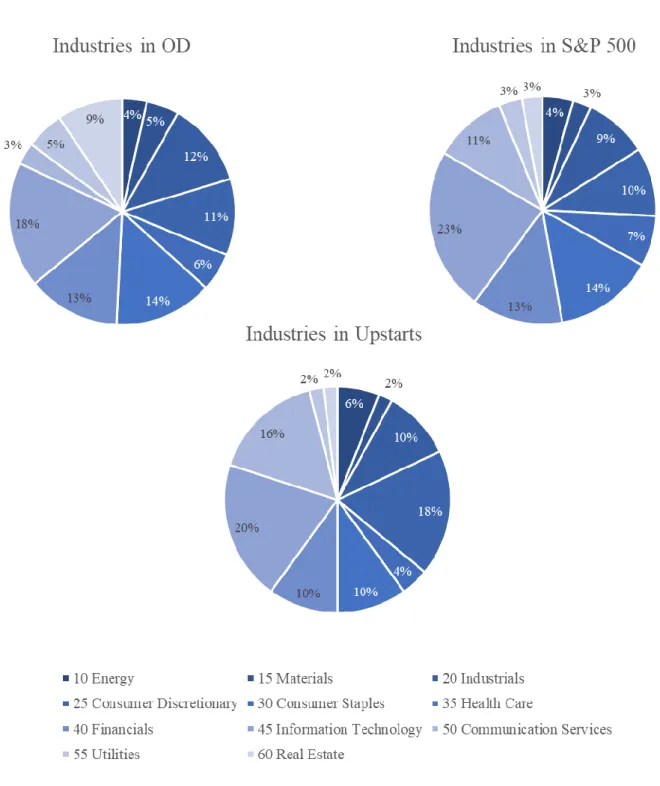
The insights of the EDA and the characteristics of the algorithm were relevant to determine the firms of the new dataset including 50 companies which are thereafter referred to as ‘upstarts’. First, the original dataset including 256 firms does not represent any index although all were based in the US. Since the final algorithm will predict the BMPs to the constituents of the S&P 500 index, 80% of the upstarts were chosen in order to resemble the distribution of industries within the S&P 500, as illustrated in Figure 9. Second, the remaining 20% were chosen to bal-ance the underrepresented BMPs. As illustrated earlier, some BMPs were over- or underrepresented. A significant amount of time was spent on identifying firms that employ un-derrepresented BMPs to improve the ability of the algorithm to allocate them. Lastly, in order to capture current trends in BM design, the selection of firms was limited to companies that were founded after the year 2000. To guarantee that sufficient and standardized information was available for each firm, and that the firms were relatively successful, the dataset for selec-tion was restricted to firms that went public. This dataset of firms was first assembled by Loughran & Ritter (2004) and continuously updated until March 20203. For further investiga-tion it was merged with a dataset including variables such as market value or GICS codes
2 Content focused cases which are snapshots of companies to a certain point in time and compared to usual cases,
rather short and less rich (Tidhar & Eisenhardt, 2020).
3 https://site.warrington.ufl.edu/ritter/files/2019/05/FoundingDates.pdf; Accessed: 4th of April, 2020, 10:30
Methodology 31
obtained from Wharton Research Data Services4. This concluded in a sample of 50 firms
founded after 2000 which went public until March 2020.
Figure 9: Distribution of Industries Within OD, S&P 500 and Upstarts Datasets
Since the cases are also used for training and testing the algorithm, the case-building was re-stricted to the specimen of the original ML model. Thus, the cases consist of multiple primary
Methodology 32
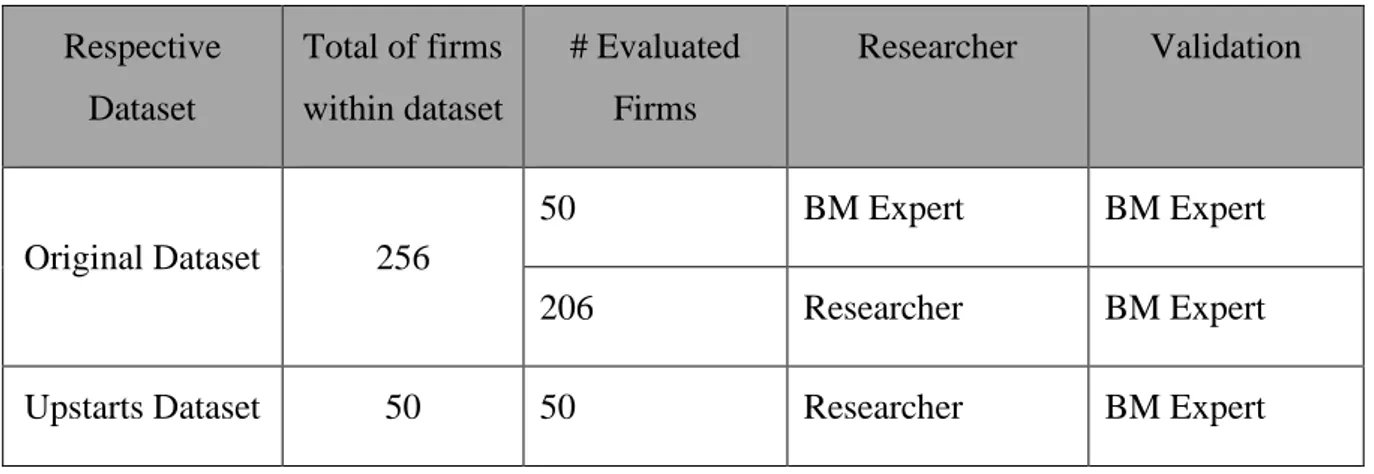
and secondary sources of company descriptions. Hereby, primary data was evaluated based on annual reports as well as company websites and complemented by the secondary sources of Bloomberg, D&B Hoovers, Crunchbase and Wikipedia. The evaluation distinguished between two categories. Category 1 denotes BMPs which were clearly assignable. Category 2 encom-passes BMPs which were borderline cases and assigned after a second consideration. The assigned BMPs were then evaluated and affirmed by a BM expert. The resulting allocation is illustrated in Appendix IV.
The within-case analysis was comprised of evaluating the upstarts and assigning the BMPs to them. Moreover, to understand the value activities of firms, a cross-case analysis was con-ducted. Additionally, to add more scale, the re-evaluated 256 firms of the OD were compared to the upstarts to gain insights in BMP employment. Table 1 provides a brief overview of the overall individual allocation of BMPs to companies to build the dataset.
Respective Dataset Total of firms within dataset # Evaluated Firms Researcher Validation Original Dataset 256 50 BM Expert BM Expert 206 Researcher BM Expert
Upstarts Dataset 50 50 Researcher BM Expert
Table 1: Split of BMP Allocation
2.3 Machine Learning Support for Theory Building
Machine learning is utilized in order to add scale to the findings. Although the application of ML for theory building is a new theme in research, it was deemed to be useful (Tidhar & Eisenhardt, 2020). In this specific case, ML is utilized to find patterns in qualitative data, e.g. company descriptions, in order to arrive at a function that is able to predict BMPs which are used by a given company. Therefore, an existing algorithm is utilized which was previously implemented. The ML model predicts BMPs which are employed by companies based on their description of doing business.
Methodology 33
Figure 10: Orignial Machine Learning Model5
As illustrated in Figure 10, the model comprises complementary unsupervised and supervised algorithms facilitating a promising approach to yield higher accuracy in comparison to the usage of a single algorithm. In total, three algorithms are employed within the model. BERT (Bidirec-tional Encoder Representations from Transformers) is an unsupervised algorithm that creates a contextual representation of whole sentences and used for text recognition (Devlin et al., 2018).
Word2vec is also a text recognition algorithm which creates contextual representations of words
within a given sentence (Mikolov, Chen, et al., 2013; Mikolov, Sutskever, et al., 2013). Prior mentioned algorithms are used for Natural Language Processing whose results are then for-warded to the supervised XGBoost (eXtreme Gradient Boosting) algorithm. XGBoost is a decision tree based supervised learning algorithm and employs gradient boosting which can be used for classification problems (Chen & Guestrin, 2016). Present works’ tasks of allocating BMPs to companies based on the company descriptions denotes a language recognition problem as well as a classification problem and thus, these algorithms are appropriate for the given task. As a supervised learning algorithm, XGBoost requires training with an appropriate – labelled – training dataset. Meaning in this particular case, company descriptions to which BMPs were assigned to. Additionally, to not confuse the algorithm, the provided training dataset should be forwarded in a standardized format. Thus, the company descriptions which were also utilized
5 Original illustration by Astl, (2019). Reshaping Business Modelling With Artificial Intelligence (Unpublished
Methodology 34
as cases were adapted to the design of the previously aggregated training dataset. The algorithm was then trained and tested in varying iterations using k-fold cross-validation which is a tech-nique that is widely applied in training and testing supervised learning models (Han et al. 2012). Thereby, the dataset was split into 90% of companies used for training the algorithm and 10% for testing. Each iteration yields a mean F1-score, the average of those scores denotes the overall
accuracy when predicting BMPs.
The original algorithm resulted in an average F1-score of 0.46, not being able to allocate 14 out
of 55 BMPs. Thus, in order to increase the average F1-score, four experiments were conducted
in collaboration with a ML expert.
Experiment 1 was built upon the original algorithm using the company descriptions collected
by the previous researcher. Increasing the number of observations within a training and testing dataset has often proven to increase the accuracy of prediction. Hence, a second and larger dataset was utilized to further train and test the algorithm. Hereby, the 256 manually allocated companies of the OD were used as labelled training data. However, the algorithm’s accuracy did not increase. Experiment 2 utilized the 44 company descriptions of the previous researcher in combination with the 50 similarly compiled company descriptions of upstarts, compiled by the current researcher. To balance inefficiencies of the previous algorithm, Experiment 2 did not utilize the previous model but set up a new one solely based on the resulting 94 company descriptions. Experiment 3 was built upon the resulting algorithm and additionally used a backreferencing technique. Hereby, the researcher referenced where the information of a BMP was included within the compiled company description. Therefore, the company descriptions were able to be subset which reduced the characters for the description of a BMP to be recog-nized by the algorithm. For the last experiment, solely the dataset of the researcher was used to account for bias in labelling. The iterative process and results are illustrated in the findings.
2.4 Benchmarking Processes
As elaborated in the literature review, the benchmarking process resembles the process of con-sidering external factors and monitoring other companies for BMI. In order to benchmark BMs of companies, present study draws on the proposed framework from Wolfram Cox et al. (1997). It articulates a comprehensive guide for conducting a benchmarking project, illustrated in Fig-ure 11. The model consists of five key components for interorganizational benchmarking and was chosen due to its theoretical grounding and its translatability into a practical context.
Methodology 35
Figure 11: Model for Conception of a Benchmarking Project
Reprinted from Wolfram Cox et al., 1997, p. 298
The Benchmarking Context determines the degree of competition or collaboration (Wolfram Cox et al., 1997). Structural factors describe the interdependence between companies and rather static characteristics. Hereby, present work relies on the S&P 500 dataset which limits the com-panies to the US and the extent of their interdependence to their industries. Dynamic factors describe the ‘nature and primary motivation’ (Wolfram Cox et al., 1997, p. 298) of the bench-marking process. Due to previously described relevance of BMPs to firm success, the primary motivation is rather competition based than cooperative.
Benchmarking Activities refer to the regarded processes which are either of strategic or
opera-tional nature. BMs are in general related to strategy, often described as its reflection (Casadesus-Masanell & Ricart, 2010). Although the 55 BMPs already reduce complexity, comprehending 55 BMPs is still difficult. Thus, the BMPs were aggregated according to the four meta-compo-nents value capture (VCap), value creation (VC), value delivery (VD), and value proposition (VP) used by Günzel & Holm (2013) and Remane et al. (2017), illustrated in Table 2.
The BMPs were categorized according to their descriptions by Gassmann et al. (2014). The categorization was then reaffirmed by the BM expert and is included in Appendix I. The cate-gorization by meta-components was chosen since they allow to gain insights in the value generating processes of firms and facilitate understanding the visualization of the final tool. Additionally, the meta-components allow for insights in how companies structure their process to address their customers.
Methodology 36
Table 2: Meta-Components for BMP Categorization
Reprinted from Remane et al, 2017, p. 5
The Benchmarking Partnership denotes the closeness of relationship between the benchmarked companies. In the present tool, these are determined by the industry relatedness of the GICS codes. Companies within the S&P 500 index are evaluated and visualized according to their respective industry. By doing so, users are enabled to distinguish the relationships between the firms in order to understand the relevance of the firm’s BMs. The Nature of the Benchmarking
Project refers to the extent of competition or collaboration between benchmarked companies.
As the tool includes different companies affiliated to a certain industry, the Nature of the
Bench-marking Project is competitive. This also corresponds to the intents of using the tool for BMI
or competitor monitoring. Lastly, the Objective and Perceived Outcome can be distinguished by the intent of using the tool, initiating business model innovation and complementing idea-tion.
Meta-Component Description
Value Proposition • Gives an overall view of a company’s bundle of products and services.
Value Creation • Key resources are the assets required to offer and deliver the previously described elements.
• Number of key activities performed by key resources. • Some activities are outsourced, and some resources are
acquired outside the enterprise.
Value Delivery • An organization serves one or several customer segments.
• Value propositions are delivered to customers through communication, distribution, and sales channels.
• Customer relationships are established and maintained with each customer segment.
Value Capture • Revenue streams result from value propositions successfully offered to customers.