A Work Project, presented as part of the requirements for the Award
of a Masters Degree in Management from the NOVA – School of
Business and Economics.
Strategy Development of Facility Management General
Contracting for Schlumberger Ltd.
Martin Engels
#1714
A Project carried out on the CEMS Master in International
Management course, under the supervision of:
Professor Fábio Santos - Nova School of Business and Economics
Andrey Panibratov - Graduate School of Management, St. Petersburg State University
Abstract
Strategy Development of Facility Management General Contracting for Schlumberger Ltd.
The project in cooperation with Schlumberger serves as part of the long-term vision of Schlumberger to reduce facility management suppliers at its locations in Russia and CIS countries. The goal is to reduce costs and increase transparency. To create a basis for this development, a supplier selection process was designed. Moreover, the market, potential suppliers as well as cost drivers were analysed. The outcome is a tested model that exhibits that a current reduction of facility management suppliers in Russia as planned by Schlumberger is not feasible. However, the model will be the basis for future evaluations of suppliers.
Table of Contents
1. Brief Context ... 4
a. Client ... 4
b. Market Overview ... 4
c. Current Client Situation ... 5
d. Business Project Challenge ... 5
2. Reflection on work done ... 6
a. Problem Definition ... 6
b. Methodology ... 6
i. Hypothesis ... 6
ii. Analysis ... 7
iii. Work Plan ... 19
c. Recommendations ... 20
d. Concerns ... 22
3. Reflection on Learning ... 22
a. Previous Knowledge ... 22
i. Masters content applied ... 22
ii. Masters content adjusted ... 23
b. New Knowledge ... 23
i. New Methodologies and Frameworks used ... 23
c. Personal Experience ... 24
i. Key strengths & weaknesses - insights from being in this project ... 24
ii. Plant to develop of your areas of improvement ... 25
d. Benefits of hindsight ... 25
4. References ... 26
Appendix I ... 29
1.
Brief Context
The following paragraphs will describe the client, the market, the current situation and the resulting business project challenge.
a. Client
The client Schlumberger Ltd. (SLB) was established in 1926 in France. Nowadays, Schlumberger is the biggest oilfield service provider worldwide. With around 120,000 employees in 85 countries, Schlumberger generated revenues of 48,580 million USD in 2014 (Schlumberger, 2015).
The company operates in the upstream sector of the oil and gas industry. This is commonly known as exploration and production (E&P). Schlumberger operates in all three big divisions of E&P namely, exploration and evaluation, drilling, and completion and production with the latter one generating the most revenues. Exploration and evaluation falls under Schlumberger’s brand name WesternGeco, which provides the largest seismic library worldwide and constantly develops technology that improves the tracking down of oil. Moreover, drilling and production include multiple activities allowing big oil companies like BP to extract and deliver oil to their customers. These activities can include the production of drills, test drilling, completion of a well and supplementary services such as security services.
b. Market Overview
As mentioned before the oilfield services market (OFS) consists of three big sections: Exploration and evaluation, drilling, and completion and production. The worldwide market generated a turnover of $152bn in 2012. This constitutes a 30% growth since 2005 (GBI Research Online, 2010). Around 50% of the revenue is earned in North America (OGN Online, 2015). Furthermore, the outlook for the market is positive as several researches suggest. GBI states a growth to around $213bn in 2017 whereas MarketsandMarkets Online is even more optimistic projecting a turnover of $291bn in 2019 (GBI Research Online, 2013) (MarketsandMarkets Online, nd).
Only a limited number of companies offer integrated services in all three divisions and the leading four have a combined market share of 75%. Next to Schlumberger, this includes its competitors Halliburton, Baker Hughes and Weatherford International.
Russia’s OFS market volume is around $25.5bn and has been growing 70% within five years (Interfax Global Energy Online, 2015). It is a significant market for Schlumberger as they generate 5-7% of their overall turnover in Russia (Bloomberg Business Online, 2014).
The industry is influenced by a set of trends such as increased R&D spending, consolidation and new regulations.
Increased R&D spending is a reaction towards the discovery of shale oil extraction or the reduced number of easily accessible oil fields. Hence, new technology that enables companies to extract shale oil or in very remote regions is needed.
Additionally, the industry has experienced consolidation and the latest acquisition of Halliburton and Baker Hughes is still pending. This trend is facilitated by the falling oil price in 2014 as well as consolidation in the upstream sector. (Pisani, 2014) (Sikich Online, 2013) Furthermore, a recent trend in several countries of issuing regulations concerning the use of local contractors has put pressure on international companies (Ahmed, 2010).
c. Current Client Situation
Currently, Schlumberger has 64 locations including offices, operations support centres, manufacturing centres, and educational or research centres in Russia, Kazakhstan, Uzbekistan, Turkmenistan, and Azerbaijan1. Some of the locations are in major cities such as Moscow or St. Petersburg, whereas others are on oilfields such as Verkhnechonsk or Vankor. Most locations are leased properties.
At these locations, around 200 suppliers provide Schlumberger with facility management services (FM). Facility management services include technical maintenance, catering, cleaning, security, waste management, reception and office supplies.
d. Business Project Challenge
The vast amount of suppliers results in a high number of transactions as well as interactions, which cost money. Additionally, services like cleaning are often provided by the landlord and included in the rental agreement. Hence, there is no cost transparency for Schlumberger. Consequently, Schlumberger’s long-term goal or vision is to significantly reduce the number of suppliers to less than five for Russia and the CIS countries. As in other countries, Schlumberger hopes the consolidation of the number of suppliers will greatly reduce costs. However, the requirements towards suppliers are very comprehensive in terms of geographic coverage and offered services.
Currently, Schlumberger is preparing tender for the FM services. In this context, Schlumberger seeks support in the preparation with this project.
2.
Reflection on work done
This chapter will define the problem and depict the methodology chosen to address the problem. After an extensive description of the analysis, it will outline the recommendations and concerns.
a. Problem Definition
As mentioned in the business project challenge, Schlumberger is targeting to immensely consolidate its FM suppliers. With this project Schlumberger attempts assistance in the pre-selection of suppliers. More specifically, the project objective were defined as three main parts:
- Market research on suppliers: Analysis of current and potential suppliers including evaluation of advantages and disadvantages, experience, geographic coverage and other factors.
- Supplier selection model development: Design of universal model and standardised process to analyse suppliers based on various factors (mentioned above).
- Cost driver analysis: Understanding the most influential cost components within the FM industry, what affects them as well as a future outlook for the driving forces. Other deliverables include a market overview and Porter’s Five Forces analysis. Derived from the above-mentioned, conclusions and recommendations were to be drawn up.
After the first meeting with the company, the scope of the analysis was defined and written down in a research proposal:
-‐ Geography: 64 locations in Russia and CIS countries
-‐ Services: Technical maintenance, Catering, Cleaning, Waste management, Security services, Reception services, Office supplies for Schlumberger locations.
b. Methodology i. Hypothesis
Based on the objective of the report as well as the objective for this project several hypotheses can be derived. The main hypothesis would be that a model could be developed to facilitate the reduction of the suppliers to less than five. This had several implications such as:
-‐ It is possible to reduce the number of suppliers to less than five -‐ The FM market exhibits a trend towards integrated services
ii. Analysis
Following the first meeting and the definition of the scope of the project, the research proposal also defined the methodology of the analysis. The basis of the project built an environment and industry analysis including:
1) PESTEL analysis
2) Market overview of OFS and FM industry 3) Competitors analysis of Schlumberger 4) Porter’s Five Forces for OFS and FM Moreover, a thorough literature review was conducted on:
5) Sourcing strategy 6) Supplier selection
7) Recent trends, uncertainties and risks
The next step was to develop the supplier evaluation model as well as the cost driver analysis. Based on the previous steps, a theoretical model was developed, which was then adapted to Schlumberger’s specifications. The model development consisted of several major steps:
8) Scorecard creation
9) RFI development
10) Evaluation of RFI results and secondary data 11) Adaptions to the scorecard and the RFI
The cost driver analysis (12) is based on literature as well as an additional short questionnaire to facility management suppliers. The outlook takes the PESTEL analysis into account.
1) PESTEL analysis. The PESTEL framework analyses the political, economic, social, technological, environmental, and legal situation. The political environment in Russia exhibits continuity with Putin as a strong leader. The government is strongly involved in business matters though corruption, protection of property rights, weak governance and lack of corporate transparency are threatening the business environment. Recent developments in Ukraine and resulted in tense relations between Russia and Western countries and future evolution is highly unpredictable.
Due to the sanctions as well as and the decline of the oil price, Russia’s economy has suffered strongly in recent time. The government’s budget decreased and the Ruble plummeted. Weaker domestic demand and low consumption slowed growth down. Combined with a growing inflation, Russia is expected to slide into a severe recession in 2015.
This crisis also endangers employment, which is low (5.9%) compared to European average (11.3%) but increasing (Eurostat, 2015). The Russian population with 144 million inhabitants mostly lives in the cities and experiences growth over last years despite the country struggling with high murder and suicide rates as well as alcohol-related issues and traffic accidents. (World Bank Online, 2015)
Concerning technology, Russia is especially influenced by the sanctions of the US and Europe as they focus on technology for the oil and gas sector, Russia’s most important industry. Companies like Schlumberger are hence directly affected by the sanctions.
The environmental factors play an increasing role for Russia. To pre-empt the bad reputation of the oil and gas industry, the Russian government implemented specific environmental protection acts requiring for impact assessment before granting green light for projects. Moreover, companies pay for the emissions they produce, similar to the EU emission-trading scheme.
Despite the already mentioned deficits like corruption, Russia has been among the top ten improvers of business regulation (The World Bank Group, 2014). Still, Russia exhibits a rather unstable business environment due to inconsistent application of law. This stems from rapid changes in the system after the decay of the Soviet Union. Nowadays, missing transparency and non-clear responsibilities can lead to power struggles of companies with the authorities. In case of oil and gas industry, many authorities are involved in the process of granting licences, taxation and more.
2) Market overview of OFS and FM industry. A market overview of the client’s industry as well as the facility management industry was written to familiarise ourselves with the sectors. The market for oilfield services was already described in chapter 1c. The worldwide facility management industry has a current volume of $24.7bn and is anticipated to grow to $43.7bn in 2019. This constitutes a CAGR of 12.1% with most growth stemming from North America and Europe (Markets&Markets, 2014). Facility management is a rather new and emerging market in Russia. Soviet legacy with self-sufficient industrial complexes and other factors caused the late development. Only recently FM has been evolving in Russia and even some international companies are already operating in Russia and CIS (Yegorov, 2011).
3) Competitors analysis of SLB. A competitor analysis complements the industry analysis and helps the understanding of SLB’s business. Schlumberger mainly competes with three international companies: Halliburton, Baker Hughes and Weatherford International. Schlumberger is the largest OFS company with $48bn revenues whereas the other three reveal $33bn, $24bn and $15bn respectively. As described before Halliburton attempts to acquire Baker Hughes, which would make them the biggest oilfield services company in the world. In the Russian market, SLB mostly competes with Russian companies, which hold more than 70% market share. Out of the international companies, SLB is the largest with 10.3% market share. (Financial Times Online, 2014)
Figure 1. Oilfield services sector market shares in Russia (Financial Times Online, 2014)
4) Porter’s Five Forces for OFS and FM. Porter’s Five Forces framework evaluates the competitive environment within an industry based on the bargaining power of suppliers, bargaining power of customers, threat of new entrants, threat of substitute products and competitive rivalry within the industry. Concerning the OFS, the bargaining power of suppliers is considered low due to SLB’s leading market position, the size of awarded contracts and because most input materials for production such as metal are based on commodity prices. The bargaining power of customers is deemed moderate. On one hand, the number of buyers is high with companies as BP, Exxon Mobil and local players and contracts feature long durations complicating switching of suppliers. On the other hand, some countries exhibit monopolies in the oil and gas sectors with single companies controlling extracting rights. The threat of new entrants is low due to high initial investments, proprietary technology, long-term contracts and economies of scale. Likely retaliation from existing players and importance of reputation and financial stability add to the other factors. Threat of substitute products is currently low. However, substitute might occur if the oil and gas
industry is superseded by renewable energies. The competitive rivalry within the industry is high as the previously mentioned international companies compete across all their divisions. Additionally, specialised companies challenge those companies in for example the exploration sector. High financial commitments and relatively low differentiation enhance competition even more.
Regarding the facility management industry, the bargaining power of suppliers is moderate. The number of suppliers of consumable such as detergents is high as is the number of potential buyers, which is not limited to FM companies. The bargaining power of customers can be considered as high as FM allows little differentiation and hence customers have little switching costs. Moreover, the volume of contracts and hence potential dependence of FM companies play a role. The threat of new entrants is also high as initial investment is low, the labour intensity of the industry limits economies of scale, and no specific proprietary knowledge is needed. The threat of substitute products is low, as no direct substitute exists. Overall, the competitive rivalry within the industry is moderate. On one hand, exit costs are low due to low initial investments and the market is growing as mentioned before. On the other hand, high fixed costs due to labour contracts pressure companies to gain contracts. Moreover, a segmented market with no clear market leader and low differentiation adds to this.
5) Sourcing Strategy. The literature review was investigating sourcing from an academic point of view. Sourcing has strategic impact for businesses. Hence, deciding on the right sourcing strategy has significant influence on the businesses’ success. Whether to outsource is a common decision for businesses. However, this make-or-buy decision should be based on thorough analysis. This decision process relates to various economic theories. The resource-based view (RBV) states that competitive advantage stems from within, from resources belonging to the company (Barney, 1991). To evaluate whether a specific resource or capability can create competitive advantage, one can apply the VRIO framework. It consists of questions regarding Value, Rarity, Imitability and Organisation. The resource-dependence theory (RDT) deals with external resources and stresses the importance of prioritising strategies related to critical and scarce resources (Pfeffer & Salancik, nd). Another theory of importance concerning Schlumberger is the core competency theory, which claims that core competencies can create competitive advantage and should be emphasised. Moreover, it defines the criteria of core competencies as “providing access to a wide variety of markets”, “making significant distribution to the perceived customer benefit”, and being “difficult to imitate” (Prahalad & Hamel, 1990). Activities not matching those criteria can be outsourced.
The transaction cost economics theory outlines the dimensions that affect transaction costs, which are assets specificity, potential disturbance during a transaction and the frequency of transactions. In case of low assets specificity, low uncertainty but high frequency, outsourcing is economically beneficial (Williamson, 1985).
In light of all mentioned theories, outsourcing of FM activities seems beneficial for SLB. FM activities are, according to VRIO framework, neither specifically valuable, rare, or difficult to imitate nor enable the company to capture value. Additionally, other external resources are more important for SLB and it does not constitute a core competency, as it does not fulfil any of the criteria. Furthermore, FM neither requires transaction specific assets, nor entails uncertainty, and is high in frequency and hence outsourcing is economically favourable. More generally, outsourcing itself exhibits several advantages and disadvantages (see figure 2). SLBs main problems in light of the Russian market can exhibit opportunistic behaviour and problems of enforcing contracts. However, it achieves the goals of cost savings as well as cost transparency.
Pros Cons
Maintenance strategy Focus on core competencies Need to manage opportunism Customer service Improved accountability Slower response
Financial impact Cost saving Increased contract cost
Internal processes Operational flexibility Loss of control Innovation and learning Access to special know-how Lack of staff training
Figure 2. Advantages and disadvantages of outsourcing (Hui & Tsang, 2004)
6) Supplier Selection. The supplier selection process plays an important role as the quality of suppliers greatly depends on the quality of this process. In order to develop a supplier selection process for SLB, the procedure was examined from a theoretical point of view. Normally, the process is divided in three steps: identifying, evaluating, and contracting suppliers (Beil, 2009).
Identifying suppliers entails multiple phases in which first the need and subsequently the key requirements and criteria are defined. These criteria can include quality of service, price, and financial strength. Next, the company needs whether to pursue a single sourcing strategy or wants to contract multiple suppliers and whether those should be national or international and for the short or long term. Single sourcing strategy minimises costs but increases the risk,
whereas multiple suppliers increase flexibility but also complexity. International suppliers can have scale advantages but national players can profit from local market knowledge. As last phases in the identification stage, the company collects information about suppliers. A tool to collect this data from companies is a request for information (RFI), a formal, written request aiming to collect comparable data.
The evaluation of suppliers is based on the RFI data using various methods. Often this involves scoring and weighting the suppliers by means of the criteria defined before. Models used include linear weighting models, total cost of ownership model, statistical models and mathematical programming models. The evaluation phase aims to create a shortlist of suppliers, which are then analysed in depth and asked to participate in a tender.
Lastly, one or more suppliers are contracted based on the previous selection process. After the contract is signed, the focus lies on supplier relationship management including performance management and development.
7) Recent trends, uncertainties and risks. FM exhibits various trends, which can be found in literature as well. These trends include:
-‐ Delivery of integrated FM solutions from a single service provider -‐ Internationalisation of clients and FM industry
-‐ Increasing awareness and focus on sustainability
-‐ Innovation of new solutions addressing changing needs such as not only managing waste but also offering solutions to reduce it. Moreover, innovation and improvement benefits client and supplier and hence positively impacts relationship, which in turn results in less fluctuation, more stability and continuity (Shaw, 2014) (Scupola, 2012). Despite the advantages, outsourcing also bears risk and uncertainty. Potential risk can stem from an agency dilemma, in which the agent (FM service provider) and principal (SLB) have 1) different interests, 2) different incentives, or 3) different information. This affirms the importance of the right supplier selection process. More specifically for FM, Atkin and Brooks (2009) recognise 19 potential risks:
• inadequately resourced or inexperienced client function;
• inadequate planning of the implementation – no analysis of implementation or allocation related responsibilities;
• misapplication of transfer of undertakings;
• conflicts of interest when dealing with in-house tenders;
• unclear or imprecise roles, responsibilities and targets for effective team working; • possible loss of control over the facilities management function and ownership of, and
access to documents and knowledge;
• Lack of standard forms of facilities management contracts or adequate condition of contract;
• Inappropriate allocation of risks and rewards between the client organization service providers;
• inadequate definition of the scope and content of services; • poorly controlled changes to user requirements;
• financial failure of chosen service provider during contract period; • lack of education and training in facilities management;
• fraud or irregularities in the award and management of contract; • excessive monitoring of contract performance;
• absence or poor system for providing incentives for performance; • poor bundling/grouping of activities to be outsourced;
• absence of share ownership of outcomes;
• poor cash-flow position for client organisations and for service providers and absence of benchmarks for cost and quality against which to measure performance and improvement.
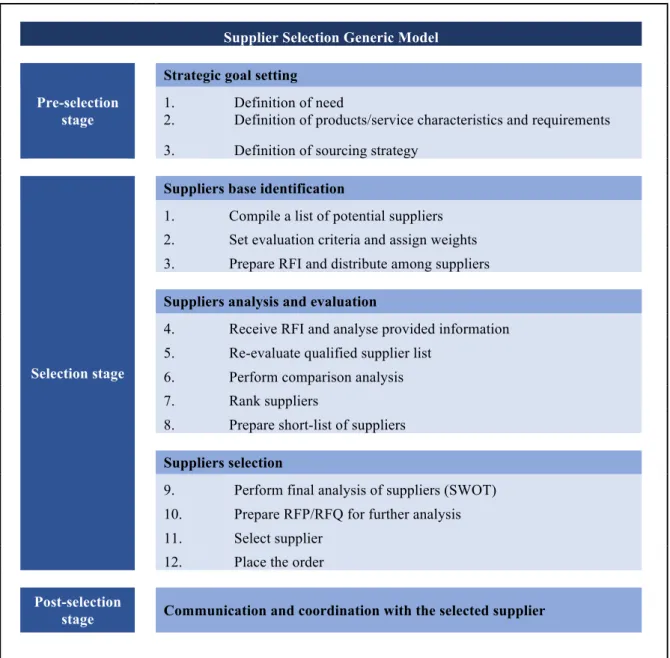
Based on the theoretical models, a supplier selection model for SLB was developed and applied. It divides in three broad stages each with a subset of tasks:
-‐ Pre-selection: Strategic goal setting for selection process
-‐ Selection: From identification of potential suppliers to a preferred supplier
Figure 3. Supplier selection model
In this case, the need for SLB is to reduce costs through a consolidation of suppliers, which in turn requires a standardised selection process. Moreover, the need for transparency also applies to the selection process. The services to be contracted and their characteristics are as follows:
-‐ Technical maintenance: Office premises, production bases, preventive maintenance and emergency repairs
-‐ Cleaning: Indoor and outdoor
-‐ Catering: Kitchen and canteen operation, food transport
-‐ Security: On-site and remote control, employee safety, theft protection, access control -‐ Waste management: Collection, transportation, common and special waste
Supplier Selection Generic Model
Pre-selection stage
Strategic goal setting
1. Definition of need
2. Definition of products/service characteristics and requirements
3. Definition of sourcing strategy
Selection stage
Suppliers base identification
1. Compile a list of potential suppliers
2. Set evaluation criteria and assign weights 3. Prepare RFI and distribute among suppliers
Suppliers analysis and evaluation
4. Receive RFI and analyse provided information
5. Re-evaluate qualified supplier list
6. Perform comparison analysis
7. Rank suppliers
8. Prepare short-list of suppliers
Suppliers selection
9. Perform final analysis of suppliers (SWOT)
10. Prepare RFP/RFQ for further analysis
11. Select supplier
12. Place the order
Post-selection
stage Communication and coordination with the selected supplier
-‐ Reception: Welcoming guests, customer service and access control
-‐ Office supplies: Procurement and distribution of expendable goods, managing stock on-site
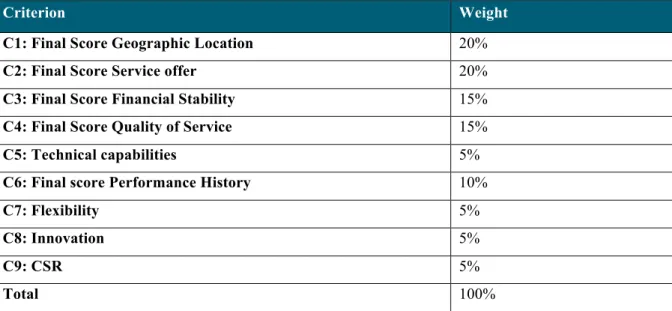
8) Scorecard creation. The selection stage is segmented in three steps: Supplier identification, supplier evaluation and supplier selection. The identification phase starts with the creation of an overview of potential suppliers. In this case, 52 potential suppliers on the Russian market and 14 international suppliers not yet present in Russia were identified. Subsequently, the evaluation criteria and weights were set in concordance with SLB:
C1. Geographic coverage
a. Matches with SLB locations (Moscow, St. Petersburg, Volgograd, CIS countries…)
C2. Service offer
a. Number of services covered (Technical maintenance, Cleaning, Catering and Security services, Reception, Waste management and Office supplies)
C3. Financial stability
a. Coefficient of variation of operating margin of last three years b. Debt-to-Equity ratio
c. Interest coverage ratio C4. Quality of service
a. ISO 9001 certification
b. Other certificates (OHSAS 18 001, national certificates) c. Quality control application or department
C5. Technical capabilities
a. ERP system or comparable system
b. Specific technical capabilities and technology C6. Performance history
a. Years in business
b. Main customers (references) c. Experience in oil and gas industry C7. Service capacity/flexibility
a. Number of employees
b. Share of temporary employment C8. Innovation
C9. Environmental and social responsibility
a. Certificates of compliance (ISO 14 001)
The results of the criteria and sub-attributes are normalised with 100 points given to the best performing company. Qualitative questions such as C5b are evaluated with a 3-level scoring with 100, 50, and 0 points for respectively outstanding, satisfactory, and unsatisfactory specific technical capabilities. The detailed evaluation can be found in Appendix I.
Figure 4. Weights assigned to criteria
9) RFI development. The RFI to collect information from suppliers was developed simultaneously with the scorecard to ensure the information needed can also be obtained. The focus was to create an easy-to-use form for suppliers requiring least possible effort from them. Moreover, the results should be objectively comparable and hence included as much quantitative data collection as possible. The design of the questionnaire enables SLB to quickly compare answers. Hence, it was divided into nine sections including general information, contact information, financial information, employee information, geographical and service information, performance history, quality of services, technical capabilities, and additional information. After the development, the RFI was translated and sent to the previously identified suppliers. Screenshots of the RFI can be seen in Appendix II.
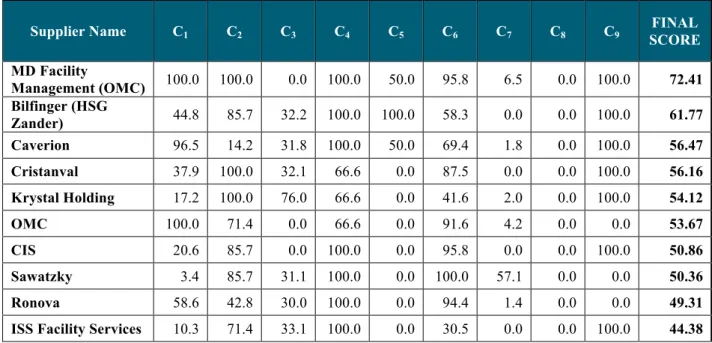
10) Evaluation of RFI results and secondary data. The received RFIs and the secondary data research from databases like Spark was combined to fill the model and evaluate the suppliers. Based on the information available nine suppliers could be excluded because they were not present at any of SLB’s locations or did not provide any of the services required. The remaining 43 suppliers were compared and ranked based on the defined scorecard, resulting in the shortlist shown below (figure 5).
Criterion Weight
C1: Final Score Geographic Location 20%
C2: Final Score Service offer 20%
C3: Final Score Financial Stability 15%
C4: Final Score Quality of Service 15%
C5: Technical capabilities 5%
C6: Final score Performance History 10%
C7: Flexibility 5%
C8: Innovation 5%
C9: CSR 5%
This shortlist is the basis to start the final selection process. A more in-depth analysis of suppliers is conducted starting with a SWOT of the five highest ranked suppliers. The strengths and weaknesses focus on the implications of their scorecard results in the various categories. Opportunities and threats were combined, as the external factors for all five companies are similar. Opportunities for all five companies include the advantage of Russia being an emerging market. Additionally, pressure for high quality standards require FM companies to continuously improve. Moreover, software and technology are already changing the FM industry and this change will spill over to local suppliers as well. Threats for FM suppliers in the Russian market still include regulations, bureaucracy and corruption. The size of Russia and poor infrastructure threaten the supply of services and complicate great geographic coverage.
After further evaluation of suppliers, RFP2 or RFQ3 are sent collect additional information
and invite suppliers for an offer. Afterwards, a supplier is selected.
During the post-selection process, the focus lies with continuously improving the cooperation, communicating and managing the relationship.
Figure 5. Results from supplier evaluation
2 RFP: Request for Proposal, request to suppliers about specific requirements and ability to fulfill those 3 RFQ: Request for Quote, request for offer after specifications are clear to supplier
Supplier Name C1 C2 C3 C4 C5 C6 C7 C8 C9 SCORE FINAL
MD Facility Management (OMC) 100.0 100.0 0.0 100.0 50.0 95.8 6.5 0.0 100.0 72.41 Bilfinger (HSG Zander) 44.8 85.7 32.2 100.0 100.0 58.3 0.0 0.0 100.0 61.77 Caverion 96.5 14.2 31.8 100.0 50.0 69.4 1.8 0.0 100.0 56.47 Cristanval 37.9 100.0 32.1 66.6 0.0 87.5 0.0 0.0 100.0 56.16 Krystal Holding 17.2 100.0 76.0 66.6 0.0 41.6 2.0 0.0 100.0 54.12 OMC 100.0 71.4 0.0 66.6 0.0 91.6 4.2 0.0 0.0 53.67 CIS 20.6 85.7 0.0 100.0 0.0 95.8 0.0 0.0 100.0 50.86 Sawatzky 3.4 85.7 31.1 100.0 0.0 100.0 57.1 0.0 0.0 50.36 Ronova 58.6 42.8 30.0 100.0 0.0 94.4 1.4 0.0 0.0 49.31
11) Adaptions to the scorecard and the RFI. After analysing the data the RFI was slightly adapted:
-‐ A question about revenue was changed due to feedback from a supplier that it is unclear. Now it includes a small table clearly indicating that the three last years have to be filled separately.
-‐ Collected data about revenues showed very high variations and hence, a question concerning the operating margin was added to the RFI. For this project, this data was collected from Spark.
-‐ After analysing the cost drivers, the question about specific technical capabilities was adapted to include “cleaning robots” as an example of such a capability.
-‐ Another qualitative question (C8a) was changed, now also asking for equipment instead of only technology.
12) Cost driver analysis. The analysis of cost components in the FM industry lays the basis to projecting price development. Research and information from suppliers identifies labour costs as the major cost factor with a share of 60-80%. The main driver of labour costs are direct labour hours, which depend on various factors such as the type of service and location. Within one service type, the cost can be determined by differing variables. For instance in cleaning, the amount of contamination or cleanliness specifications influence the labour hours needed to achieve the desired results.
Equipment and material costs can be divided into two categories including job-specific and general equipment or material. Depending on the category, costs are affected by different variables. For example the location and frequency of use determine if equipment is better stored on site and hence not available for ulterior use. Whereas size determines how much of consumables are needed, e.g. detergent.
Overhead costs constitute around 10-15% of total costs and can include rent, utilities, and also training. In labour-intensive industries overhead is allocated based on direct labour hours (Jackson & Sawyers, 2001). However, when going more into detail on specific services, machines hours might be used too (e.g. if facade cleaning is performed by a machine).
Companies charge a mark-up of around 10% according to company policy.
One supplier reported that contracting of third-party suppliers make up for 13-15% of contract cost. This includes the outsourcing of services outside the company’s scope to parties specialised, in this case elevator maintenance.
As staff is clearly the main indicator for costs, the development of wages plays an important role in terms of price development. In Russia, wages increased by 11.6% per year between 2008 and 2013. The economic crisis is expected to slow this growth but has negative impact on other cost drivers. The rising inflation will also affect utilities and rent, which impacts overhead costs. Between 2008 and 2013, utilities and rent already increase by 10.5% and 8.8% per year respectively. (Federal State Statistics Service Online, nd)
However, technological advancements have the potential to reduce the dependence on labour and actually decrease costs. Already used technology such as cleaning robots has direct impact on labour hours needed. Moreover, they enable FM companies to reduce use of water or consumables and can increase flexibility. Additionally, new solutions in mobile workforce management can increase the efficiency of staff allocation and organisation. Even one step further go recent developments in machine-to-machine (M2) technology. Using for instance small sensors that indicate empty soap dispensers or an imminent machine breakdown, which automatically result in work orders on mobile devices of the responsible people. This can move FM from predictive based on historical data to real-time data driven FM with increased responsiveness and efficient use of resources.
iii. Work Plan
After the project kick-off on 11.03.2015, the research proposal was written, which outlined the structured as well as time planning of the project. The main deadlines as well as meeting schedule was set during this meeting and can be seen in the figure below:
Figure 6. Project schedule
The initial work plan involved nine steps as shown in figure 7. It stated that responsibilities of certain parts and planned execution date. Starting with the project introduction, macro and industry analysis as well as literature review would be started in the first week. Subsequently, the methodology would be described. Afterwards, the supplier analysis would take place, which would be the basis of the parallel model development. Towards the end, a forecast of
factors influencing the model would be conducted. Concluding, recommendations would be derived from the findings.
Tasks March April May
Week 3 4 1 2 3 4 1 2 3 4 Project introduction Macro Analysis Industry Analysis Literature Review Methodology Supplier Analysis Model Development Forecast
Conclusions and Recommendations
Figure 7. Initial work plan
Regarding the initial work plan several changes were made during the cause of the project. Whereas the first steps were conducted as planned, the model development was changed to be done before the supplier analysis. In this way, the model could be confirmed with the RFI data and potentially adapted afterwards. Moreover, the forecast was divided into two parts. On one hand, a forecast of potential development of the FM industry in Russia based on a comparison with international suppliers. This proved the future viability of the model. On the other hand, a cost driver analysis including a forecast of the influencing variables such as wages. Conclusions and recommendations were made after the major part of the analysis was accomplished.
c. Recommendations
Based on the theoretical research as well as confirmed by analysis of foreign market trends, outsourcing was approved as the appropriate solution for FM services. However, analysis clearly showed the underdevelopment of the Russian FM market in an international comparison. Nevertheless, the Russian market exhibits features that substantiate a development towards Western standards such as ISO certification or use of standard processes.
The developed model, based on recent theoretical frameworks and adapted to specific SLB needs, has been tested on local and international suppliers. Despite the low response rate, one can confirm the validity of the model. Moreover, it forestalls future trends on the Russian market and hence, remains valuable.
The information from the RFI as well as secondary data research resulted in an extensive supplier evaluation. The outcome presents several top performing FM service provider. Notwithstanding, the results clearly indicate that a reduction to five suppliers or less for SLB’s 64 locations is not feasible at the moment. Most suppliers cover the big cities such as Moscow, St. Petersburg and Perm. If suppliers are present in smaller, more remote locations it is only a few. Moreover, we doubt if suppliers are interested in expanding their geographic coverage for three reasons:
-‐ Economies of scale are limited due to labour-intensity -‐ Russian and CIS market is geographically very dispersed -‐ Infrastructure is underdeveloped
These factors diminish the incentives for companies to cover wider areas of Russia and CIS. An integrated service offer across the whole area is very likely to result in higher costs. Hence, we recommend SLB to reconsider their goal to consolidate the number of suppliers at this point. SLB should rather segment the market in several regions and try to reduce the suppliers in those regions. In these regions, SLB should concentrate on the most promising suppliers and develop them for a long-term cooperation. If the various regions have different requirements, the model is easily adapted by changing the criteria, attributes or weights. Reconsidering the data quality, one has to be reminded that the scorecard is developed for the pre-selection of suppliers and hence, only serves to create a shortlist of suppliers. It standardises and optimises the process in order to deliver a first basis for further in-depth analysis. We have noticed the difference in quality between RFI responses and secondary data research. Hence, we are convinced that SLB will get better and more accurate results when it sends the RFI out under its name and logo.
The cost driver analysis clearly indicates factors that SLB should consider in their supplier search and evaluation. Especially, investment in R&D, technology and equipment can play a major role in prices in the next years.
Overall, we were able to provide a model that evaluates the potential consolidation of suppliers. Nonetheless, the current market situation in Russia does not offer the possibility to reduce the number of FM service providers to SLB’s goal. Cost savings and transparency gains can be achieved on a smaller scale in the various regions. Moreover, cost savings are feasible with innovative suppliers using newest technology.
d. Concerns
Limitations or concerns regarding the work can be mainly found in the validity of the results due to poor data quality. The low response rate to RFI of around 10% limited the amount of primary data. Data from websites and Spark database differed greatly in terms of detail. Hence, for instance no financial data could be retrieved for several companies. Consequently, the accuracy of results can be questioned to a certain extent. Normalisation of data such as interest coverage ratio loses value when the information exhibits extreme outliers due to unrealistic results.
However, the purpose of this model is to pre-select suppliers and despite the low answer rate from locally active suppliers, results from international suppliers have confirmed the model. The results also prove the future viability of the model as international suppliers, as expected, revealed consistent certification as well as use of advanced technology. In the young Russian FM market, those are not as common.
Moreover, the lack of native Russian speakers might have impeded engagement with the companies and hence influenced the quality of responses because it made more extensive research by e.g. calling suppliers impossible.
3.
Reflection on Learning
The subsequent chapter aims to reflect on applied and adjusted existing knowledge, new knowledge as well as personal experiences and hindsights from the project.
a. Previous Knowledge
i. Masters content applied
During the Business Project several frameworks, methods and models learned or used during the Nova Master in Management were applied. Next to common frameworks like SWOT, PESTEL and Porter’s Five Forces also other topics from Nova classes were useful, most specifically from Strategy I but also from Strategy II and Strategy in Global Markets.
As the project intensively dealt with sourcing strategy and related theories, several topics from Strategy I with Guido Maretto came up again. Specifically, the class about Make-or-buy decision was useful. However, in this case the typical advantages and disadvantages or make or buy did only apply in a limited way. An example is economies of scale, which is a reason to buy, but due to the labour intensity very limited in this service industry. This was also mentioned in the Strategy I class about Scale economies.
Moreover, the resource-based theory found application in the business project, being topic in multiple classes such as Family Business4, Strategy II5 or Strategy in Global Markets6 when dealing with competitive advantage. Whereas Mr. Almeida Costa, teacher of Strategy in Global Markets, explained a different approach in evaluating the mentioned resources, we used the VRIO approach, mentioned later in this chapter.
When evaluating the financial stability, I could refer to Statistics for Managers and in the end we used the coefficient of variation to evaluate the stability of the operating margin.
Besides hard skills acquired during the Masters, the frequent group projects and practical way of thinking helped me to contribute to the project. Project management skills as well as team player abilities were especially important in such a big project.
ii. Masters content adjusted
The business project did not require the adjustment of any previously acquired knowledge.
b. New Knowledge
i. New Methodologies and Frameworks used
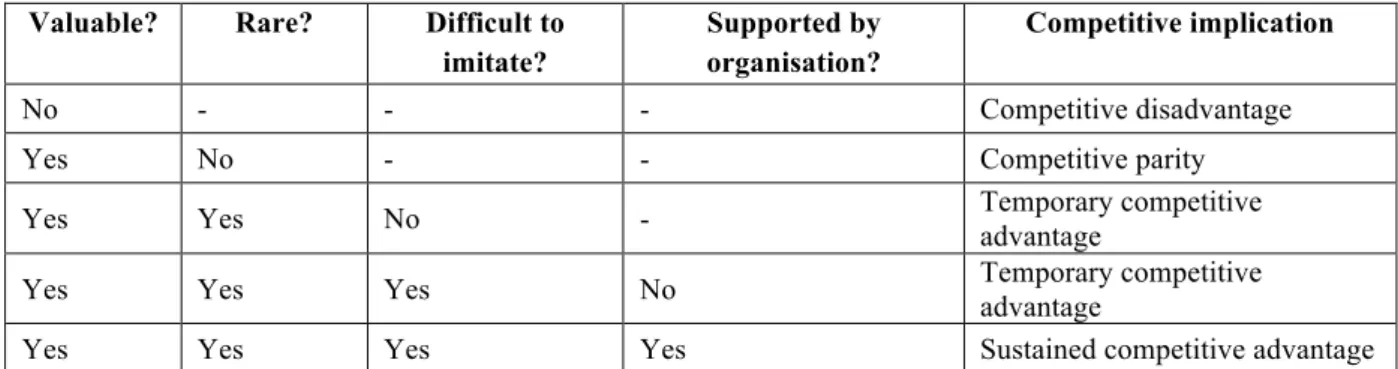
As mentioned before, a firm might have a competitive advantage due to its resources. A framework to analyse those resources or capabilities is VRIO, which stands for Valuable, Rare, costly to Imitate, Organised to capture value. The framework is applied by asking those four questions in the mentioned order. If the resource is not valuable, it constitutes a competitive disadvantage. In case it is valuable but not rare, competitive parity holds. If it is valuable and rare but not costly or difficult to imitate, it might give the company a temporary competitive advantage. The same counts for a valuable, rare, costly to imitate resource, which is not supported by the organisation. Only if all questions can be answered with yes, a sustained competitive advantage exists. (Strategic Management Insight Online, 2013)
4 Book: Ernest Poza (2010), Family Business, 3e, page 15 5 Course slides of João Silveira Lobo: Slide number 10
Figure 8. VRIO framework (Strategic Management Insight Online, 2013) c. Personal Experience
i. Key strengths & weaknesses - insights from being in this project
Previous experiences of mine have proved to help me a lot during this project and can be described as strengths considering this type of project. I already wrote my bachelor thesis for a Lufthansa in Turkey, which was challenging on multiple levels including language, business and work ethics, and culture. The experience in working with data and sources in a foreign language, I do not speak or read, helped me accommodating myself quickly and being able to efficiently conduct research and financial analyses. Moreover, I was aware of the potential pitfalls of working in a different culture with varied work ethics. I was able to avoid mistakes I did in the course of my bachelor thesis e.g. relying on the company for translations and instead using resources close to myself. Additionally, I pushed my team to be more insistent with requests towards the company.
Furthermore, my analytical abilities greatly contributed to designing the model. The development of an as objective as possible supplier evaluation method, involved the analysis of many potential attributes. I was responsible to come up with meaningful attributes that would serve the criteria important to the company. Moreover, data for these attributes had to be attainable from companies and other sources with the least possible effort as well as objectively measurable. Additionally, our team leader highlighted my analytical abilities when referring to the cost driver analysis.
On the other hand, I am aware that patience is one of my major weaknesses. I often catch myself getting impatient when I am dependent on other people, be it company representatives or team members. Especially in the face of deadlines, I may not be able to find the patience to help another team member; I rather finish those tasks myself then.
Valuable? Rare? Difficult to
imitate?
Supported by organisation?
Competitive implication
No - - - Competitive disadvantage
Yes No - - Competitive parity
Yes Yes No - Temporary competitive
advantage
Yes Yes Yes No Temporary competitive advantage
ii. Plant to develop of your areas of improvement
In the future, I try to work on my patience. I know that I can be patient, however, I need to remind myself constantly to stay calm. Moreover, I cannot constantly take over tasks from other group members, as it does not help them or me.
d. Benefits of hindsight
The project team was very heterogeneous, which had its advantages and disadvantages. Half of the team was really committed, always available for discussions and delivered on time, whereas the other half showed less effort. On one hand working with two highly motivated students from other top universities pushed me and I was able to learn from them. On the other hand, we should have pushed and engaged the other team members more. In the end, we might have missed the opportunity to get valuable input stemming from different standpoints or background.
Moreover, the commitment from the company seemed sometimes rather low. Requested material was sent only after a reminder if at all. After all, we also should have been even more persistent with the company in order to be able to create the most possible value for the company.
I am convinced that the model we developed adds value to Schlumberger’s supplier selection process as it combines simplicity with a thorough analysis through an integrated RFI, designed specifically to serve the model. Moreover, the company’s feedback mentioned that new interesting points were brought up, which Schlumberger will now investigate further.
4.
References
Ahmed, K. (2010, October 30). Ayman Asfari on Petrofac's road to Damascus. Retrieved
April 8, 2015, from
http://www.telegraph.co.uk/finance/newsbysector/energy/oilandgas/8096688/Ayman-Asfari-on-Petrofacs-road-to-Damascus.html
Atkin, & Brooks. (2009). Total Facilities Management, 3rd Edition. New York: Willey-Blackwell.
Barney. (1991). Firm resources and sustained competitive advantage,. Journal of Management, 17(1), 99-120.
Beil, D. (2009). Supplier Selection. Retrieved May 16, 2015, from http://www-personal.umich.edu/~dbeil/Supplier_Selection_Beil-EORMS.pdf
Bloomberg Business Online. (2014, August 12). Schlumberger Earnings Cut as Russian Sanctions to Spread. Retrieved from http://www.bloomberg.com/news/articles/2014-08-12/Schlumberger-sees-3q-earnings-impact-from-russian-sanctions-1-
Eurostat. (2015). Euro area unemployment rate at 11.3%. Retrieved May 16, 2015, from
http://ec.europa.eu/eurostat/documents/2995521/6764147/3-31032015-AP-EN.pdf/6e77d229-9c87-4671-9a52-b6450099597a
Federal State Statistics Service Online. (nd). Russia in Figures. Retrieved May 16, 2015, from http://www.gks.ru/wps/wcm/connect/rosstat_main/rosstat/en/main/
Financial Times Online. (2014, October 29). Russian oil: Between a rock and a hard place. Retrieved March 28, 2015, from http://www.ft.com/intl/cms/s/2/fc354a6a-5dcb-11e4-b7a2-00144feabdc0.html#axzz3VDBs2haA
GBI Research. (2010). The Future of the Oil Fields Services Industry to 2015 - Rebound in Exploration and Drilling Activity Drives Growth. Retrieved May 16, 2015, from http://www.investorideas.com/Research/PDFs/The_Future_of_the_Oil_Fields_Service s_Industry.pdf
GBI Research Online. (2013, February 27). Global Oilfield Services Industry to Top $200 Billion by 2017. Retrieved April 3, 2015, from http://www.gbiresearch.com/media-center/press-releases/global-oilfield-services-industry-to-top-200-billion-by-2017
Hui, & Tsang. (2004). Sourcing strategies of facilities management, . Journal of Quality in Management Engineering, 10(2), 85-92.
Interfax Global Energy Online. (2015, January 19). Challenging times for Russia’s oilfield services sector. Retrieved April 3, 2015, from
http://interfaxenergy.com/gasdaily/article/15037/challenging-times-for-russias-oilfield-services-sector
Jackson, S., & Sawyers, R. (2001). Managerial Accounting: A Focus on Decision Making. Markets&Markets Online. (nd). Oilfield Services Market worth $291.8 Billion by 2019.
Retrieved April 3, 2015, from
http://www.marketsandmarkets.com/PressReleases/oilfield-services.asp
Market&Markets Online (2014). Facility Management Market by Solutions (CAFM, IWMS, CMMS, BIM, IWMS) & Services - Worldwide Market Forecasts and Analysis (2014-2019) . Retrieved May 16, 2015, from http://www.marketsandmarkets.com/Market-Reports/facilities-management-market-1030.html
OGN Online. (2015). Well Services & Oilfield Equipments. Retrieved April 3, 2015, from http://www.oilandgasnewsonline.com/Article/37472/Oilfield_services_market_to_be_ worth_$2918bn_by_2019
Pfeffer, & Salancik. (n.d.). The External Control of Organisations: A Resource Dependency. New York: Harper and Row.
Pisani, B. (2014, November 13). Retrieved from http://www.cnbc.com/id/102184071
Prahalad, C. K., & Hamel, G. (1990). The core competence of the corporation. doi:10.1007/3-540-30763-X_14
Schlumberger. (2015). 2014 Annual report, 2-3.
Scupola. (2012). Managerial perception of service innovation in facility management organizations. Journals of Facilities Management, 10(3), 198-211.
Shaw. (2014). The role of innovation in improving supplier/client relationship, Business Services Growth Ltd.,– presentation. Retrieved May 16, 2015, from
Sikich Online. (2013, November 1). Oilfield Services Challenges. Retrieved April 8, 2015, from http://www.sikich.com/find-solution/industries/oilfield-services/oilfield-services-challenges
Strategic Management Insight Online. (2013). Retrieved May 16, 2015, from http://www.strategicmanagementinsight.com/tools/vrio.html
Williamson. (1985). The Economic Institutions of Capitalism. New York: Free Press.
World Bank Online. (2015). Country Profile: Russia. Retrieved March 28, 2015, from http://www.worldbank.org/en/country/russia
Yegorov, I. (2011). Facility Management Goes Russian. Retrieved May 16, 2015, from http://www.cfe.ru/en/resource_center/bulletin/issue953/945.htm
Appendix I
Appendix II
Screenshots of RFI in English