A Work Project, presented as part of the requirements for the Award of a Master Degree in Economics from the NOVA – School of Business and Economics.
The Hot Hand in Professional Darts
Hans Jasper Klimas
Student Number: 880
A Project carried out on the Master in Economics Program, under the
supervision of:
Professor Alexander Coutts
The Hot Hand in Professional Darts
Abstract
This paper examines whether a hot hand in professional darts exists or the people’s belief in players performing better after experiencing recent success is a fallacy. By the means of five hot hand statistics, tested in an individual and pooled player analysis, I have found substantial evidence for the existence of the hot hand for the great majority of players. Players hit more often after previous hits than misses, their throw outcomes are clustered and hit streaks appear more often and are longer than expected. Concluding from these results, the economic
relevance of the hot hand fallacy should be reconsidered.
1
1.
Introduction
On May 24, 2010, professional darts player Phil Taylor was the first person to hit two nine-dart finishes twice in a single game leading him to the win of the Darts Premier League 2010 (The Guardian, 2010). A nine-dart finish is the perfect leg in the game of darts using only 9 darts, the fewest possible, to checkout from 501 to zero. It is extremely difficult to achieve and is considered as the highest single-game achievement in the sports of darts. Two years later on December 30, 2012, the Dutch professional darts player Michael van Gerwen made darts history by consecutively throwing 17 perfect darts in the semi-final of the World Darts Championship nearly hitting 2 nine-dart finishes in a row (The Telegraph, 2012).
Beside this exceptional athletic performance it is also remarkable that during these plays the commentators talk of these players running hot, being streaky and commentators as well as the audience have the impression that “magical powers are released” (Professional Darts Corporation, 2014). These examples proof that people, in this case commentators, the audience and players, believe in the hot hand. This means that good outcomes tend to cluster. In other words, the chances of being successful at the next attempt increase with previous successful attempts. The belief in hot hands in sports is not an exception but rather a widespread belief. This is underscored by the findings of a hot hand survey conducted by Koeppen. In his survey 90 % of the respondents have a strong or very strong believe in hot hands in sports. Compared to other sports the belief in hot hands in darts is the 3rd strongest after basketball and volleyball (Koeppen, 2011).
However, according to the state of hot hand research for the last 30 years the described belief of commentators, spectators and even players of running hot tends to be a cognitive illusion. They believe that there is atypical clustering of success by making a cognitive mistake of inferring patterns in random data. This phenomenon was introduced in 1985 by Thomas Gilovich, Robert Vallone and Amos Tversky (henceforth GVT) as the Hot Hand Fallacy.
2
In my research, the first section provides an overview about the hot hand research for the past 30 years and analyzes limitations of previous research. Following this, the motives for the examination of the hot hand in darts are illustrated. After talking quickly about the relevance of the topic for other economic and financial issues, the third section presents the methodology. Information on the data and its collection are provided and an empirical strategy is developed on how to verify a hot hand in darts. In section four, I continue with information on the overall performance, before presenting the results of the in-depth individual analysis. It is followed by the results of the pooled analysis and the influence of skill, age and game time on the hot hand. In section 5, the results and its interpretation and implications are discussed and related to previous studies in other sports fields. Finally, limitations of my research as well as suggestions for future research are presented and an outlook is given, which particularly stresses the implications of my research for the broader scientific picture.
2.
Literature Review
In 1985 the GVT study examined basketball data of both field throws and free throws in the NBA and came to the conclusion that there was no evidence of a hot hand. Outcomes of throws were highly independent of the previous attempts and frequency of hit streaks did not exceed the frequency predicted by a constant hit rate (GVT). According to surveys, which revealed that 91 % of basketball fans, coaches and players believed in the hot hand, the GVT study described the belief in the hot hand as a massive cognitive illusion. This could lead to costly errors, because resources were shifted to players perceived as running hot (GVT, 1985). In 2003 Koehler and Conley examined four years of NBA shootout contests and found no evidence of the hot hand, which is in line with the GVT study.
A review of 20 years of hot hand research published in 2006 concluded that the “empirical evidence for the existence of the hot hand is considerably limited” (Bar-Eli, Avugos and Raab, 2006). In retrospect out of the last 30 years of hot hand research, most studies supported the
3
belief of the hot hand being a “massive and widespread cognitive illusion” (Kahnemann, 2011). Although the statistical methods and its execution in the original study by GVT were criticized by many researchers, there was only little to no evidence found for a possible hot hand. As Thale and Sunstein in 2008 summarized aptly: “Many researchers have been so sure that the original Gilovich results were wrong that they set out to find the hot hand. To date, no one has found it”.
In 2014 the prevailing scientific view on the hot hand being a fallacy was disrupted. A study by Miller and Sanjurjo identified limitations and biases in the original study and developed a new statistical testing procedure, which led to strong evidence of the hot hand in controlled shooting experiments in basketball. In 2010 already, Arkes found evidence of the hot hand in NBA basketball free throws by using a pooled analysis, while most previous studies only tested for the hot hand in an individual level framework. In 2015 Miller and Sanjurjo also found evidence of a hot hand in the controlled shooting data of the GVT study and for the data of the NBA Three-Point contest examined by Koehler and Conley. This happened by applying their new statistical testing procedure for the hot hand to the old data of these studies.
Although the new research revolutionized hot hand research and challenged the existence of the hot hand fallacy, there are also several limitations of the recent studies. Primarily, this is due to their experimental set-up and structure and due to limitations of the game basketball, which could bias hot hand research. Therefore it is required to take a closer look at these limitations. The Arkes study (2010) was limited to the pooled analysis, which raises two concerns. On the one hand, it is difficult to control for confounding factors such as ability, on the other hand, hot hand effects may cancel each other out if some players have the hot hand, while others do not have it. Furthermore, Green and Zwiebel (2015), who examined the hot hand in baseball, argued that in basketball defenses adapted to “hot” players by shifting resources towards them and that “hot” players took more difficult shots, an endogenous factor not considered by previous studies. Therefore Miller and Sanjurjo (2015) agreed that in-game
4
data could not provide correct evidence for a hot hand in basketball. But based on the results of controlled shooting experiments it is not possible to conclude that the hot hand exists in-game likewise, because external factors, not covered in controlled-shooting experiments, can influence and lead to hot hand effects as well. This makes these studies imperfect for proving the existence of the hot hand in reality.
However in darts, the limitations of conducting hot hand research in basketball can be minimized, which makes darts more adequate for the hot hand analysis. In darts each throw is a random event having the same difficulty and same scoring chance. In comparison to basketball the influence of external factors is substantially less. Basketball is influenced by many external factors like defenses, coach decisions, tactics and different game sequences. Another advantage in contrast to basketball is that there are many more throws per game in darts. This leads to higher statistical power when detecting hot hand effects. As the skill of players changes over years, changing ability is an endogenous factor biasing hot hand research results. The endogenous factor of ability can be minimized in my analysis by setting a timeframe of one season, while still being able to analyze on an individual level due to the high amount of throws per game. In contrast, studies on basketball have the disadvantage that, due to a lower amount of data per player per game, they either take much longer timeframes of years or even decades into account or do a pooled analysis. This leads them to not being able to correct for either changing or different player ability, from which biases may occur.
While in basketball there are already a lot of studies examining the hot hand, there is no hot hand research in professional darts, although research shows that people strongly believe in a hot hand in darts (Koeppen, 2011). A study by Gilden and Wilson (1995) researched a hot hand in darts in controlled shooting experiments with volunteers, who were not used to play the game, finding no evidence of a hot hand or streakiness. A possible explanation for not examining the hot hand in professional darts can be that darts is not popular in the United States and also only gained greater popularity in Europe and Australia over the last years. Therefore
5
the detailed data on professional darts provided by the Professional Darts Corporation is relatively recent.
Through the new findings of Miller and Sanjurjo (2014,2015), the existence of the hot hand fallacy to date is heavily challenged in the scientific discourse in behavioral economics, so it can be of high scientific interest to look deeper into a possible hot hand in sports and other domains, including financial markets, sports wagering and lotteries. As to date research has mostly focused on basketball and those results have several limitations, this study on a possible hot hand in professional darts, a sport in which spectators also have a strong belief in the hot hand, can contribute to solving the question whether a hot hand exists or it is a fallacy to believe in.
If there is evidence of a hot hand in darts, it may indicate that hot hand effects are also plausible in other contexts, e.g. in other sports or broader economic issues and financial markets theories. Applied to financial market theories, e.g. the hypothesis that traders and investors overestimate the autocorrelation of recent series and therefore make mistakes (Offerman & Sonnemans, 2004) or the tendency of consumers to buy past winners and sell past losers in the stock market (Johnson, Tellis & Macinnis, 2005), both based on the belief in the hot hand being a fallacy, can be undermined by the existence of hot hand effects.
3.
Methodology
In this section, first the nature and characteristics of the data and how data is collected are described. Next, the empirical strategy is explained, where I provide details on how streaks are defined in this study and how these will be utilized to check for the hot hand. Finally, I describe which statistics and tests are used to detect evidence of the hot hand.
3.1 Data
The Professional Darts Corporation publishes detailed data on all the main professional darts tournaments in collaboration with their data provider Sportsradar. Beside results and wide
6
statistics of different tournaments, games and players, also a timeline showing the exact sequence of all throws made during a game is published on their website live.dartsdata.com. The data on all sequences of throws by players will be used in this study to examine whether a hot hand in professional darts exists. For my analysis, data on professional tournaments and games during the 2016 season starting from March 2016 until September 2016 is used. The data is seasonal and therefore from a relatively small timeframe compared to other studies, as hot hand results can be biased by changing ability over longer timeframes (Green, 2015). The data compromises 24 tournaments, 75 different tournament stages, 200 different players, 469 different games and 125,864 total throws. Beside data on tournaments, tournament stage, players and their sequences of throws, also data on the opponents, number of legs played, time played, 3 darts-average, number of perfect set of throws (3 consecutive Triple 20), current scores and the age of the players was collected.
By means of a web scraping program this data was extracted by the author for the given timeframe from the webpage, revised and transformed for use with Stata.
To understand the data, it is essential to take a closer look at the game darts and how it works. Standing 2.37m away from the dartboard each player has always 3 throws, called a set of throws, before it is the opponents turn again. The goal of each player is to reduce their score faster from 501 to zero than the opponent, in order to win a leg. The whole game, depending on the kind of tournament, consists of between 4 and 30 legs with around 12 legs on average. Trying to finish as fast as possible, players aim to hit the highest possible scores with each throw.
After an in-depth-analysis of the aims of players and impressions of commentators and players, the different scores can be clustered into hits and misses. All the scores above 50 are considered as a hit, including Triple 20, Triple 19, Triple 18, Triple 17 and Bullseye, at which Triple 20 is by far the most common throw with 28.5 % of all throws, while the other score possibilities only represent less than 7 % together. Although the other throw options are targeted
7
relatively rarely, they are considered as a score, because in several cases the Triple 20 can be blocked, whereby players have to switch to one of these other targets.
Another special situation occurs if scores are lower than 60. If this is the case, the intention to score the highest possible score switches to the intention to checkout and reach exactly zero. Therefore these last shots of each leg are excluded from the analysis as they would decrease the hit percentage and would bias a possible hot hand.
After categorizing the data and excluding special cases, the data consists out of 44,231 hits and 81,571 misses, representing an overall average hit rate of 35.19 %.
3.2 Empirical Strategy
To detect whether a hot hand in professional darts exists, my empirical approach uses both hot hand statistics applied in the GVT study (1986) and the recent Miller & Sanjurjo studies (2014, 2015). Although GVT and Miller & Sanjurjo use partly the same data, they come to contradictory results and conclusions due to a different empirical approach and the use of partly different hot hand statistics. Thus my analysis will be comprehensive as it combines both the hot hand statistics of GVT and Miller & Sanjurjo. By subjecting the data to a greater variety of statistical testing procedures, results which are consistent with the hot hand hypothesis would present robust evidence in favor of a hot hand in professional darts.
There are basically two main theories regarding why a hot hand may appear. On the one hand, the player can be shifted to a relatively higher performance state due to external factors (e.g. crowd support) making the player perform better (e.g. more focus or concentration). On the other hand, the player can perform better due to the recent success and internal factors (e.g. building more confidence). Recently successful performance can also lead to a learning process of the player perfecting his stance or throw movement. No matter whether it is only one or a mixture of these reasons, it is expected that hot hand throwing leads to a clustering of hits. Based on this, this study uses five different hot hand statistics functioning as possible hot hand
8
identifiers, which were also used respectively in the GVT or Miller & Sanjurjo study as well as in the majority of other hot hand research.
The first concept is the conditional probability test, which compares the hit rate for each player after k hits with k misses, whereby k= 1 or 2. It states if players hit a higher percentage of their next throw after they hit than after they missed the last or last two shots. It was used in the GTV study but not in the Miller & Sanjurjo study.
The second concept is the Wald-Wolfowitz runs test, which tests for clustering in the throw outcomes. The runs test counts the total number of runs for both hits and misses together and compares it to the expected number of runs a player with a constant hitting probability (Bernoulli Thrower) would have. If there is a presence of a hot hand, there will be fewer runs than expected under the Bernoulli null hypothesis, as hits and misses are clustered and therefore do not alternate that often. The runs test is commonly used in the hot hand research and is applied by both GTV and Miller & Sanjurjo.
For the other three concepts, which were newly defined by Miller & Sanjurjo, it is essential at first to define a streak as streaks are a key parameter in these concepts. A streak is defined as a sequence of k consecutive hits. According to previous hot hand research and the intuition that streaks begin generally with the 3rd successive event, I set k=3 (Carlson and Shu, 2007).
The third concept states how often a player is on a streak. The hit streak frequency statistic is defined by the relative frequency of throws that follow a streak of 3 hits,
HF :=
| || |
(1)
whereby SH is the number of throws following a streak and S is the total number of throws per player. For the analysis the hit streak frequency statistic is compared with the expected hit streak frequency, a player with a constant hit rate would be expected to have.
9
The fourth concept, called the hit streak momentum statistic, measures the hit percentage of the throw after experiencing a streak. It is the same as the conditional probability test with k=3 hits and will be compared to the average hit percentage of the particular player.
∶=
∑ ∈
|
|
(2)
The fifth concept, called hit length statistic, states the length of the player’s most exceptional hot streak. It measures the duration of the longest streak of consecutive hits of each player and will be compared to the expected longest streak of hits a player with a constant hit rate would have.
∶=
|
|
(3)
Generally speaking the test procedure of the hot hand statistics is to compare them with the null hypothesis of a player’s throwing performance being a sequence of independent and identically distributed Bernoulli trials with a fixed probability of success. If the hot hand statistics exceed their expected values significantly, evidence is provided for the existence of the hot hand effect. The hot hand statistics will be analyzed both on an individual level and in a general pooled analysis. Furthermore, a pooled analysis based on ability is conducted, in which players are categorized by different skill levels (low-, mid- and high-skill) and in addition the influences of the variables age and game time on the hot hand effect are examined.
4.
Results
First, an overview about the overall performance of players is given. After that a detailed analysis of the hot hand on the individual level follows, before a pooled analysis providing average effects is done. In another part of the pooled analysis the influence of different skill levels, ages and lengths of games on the hot hand effect are evaluated.
10 4.1 Overall-Performance
The pooled average hit percentage of all players was 35.19 %, with Scott Mackenzie having the lowest hit percentage of 13.53 % and Michael van Gerwen the highest with 42.49 %. The median of the hit percentage is 35.96 % and the first quartile is 32.48%, while the third quartile is 38.23 %, which shows that most of the players are on a very similar average skill level having similar average scores. The standard deviation of 5 % confirms that. Players tend to perform slightly weaker on their first throw (average score of a 31.6) than on the second and third throw, which have an average score of 32.9. The average number of throws taken per player is 630, with Nandor Bezzeg and Wenge Zie having the least throws taken (66) and Michael van Gerwen having the most throws taken (8700).
The standard deviation between players is with 1200 throws relatively large, which means that the number of observations per player differs highly, e.g. the data consists of 8700 throws made by van Gerwen, while there are 24 players with data of less than 100 throws. Considering this, in the individual analysis I present distributional outcomes of the hot hand statistics and enlarge on these distributional outcomes for players with more than 500 throws. I specifically focus on a selection of players, consisting of players with 5000 or more observations, as the noise regarding the performance of a player decreases with increasing number of throws. In this presentation of specific players also players with noticeable characteristics and results are emphasized to illustrate particular effects in the data record. However, in the pooled analysis I include all players in my analysis independent of the number of throws.
4.2 Individual Analysis
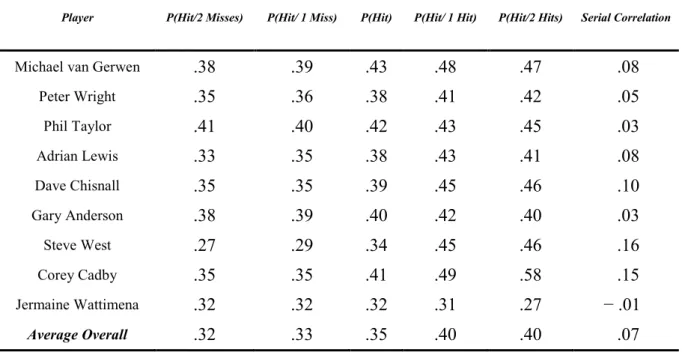
The first concept I look at is the conditional probability test, which states how players perform after k hits or misses. Table 1 shows selected players’ conditional probabilities of hitting a score after two misses (Column 2), one miss (Column 3), one hit (Column 5), two hits (Column 6) and their general hit percentage (Column 4) as well as the serial correlation in the players’
11
throwing sequence (Column 7). In compliance with the described criteria, the first six players represent players with more than 5000 observations, while the three others were chosen due to particularly extreme outcomes.
On average, players perform about 7 % better if their last throw was a hit compared to a miss, whereas the highest difference is a 23.5 % higher and the lowest difference a 14 % worse hitting percentage. The analysis shows that around 75 % of all players, which represents 150 out of 200 players, perform better after they have hit their last shot compared to after they have missed their last shot. Of the 20 % performing worse only three players have more than 500 throws, so these negative results could be due to variance in the low sample size. Therefore, considering players with more than 500 throws, the conditional probability test is consistent with a hot hand for 51 out of 54 players.
Table 1 - Probability of Making a Hit conditional on the Outcome of Previous Throws for selected Players.
Player P(Hit/2 Misses) P(Hit/ 1 Miss) P(Hit) P(Hit/ 1 Hit) P(Hit/2 Hits) Serial Correlation
Michael van Gerwen .38 .39 .43 .48 .47 .08
Peter Wright .35 .36 .38 .41 .42 .05 Phil Taylor .41 .40 .42 .43 .45 .03 Adrian Lewis .33 .35 .38 .43 .41 .08 Dave Chisnall .35 .35 .39 .45 .46 .10 Gary Anderson .38 .39 .40 .42 .40 .03 Steve West .27 .29 .34 .45 .46 .16 Corey Cadby .35 .35 .41 .49 .58 .15 Jermaine Wattimena .32 .32 .32 .31 .27 − .01 Average Overall .32 .33 .35 .40 .40 .07
All 31 players with data of more than 1000 shots perform better after a hit than after a miss, with Jermaine Wattimena being the first player (33. most observations with 970 throws) performing slightly worse (Table 1). Corey Cadby performed best after two consecutive hits
12
with scoring 58 % of his throws representing a 23 % higher hit percentage than after 2 consecutive misses (Table 1). There are several players as Corey Cadby or also Steve West, whose hot hand effects are relatively large as they score 20 % more after two hits compared to two misses and hence their performance deviates between the performance of a below-average player and the best performances only the absolute world class players could reach.
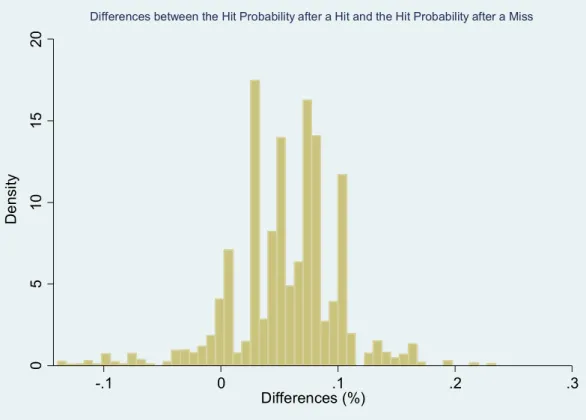
The histogram shows the distribution of the players based on the differences between the probabilities of making a hit after a hit and after a miss in percentage points (Figure 1). This means, for instance, that the hit percentage of players with a value of zero is the same after a hit and a miss and players with a value of 0.1 hit 10 % more often after a hit than a miss.
Figure 1: Players have a significant higher success rate after a hit than a miss
Figure 1 illustrates clearly that players hit considerably more often after a hit than a miss. It also shows that most of the players hit between 1 and 11 % more often after hits than misses with an average difference of 7 %. Excellent performances with a hit rate over 42 % were only reached when the last throw was already a success, providing evidence for the existence of the
0 5 1 0 1 5 2 0 D e n s it y -.1 0 .1 .2 .3 Differences (%)
13
hot hand (see Appendix A - Figure 1 for details). Overall around 25 % of the players hit more than 10 % more throws after one hit than after one miss, which makes a huge difference as, for example, the skill levels of the first and third quartile, so 50 % of the players, are only separated by a 5.5 % difference in hitting percentage. This means, while having the hot hand, a player with below average skill, can play as good as or even better than top players, which is a strong remark for the impact of the hot hand.
The conditional probabilities test shows that for most players there is evidence for the existence of a hot hand effect, but the magnitude and therefore the influence of the hot hand on the players’ performance differs across players.
The second concept used is the Wald-Wolfowitz runs test, which tests for clustering in the throw outcomes. Table 2 shows the results of the runs test for the same players as in the conditional probabilities test with total hits (Column 2) and misses (Column 3), actual number of runs per player (Column 4), the computed expected number of runs (Column 5) and the computed test statistic Z (Column 6). As the sample size is greater than 10, the Z-statistic is compared to a standard normal table and significant results are marked depending on their level of significance (**p < .05, ***p < .01).
The number of actual runs is lower than the expected number of runs for eight out of the nine selected players and for the overall average (Table 2). Less runs than expected lead to a negative test statistic Z, which indicates clustering of hits and misses in the players’ data. As all results of the eight players with a negative z-value are at least significant on the 5 % level, while for seven players even on the 1 % level, their hits are clustered.
Taking all players into account the actual runs are less than the expected, and therefore consistent with a hot hand for 122 out of 200 players. Considering players with more than 500 throws the runs test is consistent with a hot hand for 51 out of 54 players.
14
Table 2 – Runs Test for selected Players
Player Hits Misses Number of Runs Expected Number of Runs Z-Value
Michael van Gerwen 3,736 4,964 3,911 4,262 − 7.73***
Peter Wright 2,412 3,897 2,837 2,981 − 3.83*** Phil Taylor 2,348 3,313 2,675 2,749 − 2.03** Adrian Lewis 2,119 3,458 2,432 2,629 − 5.59*** Dave Chisnall 2,074 3,243 2,286 2,531 − 7.06*** Gary Anderson 2652 3,917 3,054 3,164 − 2.81*** Steve West 341 655 376 449 − 5.18*** Corey Cadby 144 211 145 172 − 3.00*** Jermaine Wattimena 295 635 408 404 0.31 Average Overall 44,293 81575 53,596 57,412 − 23.59*** Note: The test statistic is Z= _ , where R is the observed number of runs, R_ the expected number of runs and sr the standard
deviation of the number of runs. _= !"∗!
!"$! + 1
and &² = !"∗! ( !"∗! !" ! )
(!"$! )((!"$! ") with n1 the number of hits and n2 the number of misses.
**p < 0.05, ***p<0.01
As clustering of hits is an indicator for the existence of the hot hand, the results of the runs test confirm the existence of the hot hand for the majority of players and are thus in accordance with the results of the conditional probability test.
However, the magnitude of the hot hand differs highly between players and for the minority of players, e.g. for Wattimena, no hot hand effects are detected either in the runs test or the conditional probability test. Either these players don’t have a hot hand or the sample size of throws is too small as evidence of the non-existence was only reported for players with a relative low sample size.
The third concept, the hit streak frequency, and the fifth concept, the hit streak length, can detect the hot hand in a player who occasionally or frequently becomes hot, but alternates between hits and misses when not on a streak, which could go undetected with other hot hand
15
measures (Miller & Sanjurjo, 2015). While the hit streak frequency measures how often a player becomes hot, the hit streak length statistic indicates how long a player stays hot measuring the longest streak of consecutive hits. The hit streak momentum statistic extends the conditional probability test by indicating how a player performs after a streak of three consecutive hits.
It’s important to mention the remarks of Miller & Sanjurjo (2014), which prove mathematically that the results of the concepts’ statistics are underpowered and hence biased downwards. This means that an evidence for the hot hand in the raw results (without correction for the downwards bias) is even more powerful, as, for instance, the hit streak momentum statistic tends to be nearly 3 % lower on average due to the bias than it really is (Miller & Sanjurjo, 2014).
To a large extent the results of these three hot hand statistics confirm the findings of the two first concepts, the conditional probability and runs test.
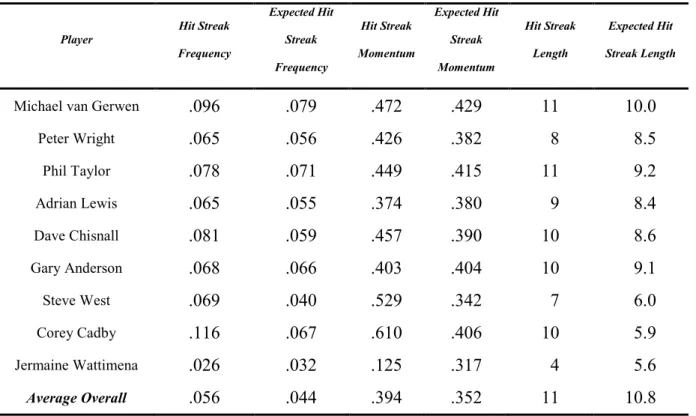
Table 3 – Hit Streak Frequency, Hit Streak Momentum and Hit Streak Length statistics by comparison to their respective expected statistics.
Player Hit Streak Frequency Expected Hit Streak Frequency Hit Streak Momentum Expected Hit Streak Momentum Hit Streak Length Expected Hit Streak Length
Michael van Gerwen .096 .079 .472 .429 11 10.0
Peter Wright .065 .056 .426 .382 8 8.5 Phil Taylor .078 .071 .449 .415 11 9.2 Adrian Lewis .065 .055 .374 .380 9 8.4 Dave Chisnall .081 .059 .457 .390 10 8.6 Gary Anderson .068 .066 .403 .404 10 9.1 Steve West .069 .040 .529 .342 7 6.0 Corey Cadby .116 .067 .610 .406 10 5.9 Jermaine Wattimena .026 .032 .125 .317 4 5.6 Average Overall .056 .044 .394 .352 11 10.8 Note: Expected Hit Streak Length approximated with Rn= log (1/p) (nq) according to “The longest run of heads” approach by Schilling (1990).
16
Taking all players into account, the hit streak frequency statistic is higher than expected under constant hit rates and thus consistent with a hot hand for 132 out of 200 players. Considering players with more than 500 throws, the hit streak frequency is consistent with a hot hand for 46 out of 54 players. As Table 3 indicates, the hit streak frequency is higher than expected for all the selected players except Wattimena. Cadby has nearly double as many streaks in his throw sequences than expected, while Wattimena has slightly less streaks (0.4 %) than expected.
For most of the players the hit streak momentum statistic is higher than expected, although there are high differences between the players.For Cadby and West they are around 20 % higher than expected, while for Wattimena they are 20 % lower than expected (Table 3).
Considering players with more than 500 throws the hit momentum statistic is consistent with a hot hand for 31 out of 54 players, whereas it should be noted that this hot hand statistic is biased downwards according to Miller & Sanjurjo (2014). As only 1 out of 20 throws in the data is part of a streak and the hit streak momentum statistic measures the hit percentage for throws after a streak, it must be pointed out that the results for players with a low sample as Wattimena can be very imprecise due to high variance in low samples. Furthermore, as already pointed out, the hit momentum statistic is biased downwards and hence the hot hand effect is underestimated, because not every throw after a streak occurs while a player is in a hot state (Miller & Sanjurjo, 2014).
The hit streak length statistic supports the findings of the previous statistics. Taking all players into account, the hit streak length statistic is consistent for 137 out of 200 players. Considering players with more than 500 throws the hit streak length statistic is higher and thus consistent with a hot hand for 37 out of 54 players. Van Gerwen and Taylor both have the longest streaks of 11 consecutive hits, while Cadby, Chisnall and Anderson have a longest streak of 10 consecutive hits. While the actual streak length is for most of the players slightly longer than expected, Cadby’s longest streak is nearly twice as long as expected. The lowest
17
value of the selected players has Wattimena with the longest streak of 4 hits, which is 1.6 hits shorter than expected (Table 3).
These results of the selected players are consistent with the findings from the hot hand statistics analyzed previously as they show evidence of a hot hand for all the selected players except Wattimena.
4.3 Pooled Analysis
In the individual analysis I have found evidence of the hot hand for the majority of players and for eight out of the nine selected players, which were part of the more detailed individual analysis. All five hot hand statistics are consistent with evidence in favor of a hot hand in professional darts on the individual level. By looking at the whole sample, the magnitude of the hot hand effect as well as the amount of shooters running hot confirmed the existence of the hot hand in professional darts. Hot hand effects were detected for around 80 % of players. Due to the variance, it was expected that not all players would show evidence of the hot hand. Of the 20 % of players, where no evidence for hot hand effects was found, only 3 out of 40 players had more than 500 throws in the examined period. These players may have had hot hand effects, but the number of observations for these players could have been too small to detect them. Furthermore, high differences between the players’ performances were detected, which suggests that the magnitude of the hot hand effect differs between players.
In a pooled analysis it can be tested in a more detailed way if there are average effects of the hot hand throughout the sample. Although the pooled analysis is limited as it cannot detect a hot hand on the individual level, it can test how homogeneous or how common the hot hand effect is. In addition, a pooled analysis has the great advantage that it provides the possibility to examine the influence of external factors on the performance and thus on the hot hand. It also allows to look deeper into the influence of ability on the hot hand, which gives insights if there is a difference in becoming hot between high-skilled and low-skilled players.
18
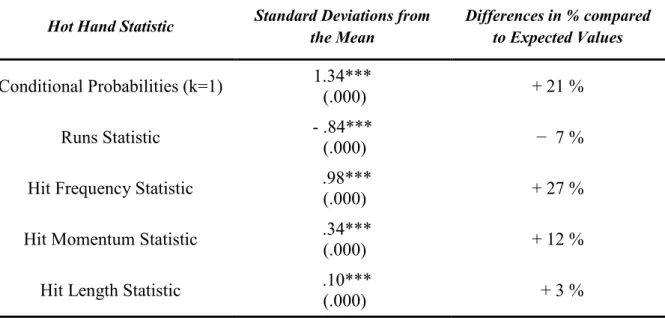
As the last row in each case of Table 1-3 already shows, for all the five hot hand statistics the overall average effects indicate a hot hand as well. Players score 7 % more often after a hit than a miss on average. The runs statistic is significantly negative indicating clustering of hits. And also the hit streak frequency, hit streak momentum and hit streak length statistics exceed their expected values on average, confirming the hypothesis of a hot hand throughout the data. To give a more detailed impression of the average effects, Table 4 illustrates the pooled analysis of the hot hand statistics expressed in standard deviations from the mean and the relative differences expressed as a percentage between expected and actual outcomes.
Table 5 – Average effects of the hot hand statistics expressed in standard deviations of the mean
Hot Hand Statistic Standard Deviations from
the Mean Differences in % compared to Expected Values Conditional Probabilities (k=1) 1.34*** (.000) + 21 % Runs Statistic - .84*** (.000) − 7 %
Hit Frequency Statistic .98***
(.000) + 27 %
Hit Momentum Statistic .34***
(.000) + 12 %
Hit Length Statistic .10***
(.000) + 3 %
Note: ∗∗∗ p < 0.01
Relative to the expected outcomes, players performed 21 % better after a hit than a miss, indicating a difference of the performance of more than one standard deviation. The number of runs was 6 % lower than expected also indicating a hot hand. Players had streaks of 3 or more hits 27 % times more often than expected, indicating an increase of performance of circa one standard deviation. Moreover, they hit relatively 12 % more throws after a streak, while the length of the longest streak extended the expected value by 3 %.
The average effects of the hot hand statistics are quite strong. As shown the performance of the players increases by more than standard deviation on average after a hit compared to a
19
miss and the frequency of streaks increases by around one standard deviation. This supports the proposition that the hot hand effect is not affecting only a few players, but represents a widespread and homogeneous effect over the majority of players.
After the hot hand was detected both on an individual and pooled level and differences in the existence and magnitude of the hot hand effect were found, it is interesting to see if these differences between players could be explained by external key factors as skill or experience.
4.4 The influence of external variables
The study has detected different skill levels of the players. Throughout the data players hit between 14 % and 42 % of their throws on average representing different levels of ability. This raises the question, if the hot hand effect might be stronger or weaker for players with low or high ability or if hot hand effects can be observed independently from the players’ ability.
Therefore in the second part of the pooled analysis players are grouped into a low-, middle- and high-skilled group depending on their average hit percentage. Players in the lowest quartile of their hit percentage (less than 32.5%) have been assigned to the low-skilled group, players between the first and third quartile (between 32.5 % and 38 %) have been assigned to the middle-skilled group and players behind the last quartile (over 38 %) have been assigned to the high-skilled group.
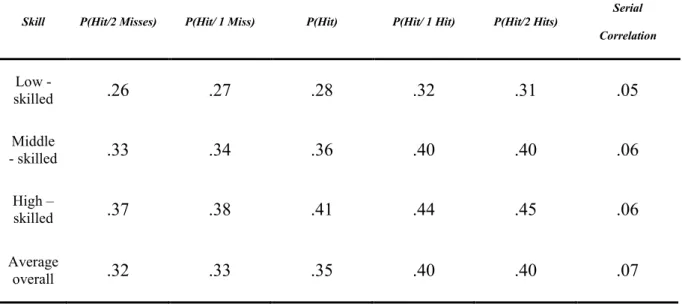
Table 5 shows the conditional probability test for the three different skill groups. For all the three ability levels, the chance to score increases with previous hits and decreases with previous misses, suggesting that the hot hand effect exists for low- as well as high-skilled players. The magnitude of the hot hand effect differs just marginally between the three different skill groups, so there could not be found any correlation between the hot hand effect and the skill level. Therefore the hot hand effect seems to exist independently of the players’ ability.
20
Table 5 - Probability of making a hit conditional on the outcome of previous throws for the three different skill groups.
Skill P(Hit/2 Misses) P(Hit/ 1 Miss) P(Hit) P(Hit/ 1 Hit) P(Hit/2 Hits)
Serial Correlation Low - skilled .26 .27 .28 .32 .31 .05 Middle - skilled .33 .34 .36 .40 .40 .06 High – skilled .37 .38 .41 .44 .45 .06 Average overall .32 .33 .35 .40 .40 .07
Furthermore, different external variables as age, which can be used as an approximate of experience, and the time played, which tells us if performance changes with the duration of the games, and their influence on the hot hand effect are analyzed.
The age of the players has no significant influence on the performance of the players (see Appendix A – Figure 2 for details). But still the hot hand effect could differ between young and old players. Therefore in another part of the analysis the players were put into groups based on age and a conditional probability test was conducted.
For young players (first quartile with age<30), as well as mid aged (2nd and 3rd quartile with players between 30 and 45) and older players (age >45) hot hand effects were detected. Younger players scored 8 % more and older players scored 6 % more after a hit than after a miss. Thus younger players tend to alternate slightly more often between hits and misses than older players do, which would be consistent with the hypothesis of young players performing less constantly. But as all age groups have hot hand effects and differences are with 2 % relatively small, evidence in favor of this hypothesis is not highly conclusive. However, the hit streak frequency statistic confirms these tendencies as low age players are 6.4 % of their throws on streaks, while for old players only 4.9 % of throws are followed by a streak.
21
Another aspect of the analysis are the throws made in different time phases of the game. The performance of players increases with increasing time of the game, which has no direct explanatory power for the analysis as the games of high quality tournaments and later tournament stages with consequently better players are scheduled for a longer number of legs and hence last longer.
However, the temporal length of the game could influence the size of the hot hand effect and therefore will be analyzed. It will find evidence on the question if streaks and the hot hand effect appear more often in earlier or later phases in the game or independently of the time phase of the game. If there are differences detected in this analysis, there could be either mental factors like concentration effects or physical factors like exhaustion or contrary warm-up effects influencing the hot hand effect over time.
For the analysis the throws were grouped based on the game time until the respective throw was made. They were grouped into throws early in the game (<10 minutes played), throws in the middle phase of the game between the 10th and 25th minute and throws late in the game (>35 minutes played). The conditional probability test reports a positive hot hand effect, which is for all time groups around 6 % and, therefore suggests that the hot hand effect is independent from the time played. However, the hit streak frequency statistic for throws made under 10 minutes is with 5.1 % lower than for throws made after 35 min with 6.9 %. The small increase of the hit streak frequency with increasing game time can be explained by a slight positive correlation between game length and ability, which means that longer games consist of better players on average. Therefore there tend to be no significant time effects on the hot hand effect.
5.
Discussion
My analysis of the hot hand in professional darts found strong evidence of the existence of a hot hand effect significantly influencing the performance of the players.
22
In the individual analysis all five hot hand statistics showed evidence of the existence of the hot hand. The analysis found evidence of the hot hand for 80 % of the players. They experienced a greater hit rate after streaks of k=1, 2, 3 hits than misses, clustering of hits, and more streaks with a greater streak length than expected. As all the 30 players with more than 1000 observations had hot hand effects, finding no evidence for the hot hand for 20 % of the players could be due to higher variance of the performance in lower sample sizes. The analysis also showed that the magnitude of the hot hand differed between players. While Corey Cadby performed 65 % better after 2 hits than after 2 misses most of the players performed 15 % - 25 % better. Excellent performances of over 40 % hitting percentage were only reached while being hot and having experienced success in previous attempts.
The pooled analysis confirmed the findings of the individual analysis, as also the average effects of the five hot hand statistics showed clear evidence for the existence of the hot hand. With average effects of partly more than one standard deviation, indicating an increasing performance by more than 20 %, the pooled analysis demonstrates that the hot hand effect is a homogenous and wide-spread effect existing for the great majority of players. Taking the findings of Miller & Sanjurjo (2014) into account that the estimated effects are even partially biased downwards, the already strong evidence of the existence of the hot hand receives further confirmation.
In the second part of the pooled analysis the influence of variables as ability, age and game time on the hot hand was examined to find explanatory approaches for the existence of the hot hand. Since similar hot hand effects were detected for different levels of ability as well as for different time phases of the game, no evidence for an influence of ability or game time on the hot hand effect was found. However, there was little evidence for younger players having greater hot hand effects than older players.
As these results do not provide enough information about the emergence of the hot hand effect, further research taking additional variables into account is needed, to find out more about
23
the drivers creating the hot hand effect and whether the hot hand is created mentally or physically.
The obtained results are consistent with the results of Miller & Sanjurjo, providing evidence for the existence of the hot hand in basketball, and inconsistent with GVT’s results of the believing in the hot hand being a fallacy. In professional darts there is clear evidence for the existence of the hot hand and so the belief in the hot hand cannot be considered as a fallacy. However, future research has to examine if the magnitude of the hot hand effect deviates from the believed magnitude of the hot hand effect and if so, whether these beliefs under- or overestimate the actual hot hand effect.
Compared to Miller & Sanjurjo, who detected the hot hand effect in constructed, controlled shooting data, this study finds evidence of the hot hand in in-game data. Compared to Arkes (2010), who found evidence of the hot hand in basketball in a pooled analysis, this study also suggests the existence of the hot hand on an individual level. The analysis on an individual level gives the possibility to distinguish between players being “hot” and “good” by correcting for player ability. In contrast to most of the previous hot hand research with in-game data, the timeframe of the data is only seasonal due to the much higher amount of throws in darts compared to basketball. Therefore endogeneity problems due to increasing ability over time are minimized in my research. Nevertheless, also the ability can change over one season, which constitutes a possible limitation of my research. Transferring the results to economic and financial issues, the gained insights of studies based on GVT’s findings of the hot hand being a fallacy should be reviewed (Offerman & Sonnemans, 2004; Johnson, Tellis & Macinnis, 2005).
6.
Conclusion
This study tested for a hot hand in professional darts. All the five hot hand statistics provide significant results for the existence of the hot hand both on an individual and pooled level. The magnitude between being hot and not is large enough to influence the performance
24
significantly, so that below-average players while having the hot hand can perform better than the best players in the game. The individual analysis indicates that the magnitude of the hot hand effect differs strongly between players. Although the average effects are highly significant, there are players who tend to have small or no hot hand effects at all. External factors as ability, age or game time, did not influence the magnitude of the hot hand effect.
Therefore further research is needed to uncover the key drivers of the hot hand effect and detect whether it is a mentally or physically created phenomenon. Even if the existence of the hot hand fallacy in professional darts was questioned by this study, it would be interesting to see in future research, if people estimate the magnitude of the hot hand effect correctly or if there are under- or overestimation errors present.
Finding evidence of the hot hand in darts and basketball (Miller & Sanjurjo, 2014 & 2015), these models and frameworks can also be transferred from the sports area to financial and economic issues. By this the possible influence of the hot hand on important financial issues like investment decisions or economic issues, e.g. bubble formations in markets, could be examined more precisely.
25
References
Arkes, J. 2010. “Revisiting the Hot Hand Theory with Free Throw Data in a Multivariate Framework,” Journal of Quantitative Analysis in Sports, 6.
Bar-Eli, M., Avugos, S. and Raab, M. 2006. “Twenty years of “hot hand” research”,
Psychology of Sports and Exercise, 7.
Carlson, K. A. and S. B. Shu. 2007. “The rule of three: how the third event signals the emergence of a streak,” Organizational Behavior and Human Decision Processes, 104, 113–121.
Gilden, D. L., & Wilson, S. G. 1995. Streaks in skilled performance. Psychonomic Bulletin
and Review, 2, 260–265.
Gilovich, T., R. Vallone, and A. Tversky. 1985. “The Hot Hand in Basketball: On the Misperception of Random Sequences,” Cognitive Psychology, 17, 295–314. Green, B. S. and J. Zwiebel. 2015. “The Hot Hand Fallacy: Cognitive Mistakes or
Equilibrium Adjustments? Evidence from Major League Baseball”.
Johnson, J., G. J. Tellis and D. J. Macinnis. 2005. “Losers, Winners, and Biased Trades”,
Journal of Consumer Research, 32 (2), 324-329.
Kahneman, D. 2011. “Thinking, Fast and Slow”. Farrar, Straus and Giroux.
Koehler, J. J. and C. A. Conley. 2003. “The “hot hand” myth in professional basketball,”
Journal of Sport and Exercise Psychology, 25, 253–259.
Koeppen, J. 2011. “Das Hot-Hand-Phänomen im Sport“. Dissertation Thesis, Deutsche
Sporthochschule Köln.
Miller, J. B. and A. Sanjurjo. 2014. “A Cold Shower for the Hot Hand Fallacy,” Working
Paper.
Miller, J. B. and A. Sanjurjo. 2015. “Is it a Fallacy to Believe in the Hot Hand in the NBA Three-Point Contest?” Working Paper.
Offerman, T. and Sonnemans, J. 2004 “What’s Causing Overreaction? An Experimental Investigation of Recency and the Hot-hand Effect”. Scandinavian Journal of Economics, 106: 533–554.
Professional Darts Corporation. 2014. “17 PERFECT DARTS! Michael van Gerwen throws 17 perfect darts!” [Video file] retrieved from
https://www.youtube.com/watch?v=pGNZ3GqYrVY
Schiller, M. F. 1990. “The Longest Run of Heads,” The College Mathematics Journal, 21, 200-202.
Thaler, R. H. and C. R. Sunstein. 2008. “Nudge: Improving Decisions about Health, Wealth,
and Happiness”, Yale University Press.
The Guardian. 2010.”Phil Tayler makes history with two 9-dart finishes”. Accessed December 2016. https://www.theguardian.com/sport/2010/may/25/darts
The Telegraph, 2012. “Watch Michael van Gerwen's nine-dart finish, and Phil Taylor's row with Raymond van Barneveld”. Accessed December 2016.
http://www.telegraph.co.uk/sport/othersports/darts/9772639/Watch-Michael-van-Gerwens-nine-dart-finish-and-Phil-Taylors-row-with-Raymond-van-Barneveld.html