ELSEVIER
Food Confro/, Vol. 9, No. 4, pp. 187-194, 1998 0 199X Elsevier Science Ltd PII: SO956-7135(97)00073-X
All rights reserved. Printed in Great Britain 0956-7135/9R $lY.oO+O.00
PAPER
Influence of milk source and
ripening time on free amino
acid profile of Picmte cheese
A. Cristina Freitas,” J. Maria Fresno,+
Bernard0 Prieto,+ Inmaculada France,+
F. Xavier Malcata*” and Javier Carballo’
The evolution of concentration of j?ee amino acids in Picante cheese throughout ripening was studied for several volumetric ratios of ewe’s and goat’s milks. The concentrations of all free amino acids, except asparagine, y-aminobutytic acid, and cysteine, generally increased as ripening time elapsed. Analyses of variance have indicated that ripening time and, to a lesser extent, milk composition have significant effects on the overall concentration of free amino acids. The major free amino acids present in the various cheeses along the ripening period were valine, leucine, and phenylalanine; these three amino acids accounted for 50, 49, 57, 46 and 42% of total free amino acids at 0 days and 42, 42, 43, 39 and 36% of total free amino acids at 180 days for cheeses manufactured with 0, 25, 50, 7.5 and 100% goat’s milk, respectively. Significant differences could be detected in terms of amino acid profile when the relative proportions of ewe’s and goat’s milks were altered (eg valine changed from 251.79 &- 0.99 to 352.20 + 16.49 mgllO0 g of dy matte< leucine from 181.48k1.77 to 224.OO+11.6OmgJlOOg of dty matte< and phenylalanine from 120.39f1.44 to 155.36 +8.39 mgl1OOg of dry matter in 140-day ripened cheeses when plain eweS milk was replaced by plain goat S milk). The correlation coefJicients between the concentrations of valine, isoleucine, leucine and phenylalanine, on the one hand, and ripening time, on the other; were greater than 0.93. 0 1998 Elsevier Science Ltd. All rights reserved
INTRODUCTION
Picante is a Portuguese traditional cheese produced on the farm level only from blends of raw ewe’s and goat’s milks, and possesses a few distinctive charac- teristics: it is hard, salty and spicy. Picante cheese- making milk is coagulated with animal liquid rennet
*Escola Superior de Biotecnologia, Universidade Cat6lica Portuguesa, Rua Dr Ant6nio Bernardino de Almeida, P-4200 Porto, Portugal, +Departamento de Higiene y Tecnologia de 10s Alimentos, Universidad de Lion, 24071 Le6n, Spain and *Area de Tecnologia de 10s Alimentos, Facultad de Ciencias de Orense, Universidad de Vigo, 32004 Orense, Spain. “To whom correspondence should be addressed.
extracted from calf’s stomach without addition of a
starter culture; fresh cheeses are rubbed with dry salt
after manufacture and ripened via appropriate piling up on straw and sand in maturation rooms. Studies on this cheese, which must be ripened for at least 120 days to meet the legal specification, are relatively
scarce (Freitas and Malcata, 1996; Freitas et al., 1995,
1996, 1997), and most of those available are virtually
outdated (eg Cruz et al., 1945).
Proteolysis is one of the most important pheno-
mena that takes place during cheese ripening, and studies pertaining to the evolution of the free amino acid profile in several cheeses during ripening have been published (Marcos and Mora, 1982; Polo et al., 1985; Ramos et al., 1987; Gonzalez de Llano et al.,
Amino acid profile of Picante: A. C. Freitas et a/.
1991; Fresno et al., 1993; Barcina et al., 1995).
Primary proteolysis in cheese may be defined as the set of those chemical changes in p- and a,-caseins (and large polypeptides derived thereof) that are detected by polyacrylamide gel electrophoresis (Rank
et al., 1985); products of secondary proteolysis in cheese encompass small peptides and free amino acids that are soluble in the aqueous phase of cheese and are thus recovered in the water-soluble fraction. In Picante cheese a moderate ripening extension index is often observed, namely, 25-29% of total nitrogen by 6 months (Freitas et al., 1997), which, according to Furtado and Partridge (1988), is an indi- cation of moderate rennet activity. Peptides and free amino acids released via (cellular or cell-free) proteo- lytic enzymes have been implicated with flavour intensity (McGugan et al., 1979) and can be used to monitor cheese ageing (Aston and Dulley, 1982; Gonzalez de Llano et al., 1991). The non-protein nitrogen (NPN) changes throughout ripening time in
Picante cheese are characterized by slight increases in early stages of ripening and large increases in late stages of ripening, with maximum NPN values of 87 and 92% of water soluble nitrogen (WSN) in Picante
cheeses manufactured with plain ewe’s and plain goat’s milk, respectively, by 180 days of ripening. These values indicate that fully ripened Picante
cheese exhibits a high ripening depth index, which in turn suggests an important role for small peptides and free amino acids in Picunte cheese characteristics.
This manuscript reports results of a research effort aimed at monitoring the concentrations of free amino acids throughout ripening and ascertaining the effect of different ratios of addition of ewe’s to goat’s milks therein; this study is warranted because the tradi- tional protocol of Picante cheese manufacture allows for the use of virtually any proportion of ewe’s and goat’s milks (and the legal Portuguese regulation encompassing this AOP cheese is not yet explicit on such proportion either), and so it is anticipated that
effective standardization of this cheese will require a more defined protocol of manufacture leading to a more defined set of final specifications. Furthermore,
Picante is one of the Portuguese cheeses manufac- tured from raw milk that is ripened for the longest period, so its composition in free amino acids is particularly important due to their organoleptic role.
MATERIAL AND METHODS
Cheesemaking protocol, experimental design, and cheese sampling
In order to study the effects of ripening time and volumetric ratio of milks, five batches of mixtures of raw ewe’s and goat’s milk, with the compositions O/100 (goat’s/ewe’s), 25175, 50150, 75125 and 100/O% (v/v) were prepared; these batches will be denoted hereafter as OC, 25C, 5OC, 75C and lOOC, respec- tively. For each aforementioned batch, 90 I of milk
were used to manufacture 20 cheeses according to traditional procedures described in detail by Freitas
et al. (1996), ie milk was coagulated with liquid rennet extracted from calf’s stomach (Fabre, Monza, Italy) without addition of any starter culture. Fresh cheeses were rubbed with dry salt after manufacture,
and cheeses were ripened for 180 days via appro- priate piling up on straw and sand in maturation rooms.
Ten cheeses (two cheeses from each batch) taken randomly were sent under refrigerated conditions to our laboratory at 0, 9, 25, 40, 55, 83, 110, 140 and 180 days of ripening to be analyzed. The resulting experi- mental layout was thus a 5 x 9 full factorial design replicated twice.
CHEESE ANALYSIS
Chemicals
Potassium hydroxide, sodium acetate trihydrate, sodium bicarbonate, acetic acid, phosphoric acid, ethanol, disodium hydrogen phosphate, perchloric acid and acetronitrile (liquid chromatography grade) were obtained from Pancreac (Barcelona, Spain). Triethylamine (liquid chromatography grade), phenyl- isothiocyanate solution (PITC) (protein sequencing grade) and amino acid standards (liquid chromato- graphy grade) were purchased from Sigma (St Louis, MO, USA).
Equipment
A liquid chromatography system consisting of a ternary pump model SP-8800 and a column heater model SP-8792 from Spectra-Physics (San Jo&, CA, USA), an injector model 7125 from Rheodyne (Cotati, CA, USA), a UV-spectrophotometer model 730 S LC from Kontron Uvikon (Middlesex, UK) and an integrator model SP-4290 from Spectra-Physics were used to perform the free amino acid analysis. Elution was performed in a BrownleeTM C,, reversed- phase column (25 x 0.46 cm) from Applied Biosys- terns (Foster City, CA, USA).
Sample preparation
Samples of 10 g of cheese were dissolved in 40 ml of 0.6 N perchloric acid and homogenized in a Sorvall Omni-mixer (Waterbury, CT, USA) for 2min. The mixture was centrifuged at 1790g for 5 min in a Heraeus Christ centrifuge (Osterode, Germany), the supernatant was filtered through No. 54 filter paper (Whatman, Maidstone, UK) and its pH was adjusted to 6.0 with 1 N potassium hydroxide. The filtrate was then placed in an ice bath for ca. 20 min, filtered again with No. 54 filter paper and concentrated at 40°C in a rotavapor R-Biichi (Switzerland). The dry
extract was dissolved in 20 ml of 0.5 M sodium
Amino acid profile of Picante: A. C. Freitas et al.
bicarbonate (pH 8.5). The mixture was finally passed through Millex-Gs 0.45 urn filter (Millipore, Molsheim, France) and frozen for later analysis by HPLC. Derivatization of amino acids with PITC was performed according to Alonso et al. (1994); depend- ing on the expected total free amino acid concentra- tion of the sample, different volumes (50-300 ~1) of extract were evaporated to driness at 37°C under liquid nitrogen; the residue, corresponding to the derivatized dried samples, was dissolved in 400-1200 ul of diluent (prepared by dissolving 710 mg of diso- dium hydrogen phosphate in 1 1 of water-acetronitrile at the volumetric ratio of 19: 1 and by adjusting pH to 7.40 with phosphoric acid).
Chromatographic analysis
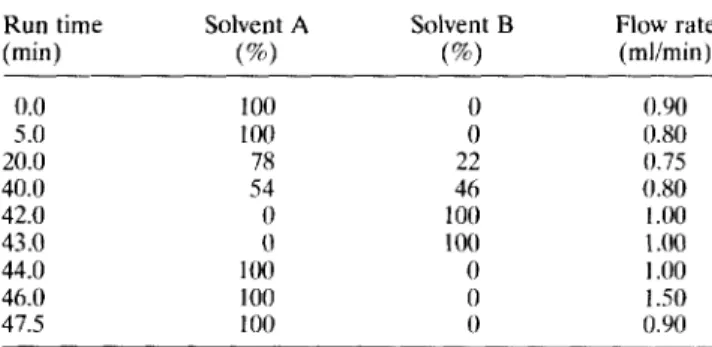
The Pica-TagrM method for sample preparation and analysis was used according to Alonso et al. (1994) with some modifications: the gradient conditions are depicted in 7’ahle I, the column temperature was 50°C and detection was by absorbance at 254 nm. The amounts of free amino acids in the various cheese samples were calculated using peak area values from two analytical replications and converted to concen- trations using calibration curves previously obtained from amino acid standards (Sigma) dissolved in 0.5 M sodium bicarbonate.
Statistical analysis
The effect of ripening time and volumetric ratio of goat’s in cheesemaking milk on the concentration of every free amino acid was assessed using the ANOVA methodology; for each significant effect, the corresponding critical difference was assessed by Scheffe’s F multiple comparison test at the 5% signi- ficance level. Linear relationships between the concentration of the major free amino acids and ripening time were also statistically evaluated. All statistical analyses were carried out with the Stat- View-rM software v. 4.01 (Abacus Concepts, Berkeley, CA, USA).
Table 1 Solvent gradients used in the HPLC method
Run time Solvent A Solvent B Flow rate (min) (%I (S) (mlimin)
0.0 5.0 20.0 40.0 42.0 43.0 100 100 78 54 0 0 100 0 0 22 46 100 100 0 0 0 o.Yo 0.80 0.75 0.80 I.00 1 .oo 1 .oo 44.0 46.0 47.5 100 100 I.50 0.90 Solvent A: 19 g sodium acetate trihydrate in 1 I water. To this solution, 500 ul of triethylamine was added; the pH was then adjusted to 6.40 with glacial acetic acid; 940 ml of this solution were then mixed with 60 ml of pure acetonitrile. Solvent B: 600 ml acetonitrile plus 400 ml of water.
RESULTS AND DISCUSSION
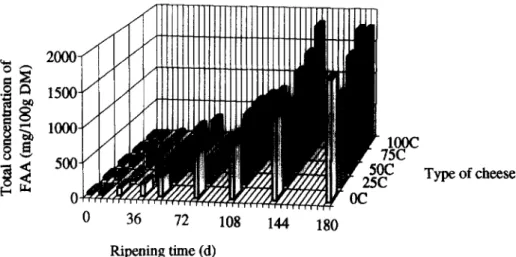
The evolution of the total concentration of free amino acids (FAA) in the various experimental cheeses is depicted in Figure 1; the content of total FAA increased continuously from cu. 30-54 mg/
100 g,, (where DM denotes dry matter) at 0 days to 1330-1942 mg/lOO g,, by 180 days. The release of total FAA accelerated between 3 and 6 months of ripening (see Figure I), and this behaviour is coinci- dent with acceleration of protein breakdown (Freitas
et al., 1997). According to Furtado and Partridge (1988) high levels of NPN are an indication of a strong starter peptidase activity, whereas Schmidt and Lenoir (1972) and Wallace and Harmon (1970) reported that enterococci possess a high proteolytic activity, especially Enterococcus fuecalis ssp.. faecalis;
Freitas et al. (1996) reported that enteroc:occi and lactobacilli were the predominant groups of lactic acid bacteria present throughout ripening of Picante
cheese and that Enterococcus ,faecium was the most abundant species of the genus Enterococcus
(immediately followed by Enterococcus fuecalis), so
their metabolic action may play an important role in the release of FAA.
The differences in terms of total FAA content between the various batches of cheese became higher as ripening time elapsed (see Figure I); the 75C cheeses presented, by 180 days, the highest value of total FAA content, whereas the total FAA content in the 1OOC cheeses decreased slightly between 140 and 180 days. It is noteworthy that both the ‘75C and 1OOC cheeses obtained the highest scores in terms of texture and flavour (Freitas et al., 1997). The ANOVA indicated that the ratio of addition of goat’s to ewe’s milk and, to a greater extent, the ripening time have significant effects on the total FAA content. The effect of milk composition likely arises from two factors: (i) goat’s milk contains higher total quantities of amino acid residues in milk proteins than ewe’s milk (Stojslavljevic et al., 1971); and (ii) a higher proportion of goat’s milk leads to more exten- sive proteolytic breakdown (Freitas et al., 1997).
The results obtained from the assays for the various free amino acids throughout the ripening period and for cheeses manufactured with different volumetric ratios of ewe’s and goat’s milks are displayed in Tables 2-4. From inspection of these tables, it can be observed that the concentration of every free amino acid generally increases throughout the ripening period except for asparagine, y-aminobu- tyric acid and cysteine; the contents of these free amino acids decrease in all experimental cheeses at least between 140 and 180 days. Some variability in terms of the content of several free amino acids was observed in a few sampling points, eg for the OC cheese and the period from 83 to 140 days where decreases are apparent; variable amounts of NaCl applied to the fresh cheeses, which may lead to different intrinsic rates of breakdown of proteins by
Amino acid profile of Pica&e: A. C. Freitas et al.
Type of cheese
36 72 108 144 180
Ripening time (d)
Figure 1 Evolution of concentration of total free amino acids throughout ripening for the various experimental cheeses.
residual rennet (Guinee and Fox, 1993) could (at least partially) be responsible for the aforementioned variability, especially knowing that independent cheeses (rather than the same cheese consecutively) were assayed throughout the ripening period.
The major FAA present in the various experi- mental cheeses and throughout the ripening period were valine, leucine and phenylalanine; each one
represented per se more than 10% and they accounted (as a whole) for 50, 49, 57, 46 and 42% of the total FAA pool at 0 days, and 42, 42, 43, 39 and 36% at 180 days for OC, 25C, 5OC, 75C and 1OOC cheeses, respectively. These figures are an indication that the type of cheesemaking milk is an important factor in terms of Pica&e final characteristics since a higher proportion of ewe’s milk in general leads to a higher percentual content of dominating FAA. Valine, leucine and phenylalanine have also been
listed as major amino acids in several varieties of small ruminants’ cheeses, eg Idiazabal (Barcina ef al.,
1995), Toscano (Lencioni et al., 1987), Telemea
(Buruiana and Farag, 1983) and Man&ego ripened in olive oil (Ordonnez and Burgos, 1980). According to Polo et al. (1985) the pattern associated with the FAA concentrations results from enzymatic degrada- tion of peptides, as well as from amino acid inter- conversion, excretion and degradation by various microorganisms.
With regard to other amino acids which account, on an individual basis, for more than 10% of the total FAA content in some (but not all) cheeses, proiine was observed in the early stages of ripening. According to Barcina et al. (1995) proline is one of the most abundant amino acids present in p-casein, although it is preferentially released as a dipeptide rather than as an FAA by the microbial flora in
Table 2 Evolution of mean and standard deviation of free ammo acid contents in OC cheeses throughout ripening Amino acid Ripening time (days)
concentration
(w/100 gDM) 0 9 25 40 55 83 I10 140 180
Aspartic acid 2.84kO.26 0.67kO.05 4.95il.63 4.37k1.53 16.55+1.12 65.98k4.10 14.8OiO.09 36.1251.47 104.43k15.37 Glutamic acid l.OlkO.04 0.89+0.11 4.80+1.20 6.3Yf1.48 28.07k1.55 77.13k3.68 18.94k1.35 72.96rt2.14 114.57+21.28 L-Glutamine 0.07 f 0.02 0.20 + 0.08 ND 0.57_fo.19 0.90~0.03 1.43 + 0.01 1.34 * 0.04 ND 2.18+0.27 Serine 0.06+0.03 0.17&0.02 2.19+0.81 3.05 iO.67 7.16*0.11 19.21 kO.89 11.04kO.36 17.98 kO.07 43.13 * 1.88 Asparagine 0.08+0.02 0.10~003 2.39kO.44 2.97kO.79 6.29k0.23 10.64 kO.07 2.80 + 0.37 7.62 +O.Ol 6.83 + 2.72 Glycine 0.19*0.01 0.12+0.01 0.75+0.03 0.89+0.04 1.92 i 0.03 3.84 +0.09 2.96 k 0.05 3.73kO.08 13.81 kO.24 Histidine O.hhfO.06 0.52+0.01 2.72+0.1X 4.94f0.40 6.69+0.16 15.26kO.22 13.96+ 1.51 20.42kO.19 2X.36+0.19 Taurine ND ND 2.18*0.12 1.82&0.01 2.95&0.13 3.30 & 0.06 ND ND ND y-Aminobutyric 0.09 + 0.02 0.33 + 0.01 3.80 f 0.07 6.28 k 0.43 7.23 +0.46 14.57 5 0.26 15.37kO.47 16.53kO.14 13.33 kO.46
acid
Threonine 0.27kO.03 0.24+0.01 l.hs+o.ll 2.63iO.21 4.70k0.26 10.67&0.15 8.36 + 0.47 X.82+0.49 25.42k0.86
Arginine ND ND ND ND ND ND ND ND ND
Alanine 0.86 * 0.04 1.39 +0.01 7.56+0.25 11.05+0.69 15.02~104 22.89kO.24 34.07iO.34 65.6711.44 83.3Ok2.89 Proline 3.39kO.25 6.81 +O.Ol 11.20+0.22 6.96kO.36 8.06+0.70 11.29kO.20 12.66kO.25 22.21 + 1.08 64.60k4.89 Tyrosine 1.03kO.12 1.01 kO.01 2.8710.11 5.63kO.37 5.02kO.34 14.72kO.06 23.33k1.20 31.79kO.34 64.18k8.19 Valine 5.01+0.44 5.02$0.17 14.69iO.19 28.83k1.00 48.28k2.66 105.38+0.27 181.60+4.34 251.79kO.99 324.40)25.27 Methionine 0.90+0.30 1.29kO.02 3.61~0.11 6.6X+0.16 3.95kO.27 8.90 +0.42 9.20 0.27 i 17.80 ItO. 27.68 + 1.89 Cysteine 0.53 * 0.13 0.93 + 0.02 1.39+0.61 0.96+0.01 I .98 * 1 .oo 5.50 + 0.25 5.28 + 0.37 2.81 + 1.18 3.46&0.10 Isoleucine 0.43kO.04 1.4OiO.09 5.47kO.09 12.57f0.33 23.06+1.63 53.98i0.27 SY.76-&1.83 121.73kl.45 173.06+13.30 Leucine
Phenylalanine 6.69kO.61 3.23kO.33 8.2OkO.71 5.65&0.20 12.10fO.13 l&36*0.34 33.03kO.38 26.13k2.63 32.79k5.74 46.54+3.44 74.45kO.56 61.13kO.22 132.54k2.40 97.41+2.45 120.39kl.44 181.48kl.77 249.4Ok22.87 146.99kl3.15 Ttyptophan
Lysine 0.74kO.06 1.57kO.14 1.79kO.07 1.4.5+0.04 3.54k0.57 5.23iO.01 11.01+0.45 6.57iO.91 12.55k1.80 13.09kO.87 28.69kO.91 31.24kO.14 44.58k1.60 31.91 +0.76 99.7Ok1.49 74.60k1.24 161.53+11.50 77.53+4.90 ND - not detected; DM - dry matter.
Amino acid profile of &ante: A. C. Freitas et al.
‘P&R+ 3 Evolution of mean and standard deviation of free amino acid contents in 25C, 50C and 75C cheeses throughout ripening Amino acid Ripening time (days)
concentration
@We gDM) 0 9 25 40 55 83 110 140 180
-___ Aspartic acid 3.15k2.27 2.60+1.40 1.75+1.19 3.20f3.04 3.96f2.32 9.98k5.05 41.73+ 15.48 75.36k26.10 102.27531.04 Glutamic acid 1.22kO.02 2.42k1.19 2.97kO.75 4.39k2.86 6.48+2&l 13.65k6.32 43.52 ) 19.87
L-Glutamine 0.09+0.08 0.40&0.15 0.49+0.15 0.73kO.13 0.31+0.53 1.02kO.23 1.80+0.10
97.46 + 28.01 1°K; z i0.l. 0.61+ 1.05
Serine 0.23kO.03 0.67kO.18 1.48kO.43 2.32kO.60 3.15k1.31 6.3 1 + 2.02 17.97 * 7.35 20.29 4 3.50 43:33; 8:35 Asparagine 0.24+0.03 0.75+0.35 1.53kO.43 2.71+0.61 3.81f0.86 3.56+ 1.32 8.15+ 1.68 10.21 t 2.67 6.55 kO.45 Glycine 0.25kO.10 0.34+0.10 0.56kO.12 0.90+0.11 1.54kO.21 2.04kO.17 3.90 +0.45 6.64 + I .86 15.50 +3.97 Histidine 0.35kO.33 0.83kO.73 2.72kO.37 4.73k1.32 6.59k1.26 7.13* 1.60 20.34 k4.11 17.14k1.94 23.00 + 2.50 Taurine 0.33f0.38 0.51kO.72 1.33&0.55 l.hlk0.18 1.58k1.41 1.6S.5 1.43 ND 1.791t:1.56 ND y-An$obutyric 0.13 + 0.06 0.43 + 0.30 1.26+0.74 3.79fl.06 7.89+4.08 8.51 f2.55 19.84F0.25 17.65 45.75 13.32 +3.99 Threonine 0.32kO.05 0.57+0.17 1.31+014 2.24kO.22 3.97k1.05 5.09 +0.7X 12.33+ 1.39 16.28 + 2.83 26.13k5.71 Arginine 1.16N+D.21 23!:099 ND ND ND ND ND ND ND Alanine 7:44*0:95 4.84+1 84 9.56+6:40 860&l 22 8:43+1:35 15.62&3 97 11.47+1:15 1502&l 21 Proline 5.55i1.50 12:07+1:52 33.36 F 1.84 70.56 + 22.22 78.57 + 19.89 23.29 + 5.67 36.93k9.12 69.21 k 18.34 Tyrosine 0.82+0.41 1.4610.26 2.36f0.64 4.17+1.60 5.63k2.69 7.73 + 0.84 29.84k6.14 42.05 & 4.94 56.18+ 11.81 Valine 7.96k3.10 11.61 k2.98 15.04+ 1.73 28.82h9.75 52.25 + 11.27 73.07+ 11.02 197.34+ 12.64 302.09+67.01 310.49k56.49 Methionine 1.82kO.46 2.76f0.82 4.92+0.66 6.47k0.69 6.76k2.43 6.25 rt 0.73 17.06f2.31 19.24 + 1.88 27.25 + 3.85 Cysteine 0.65f0.20 0.75kO.23 2.14k1.33 2.85kO.49 2.79+1.01 3.4210.17 3.66 $- 1.79 6.39 If: 1.95 3.20 k 0.67 Isoleucine 1.69~0.58 2.58+0.09 548~0.22 13.24+2.52 26.76k2.65 39.98k5.93 104.09+12.32 144.09+21.47 169.23k26.80 Leucine 9.49h3.12 13.82k2.59 18.50+ 1.78 32.64k8.86 49.98+ 10.02 45.13 +6.61 148.23f 17.02 193.71+ 19.63 228.33 k35.81 Phenylalanine 5.59 & 1.56 9.31+ 2.38 14.47 + 1.63 24.98 + 4.07 40.53 + 8.20 43.49 + 5.09 11 I .22 & 13.64 129.91_+ 12.57 146.05 + 18.04 Tryptophan 2.36k0.65 3.34k1.04 4.83+0.94 4.98k1.69 11.76k4.31 12.66 10.78 40.77 k3.40 82.57+ 21.34 79.77 + 19.23 Lysine 1.2OkO.16 2.93+0.66 6.28$1.44 10.28k2.93 16.72k5.87 18.88+2.75 62.90 + 7.05 113.69 + 29.93 151.98 k36.34 ND -- not detected; DM - dry matter.
cheese (Visser, 1977; Smid et al., 1991; Cogan and Hill, 1993); hence, the higher relative proportion of free proline detected at 0 and 9 days is probably related to l3-casein cleavage brought about by plasmin, the native protease of milk, soon after the coagulation step. According to Fresno et al. (1993),
proline was the dominant FAA detected in Armada
cheese curd; studies on Kizskhawal cheese (Buruiana and Zeidan, 1982) have shown a marked increase of free proline during the first 3 months of ripening and decreases in its relative concentration towards the
end of ripening. In the later stages of ripening, isoleucine also appeared among the major FAA in all experimental cheeses, ie isoleucine was detected above the 10% threshold after 55 days of ripening in 50C and 75C cheeses, after 83 days in 25C cheeses, and after 110 days in OC and 1OOC cheeses. According to Favier (1987) and Parkash and Jeness (1968), proline, glutamic acid, leucine and isoleucine represent approximately 40% of the total amino acid residue inventory of caprine casein. By the end of ripening (180 days), valine, leucine and isoleucine
Table 4 Evolution of mean and standard deviation of free amino acid contents in 1OOC cheeses throughout ripening Amino acid Ripening time (days)
concentration
@WfJO fhd 0 9 25 40 55 83 110 140 180
Aspartic acid 4.27kO.25 0.98k0.26 0.82+0.61 10.51&2.11 19.65k1.32 40.12i1.53 48.04k2.57 126.84k8.61 127.71+12.85 Glutamic acid 1.36+0.05 1.19+0.01 2.58kO.75 11.36+ 1.59 20.76k 1.18 47.07k2.08 39.86k2.96 163.62+ 12.30 140.85 f 15.19 L-Glutamine 0.19+0.01 0.40+0&l ND 0.76+0.03 1.12+0.11 1.87kO.09 1.86+0.23 1.80+0.01 3.88kO.04 Serine 0.14kO.01 0.41+0.02 0.42kO.21 3.85kO.30 6.49kO.14 14.66k1.14 15.42k1.82 25.42 +0.24 49.07 + I .27 Asparagine 0.22+0.01 0.35+0.02 0.7810.31 5.37 ho.33 9.56 kO.22 8.77 + 0.66 6.96 + 1.29 17.66 + 0.47 7.04kO.89 Glycine 0.14+0.01 0.29~0.01 0.68+0.18 1.09 kO.05 1.81 +0.02 3.57 kO.07 3.45 +0.25 13.16+0.34 19.64 rtO.67 Histidine 0.46+0.01 0.68k0.03 1.37+0.15 4.09+0.10 6.34k0.07 9.16kO.32 16.28+1.66 23.50+ 0.43 31.23+1.46 Taurine 0.75+0.01 1.06+0.01 1.46k0.13 2.41kO.06 2.71 kO.05 3.73+0.10 ND 2.34kO.01 2.99 kO.01
y-Aminobutyric 0.19+0.01 0.20+0.02 0.61&0.18 5.09kO.02 6.15+0.12 7.19kO.39 12.62kO.99 20.49 +0.74 17.49*0.17 acid
Threonine 0.27+0.01 0.44+0.03 0.83+0.01 2.49+0.06 4.68kO.04 8.88kO.39 10.42kO.93 22.99 +0.34 34.30) 0.42
Arginine ND ND ND ND ND ND ND ND ND
Alanine 1.24kO.03 1.45rf:O.O2 2.75kO.02 12.15+0.09 12.06+0.07 16.50+1.10 29.15k2.35 94.74k5.39 106.67kO.63 Proline 5.21+0.16 5.54+0.03 6.80+0.04 10.07kO.22 8.23+0.05 13.11rtO.72 15.32+1.18 58.84 + 4.25 64.47 rf. 2.49 Tyrosine 0.70+0.06 1.40+0.06 2.73+0.13 6.4OiO.71 8.4OkO.60 10.47k1.25 26.63$-0.68 49.37 + 1.98 53.305 1.19 Valine 4.38kO.04 4.86kO.21 8.30+0.07 28.66+ 1.57 53.99+ 1.93 75.62k8.30 179.19* 13.23 352.20+ 16.49 309.22k8.65 Methionine 0.72+0.01 1.12t0.06 2.33kO.07 5.18+0.20 5.45kO.30 5.68+0.62 11.28k1.20 24.91 kO.98 26.38 f 0.85 Cysteine 0.16+0.01 0.40+0.10 0.84kO.34 1.8410.72 3.56kO.86 3.00+0.16 3.96 kO.76 5.24kO.90 3.55 + 0.41 Isoleucine 0.76kO.02 1.29kO.12 3.92+0.10 15.45+0.28 28.43+0.09 36.9Ok2.85 84.99+3&l 170.00,8.06 154.45k4.46 Leucine 6.33kO.28 6.8OkO.40 12.14kO.24 30.51+ 1.36 47.87kO.57 41.82k3.83 106.6053.29 226.00+ 11.60 198.83k9.71 Phenylalanine 4.06kO.06 5.12+0.30 11.33+0.30 29.12k3.45 42.52k3.68 446956.69 86.64k7.20 155.36k8.39 135.37+3.21 Tryptophan 2.25kO.19 2.18+0.16 4.22+0.20 8.71+0.16 14.93k1.77 19.395257 37.62k3.11 108.16k4.32 101.2~8,1.62
Lysine 1.21kO.07 1.41+0.08 4.23+0.02 8.03&0.11 12.09kO.18 20.3Ok1.84 51.24k3.73 165.29f8.92 195.27k3.51 ND - not detected; DM - dry matter.
Amino acid profile of ficanfe: A. C. Freitas et al.
were the major FAA in OC, 5OC and 7X cheeses, where they represented 43, 45 and 41% of the total FAA content; in 25C cheeses, phenylalanine is also included in this group and altogether they accounted for 53%; in 1OOC cheeses, valine, leucine and lysine were the major FAA, and they represented 39% as a whole. Following inspection of the ANOVA, the ratio of mixture of goat’s and ewe’s milks and, to a greater extent, the ripening time have statistically significant effects on the content of free valine, leucine, phenyl- alanine and lysine; for isoleucine, the former factor was not significant at the 5% level. Scheffe’s F
multiple comparison test revealed that the evolution of concentration of isoleucine between 0 and 9 days, between 40 and 83 days, and between 110 and 180 days was not significant at the 5% level, nor was the evolution of leucine between 55 and 83 days or the evolution of valine and phenylalanine between 140 and 180 days. Scheffe’s F test revealed also that, depending on the FAA in question, several incre- ments in the percent composition of goat’s milk in the cheesemilk were not statistically significant; eg the OC and 25C cheeses did not exhibit significant differences in terms of contents of leucine and phenylalanine, whereas the 25C and 75C cheeses did not exhibit significant differences in terms of contents of valine, leucine and lysine.
The relative proportions of histidine, tyrosine, tryptophan and lysine were in general constant throughout the ripening period for the various experi- mental cheeses. Their relative proportion was between cu. 2 and 5% of the total FAA content for histidine and tyrosine, and between cu. 5 and 10% for tryptophan and lysine. The presence of tryptophan contrasts with data reported by Gonzalez de Llano et
al. (1991), who did not detect tryptophan in any of the samples analyzed. Aspartic acid was present in our experimental cheeses at relative proportions that were extremely variable, attaining values from below 2% of the total FAA concentration for the 5OC, 7SC and 1OOC cheeses between 25 and 55 days, to above
10% for the OC cheeses between 55 and 83 days and for the 25C and 1OOC cheeses at 0 days. Inspection of the ANOVA indicated that ripening time and, to a lesser degree, the ratio of mixture of goat’s and ewe’s milks were significant factors at the 5% level of signi- ficance with regard to free histidine, tyrosine, trypto- phan and aspartic acid concentrations. No significant differences were revealed by Scheffe’s F test for the concentration of aspartic acid between 0 and 40 days, for the concentration of histidine between 110 and 140 days, and for the concentration of tryptophan between 140 and 180 days. In terms of influence of volumetric ratios of goat’s and ewe’s milks, Scheffe’s
F test indicated that an increment of 25% of goat’s milk in the preparation of cheesemaking milk was not significant for the concentrations of histidine, tyro- sine, tryptophan and aspartic acid, whereas an incre- ment of 50% was not significant for the concentrations of histidine and tyrosine. Cheese
manufactured with 100% goat’s milk or 100% ewe’s milk did not display statistical differences in terms of tyrosine and tryptophan contents.
In Picante cheese, the relative proportion of glutamic acid increased throughout the ripening period and reached values of 6.6, 6.8, 5.4, 7.4 and 7.9% of the total FAA content by 180 days of ripening in the OC, 25C, 5OC, 75C and 1OOC cheeses, respectively. Glutamic acid is found in small amounts in Munchego cheese after long ripening periods (Ordonez and Burgos, 1980). Although the ratio of mixing of goat’s and ewe’s milks and the ripening time were found to be statistically significant factors overall, Scheffe’s F test indicated no significant differ- ences between 0 and 9 days and between 140 and 180 days for the concentration of this amino acid. The 25% volumetric increment of goat’s milk did not lead to statistically significant differences between the OC and 25C cheeses, and between the 25C and 50C cheeses.
y-Aminobutyric acid, present in low-quality cheeses (Choisy et al., 1990), was found in small concentrations in Picunte. Despite the fact that its concentration increased continuously throughout the ripening period, its higher relative proportion (between cu. 2 and 5% of the total FAA content) was detected in intermediate stages of the ripening period for all experimental cheeses. In the beginning and by the end of the maturation period, the y-aminobutyric acid contents represented less than 2%) of the total FAA content. Scheffe’s F test indicated no significant differences between 110 and 140 days in terms of the concentration of this FAA.
The less abundant FAA (ie those whose content was always less than 2% of the total FAA content in all experimental cheeses) were glutamine and glycine. Serine, asparagine, taurine and threonine were also below the aforementioned threshold in most cheeses. The low concentrations of taurine contrast with reports by Mehaia and Al-Kanhal (1992), who claimed that taurine is the most abundant FAA in goat’s milk; however, very low concentrations of taurine (approximately 0.26% of the total FAA content) were also reported by Barcina et al. (1995) in Idiuzubul cheese by 360 days of ripening. Arginine, which has been reported to be responsible for an unpleasant bitter-sweet taste (Lemieux and Simard, 1992), could not be detected by the analytical tech- nique utilized. Sala-Trepat and Burgos (1972) reported the absence of arginine in some samples of
Cubrules cheese.
Linear regression analysis applied to the contents of the main FAA in our experimental Picunte cheeses showed that good correlations exist between their content and ripening time; eg the correlation coeffi- cients between the contents of valine, isoleucine, leucine and phenylalanine, and ripening time where positive and higher than 0.93. This is in agreement with regression analyses applied to the amino acid nitrogen contents assayed by two spectrophotometric
Amino acid profile of Picanfe: A. C. Freitas et a/.
methods (ie using either 2,4,6-trinitrobenzenesulfonic acid or cadmium-ninhydrin), in which case the corre- lation coefficients were all above 0.89 (Freitas et al.,
1997).
Buruiana, L. M. and Farag, S. I. (1983) The variation of amino acids in Telemea cheese during pickling. Egyptian Journal of
Dairy Science 11,.53-59
Buruiana, L. M. and Zeidan, A. A. (1982) Variation of free amino acids in Kashkawal Dalia cheese during ripening. Egyptian Journal of Dairy Science 10, 209-213
CONCLUSIONS
As expected, the total concentration of FAA increased with ripening time for every proportion of ewe’s and goat’s milks, and ripening time actually exhibited a stronger effect than said proportion. However, significant differences could be detected in terms of amino acid profile when the proportion of ewe’s and goat’s milks were changed (eg valine changed from 251+ 0.99 to 352.20 + 16.49 mg/lOO g ,lM, isoleucine from 121.73 + 1.45 to 170.00 _+ 8.06 mg/lOO gllM, leucine from 181.48+ 1.77 to 226.OOi
11.60 mg/lOO g,,M, p henylalanine from 120.39 rir I .44 to 155.36 rt 8.39 mg/lOO g I)M, and lysine from 99.70 + 1.49 to 165.29 + 8.92 mg/lOO g,)M in 140-day ripened cheeses when plain ewe’s milk was substituted by plain goat’s milk). Therefore, standardization of
Picarzte cheese will not be possible unless such milk proportions are constrained to a tight range, especially knowing that some FAA detected play a role in terms of taste.
ACKNOWLEDGEMENTS
The authors are grateful to the members of the tech- nical board of the Governmental Directorate of Agri- culture of the Region of Beira Interior (DRABI, Portugal) for their cooperation in supervising the local manufacture of cheeses according to the design presented and in transporting such cheeses to the ESB premises. Financial support for author A. C. F. was provided by a Ph.D. fellowship within the Programme for the Creation of National Infrastruc- tures in Applied Science and Investigation (CIENCIA) r d d ministered by the National Board for Scientific and Technological Investigation (JNICT, Portugal). Partial financial support for the research expenses was provided by project ‘PROTOLACTIS: producao, por tecnologias optimizadas, de lacticinios tradicionais’, administered by PAMAF (INIA, Portugal).
REFERENCES
Alonso, M. L., Alvarez, A. I. and Zapico, J. (1994) Rapid analysis of free amino acids in infant foods. Journal of Liquid Chroma-
togruphy 17, 4019-4030
Aston, J. W. and Dulley, J. R. (1982) Cheddar cheese Ravour.
Australian Journal of Daiv Technology 37, 59-64
Choisy, C., Desmazeaud, M., Gripon, J. C., Lamberet, G., Lenoir, J. and Tourneur, C. (1990) El Queso, Omega, S. A. (ed.). Andre Eck, Barcelona, pp. 57-91
Cogan, T. M. and Hill, C. (1993) Cheese: Chemistry, Physics and Microbiology, P. F. Fox (ed.). Chapman & Hall, London, pp. 193-255
Cruz, A. A. (1945) Lacticinios da Beira Baixa: Queijo a ovelheira e queijo a cabreira. Boletim Pecudrio (Lisboa) 12, 5.5-100
Favier, J. C. (1987) Composition des fromages de chevre. Cahiers de Nutrition et Dittetique 22, I I7- 123
Furtado, M. M. and Partridge, J. A. (1988) Characterization of nitrogen fractions during ripening of a soft cheese made from ultrafiltration retentates. Journal of Daity Science 71.
2877-2884
Freitas. A. C., Fresno, J. B., Prieto, B., Malcata, F. X. and Carballo, F. J. (1997) Effects of ripening time and combination of ovine and caprine milks on proteolysis of &ante cheese.
Food Chemistry 2, 219-229
Freitas, A. C. and Makdta, F. X. (1996) Infuence of milk type,
coagulant, salting procedure and ripening time on the final characteristics of Picante cheese. International Daity Journal 6,
1099-I I16
Freitas, A. C., Pais, C., Malcata, F. X. and Hogg, T. A. (1996) Microbiological characterization of ficante da Reira Buka
cheese. Journal of Food Protection 59, 155-160
Freitas, A. C., Sousa, M. and Malcata, F. X. (1995) Effect of ripening time and the combination of ewe and goat milk on the microflora of Picante cheese. ltolian Journal of Food Science 7,
361-377
Fresno, J. M., Carballo, J., Bernardo, A. and Gonzalez, J. (1993) Evolution de 10s aminoacidos limes durante la maduracion del queso de Armada (variedad Sobado). Proc. IX Congreso National de Quimica (Quimica Agricola y Alimentaria), Sevilla, Spain, Vol. 3. pp. 227-232
Gonzalez de Llano, D., Polo, M. C., Ramos, M. and Martin- Alvarez, P. (1991) Free and total amino acids in the non-protein fraction of an artisan blue cheese during ripening.
Zeituchn~t fin Lehensnzittee-Utrtc~rsuc~lung und For?ichung 193,
520-532
Gonzalez de Llano, D., Ramos, M. and Martin-Alvarez, P. J. (1993) Comparative study of different methods for evaluating proteolysis in blue cheese. Zeitachnift fin Lebensmittee-Untersu- chung und Forschung 196, 29-31
Gonzalez de Llano, D., Ramos, M., Rodriguez, A., Mantilla, A. and Juarez, M. (1992) Microbiological and physiocochemical characteristics of Gamonedo Blue cheese during ripening.
International Dairy Journal 2, 12 I- 135
Guinee, T. P. and Fox, P. F. (1993). Salt in cheese: physical, chemical and biological aspects. In: Cheese: Chemistry, Physics and Microbiology, P. F. Fox (ed.). Chapman & Hall, London, pp. 257-302
Lemieux, L. and Simard, R. E. (1992) Bitter flavour in dairy products. II. A review of bitter peptides from caseins: their formation, isolation and identification, structure masking and inhihition. Le Lait 72, 335-382
Lcncioni, L., Pisanaelli, A. M., Baldi, E.. Fiorentini, R. and Galop- pini, C. (1987) Sheep milk cheese made with the addition of alfalfa leaf protein concentrate: proteolysis during ripening.
Lrbensmittel wissenschuft und Technologie 20, 277-281 Barcina, Y., Ibanez, F. C. and Ordonez, A. I. (1995) Evolution of
free amino acids during Idiazabal cheese ripening. kod
Marcos, A. and Mora, M. T. (1982) Proteolysis in Manchego cheese. Evolution of free amino acids. Arrhiros de Zootecniu
Control 6, 161-164 31, 115-129
Amino acid profile of Picante: A. C. Freitas et al.
McGugan, W. A., Emmons, D. B. and Larmond. E. (1979) Influ- ence of volatile and nonvolatile fractions on intensity of Cheddar cheese flavor. Journal of Dairy Science 62,398-403
Mehaia, M. A. and Al-Kanhal, M. A. (1992) Taurine and other free amino acids in milk of camel, goat, cow and man. Milch- wissenschaft 47, 35 l-353
Ordonez, J. A. and Burgos, J. (1980) Free amino acids of Manchego cheese rioened in olive oil. Milchwissenschafi 35.
69-71 ”
Parkash, S. and Jeness, R. (1968) The composition and character- istics of goat’s milk: a review. Dairy Science Abstracfs 30, 67-87
Polo, C., Ramos, M. and Sanchez, R. (1985) Free amino acids by high performance liquid chromatography and peptides by gel electrophoresis in Mahon cheese during ripening. Food
Chemistry 16, 85-96
Ramos, M., Caceres, I., Polo, C., Alonso, L. and Juarez, M. (1987) Effect of freezing on soluble nitrogen fraction of Cabrales cheese. Food Chemistry 24, 271-278
Rank, T. C., Grappin, R. and Olson, N. F. (1985) Secondary proteolysis of cheese during ripening: a review. Journal of Dairy Science 68, 801-805
Sala-Trepat, F. J. and Burgos, J. (1972) Maduracion del queso Cabrales: evolution de 10s aminoacidos libres durante la maduracion. Anales de Bromatolgie 24, 61-82
Schmidt, J. L. and Lenoir, J. (1972) Enterococci and their techno- logical capacities. Le Lait 52, 536-557
Smid, E. J., Poolman, B. and Konings, W. N. (1991) Casein utiliza- tion hy lactococci. Applied and Environmental Microbiology 57,
2447-2452
Stojslavljevic, T., Rasic, J. and Curcic, R. (1971) A study on the amino acids of yoghurt. I. Amino acids content and biological value of the proteins of different kinds of milk. Milchwissen-
sc/@i 26, 147-151
Visser, F. M. W. (1977) Contribution of enzymes from rennet, starter bacteria and milk to proteolysis and flavour develop- ment in Gouda cheese. 3. Protein breakdown: analysis of the soluble nitrogen and amino acid nitrogen fraction. Netherlands Milk and Dairy Journal 31, 210-239
Wallace, D. L. and Harmon, L. G. (1970) Intracellular protease from Streptococcus durans. Journal of Dairy Science 53, 394-402