Fuel and Operational Hedging
Evidence from the Airline Industry
Bruno Emanuel Azevedo Ferreira
Universidade Católica Portuguesa, Católica Porto Business School 2019
Fuel and Operational Hedging
Evidence from the Airline Industry
Master’s Final Work in the form of Dissertation presented to Universidade Católica Portuguesa to fulfill the requirements for the degree of MSc in Finance
by
Bruno Emanuel Azevedo Ferreira
under the supervision ofProfessor Doutor Manuel Ricardo Fontes da Cunha and Professor João Carlos Ferreira Novais
Universidade Católica Portuguesa, Católica Porto Business School March 2019
Fuel and Operational Hedging
Evidence from the Airline Industry
Trabalho Final na modalidade de Dissertação apresentado à Universidade Católica Portuguesa
para obtenção do grau de mestre em Finanças
por
Bruno Emanuel Azevedo Ferreira
sob orientação deProfessor Doutor Manuel Ricardo Fontes da Cunha e Professor João Carlos Ferreira Novais
Católica Porto Business School Março 2019
Acknowledgements
“An investment in knowledge pays the best interest” Benjamin Franklin
The completion of this thesis was reached with the support of many people, who directly or indirectly contributed to the achievement of this goal.
Firstly, I want to thank my parents, who invested in my knowledge, and whose incredible support and motivation were crucial throughout the Master’s program.
I am very grateful to the assistance I was given by my supervisors, Professor Doutor Ricardo Cunha and Professor João Novais, who made my dissertation proposal possible to materialize and always supported me during its development.
Furthermore, I truly appreciate all the help and time that Professor Ricardo Ribeiro spent on me, by sharing his wide knowledge on Quantitative Methods and STATA.
Last, but not least, I thank to all my teachers, friends and relatives, who took an important role on my academic and personal achievements throughout my life.
Resumo
A indústria da aviação é, hoje em dia, caraterizada por uma intensa competição global entre companhias aéreas. Os custos com combustível representam uma parte substancial das despesas operacionais e estão sempre sujeitos à volatilidade do mercado. Tanto a cobertura de risco financeiro como operacional estão ao dispor das companhias aéreas para contrariar a volatilidade e reduzir os custos em combustível. Sendo um dos poucos estudos a incluir companhias aéreas da Europa e da Ásia, esta investigação foca-se em 43 companhias ao longo do período 2007-2017 e conclui que as transportadoras aéreas Europeias têm menor exposição ao risco do preço do combustível, do que as companhias Asiáticas ou Norte-Americanas. Também é realizada uma comparação entre tipos de companhias e é possível concluir que a exposição média ao preço do querosene é maior em companhias-bandeira do que nas de baixo custo. Pensamos que este será o primeiro estudo global a incluir três medidas de cobertura de risco operacional, sendo estes a diversidade da frota, a eficiência de combustível, e a utilização de aviões em leasing operacional. Treanor, Carter, Rogers, & Simkins (2013) estudaram estas medidas mas apenas em companhias Norte-Americanas. Usando modelos de efeitos-fixos, os nossos resultados sugerem que a cobertura do risco financeiro acaba por aumentar a exposição. Adicionalmente, as nossas evidências apontam para uma rejeição da hipótese de que a cobertura de risco operacional leva a uma diminuição da exposição ao risco do preço do querosene, em todas as nossas três proxies.
Palavras-chave: hedging financeiro, hedging operacional, exposição ao risco, querosene, diversidade da frota, idade da frota, leasing operacional, companhia aérea, indústria da aviação.
Abstract
The airline industry is nowadays characterized by an intense competition among carriers around the globe. Jet fuel costs represent a substantial part of airlines’ operating expenses and are always subject to the market volatility. Both financial and operational hedging are at the disposal of airlines to offset the volatility and smooth these expenses across the years. Being one of the few studies to include airlines from Europe and Asia, this research focuses in 43 airlines over the period 2007-2017 and finds that European carriers are less exposed to fuel price than Asian or North American airlines. We also test for types of carriers and find evidence that the average fuel exposure is higher on premium airlines, when comparing to low-cost carriers. To our knowledge, this is the first study to include three measures of operational hedging on a global sample of airlines, namely fleet diversity, fuel-efficiency and operating leased aircrafts. Treanor, Carter, Rogers, & Simkins (2013) studied these but only on a sample of North American airlines. Using fixed-effects’ models, our results suggest that financial hedging increases fuel risk exposure. Furthermore, our results lead to a rejection of the hypothesis that operational hedging decreases airlines’ exposure, on all three proxies we consider.
Keywords: risk management, financial hedging, operational hedging, risk exposure, jet fuel, kerosene, fleet diversity, fleet age, operational leasing, airline industry.
Contents
Acknowledgements ... iv Resumo ... v Abstract ... vi Contents ... vii List of Figures ... ix List of Tables ... x Chapter 1: Introduction ... 1Chapter 2: Literature Review ... 5
2.1 Risk Management Theory. Rationales for Hedging. ... 5
2.2 Does hedging enhance firm value? ... 7
2.3 Hedging in the airline industry ... 8
2.4 Financial versus Operational Hedging ... 11
2.5 Empirical Models ... 12
Chapter 3: Data and Methodology ... 13
3.1 Data Sample ... 13
3.2 Methodology ... 16
3.2.1 Financial Hedging ... 16
3.2.2 Operational Hedging ... 17
3.2.2.1 Fleet Composition ... 17
3.2.2.2 Fleet Fuel Efficiency ... 22
3.2.2.3 Operating Leases ... 22
3.2.3 Regressions ... 23
3.2.3.1 First-step regression ... 23
3.2.3.2 Second-step regression – Berghöfer & Lucey (2014) ... 24
3.2.3.3 Alternative second-step regressions ... 28
3.2.4 Hypotheses ... 31
Chapter 4: Results and Discussion ... 34
4.1 Descriptive Statistics ... 34
4.1.1 Financial Hedging ... 34
4.1.2 Operational Hedging ... 40
4.1.2.1 Fleet Diversity ... 40
4.1.2.2 Fleet Fuel Efficiency ... 44
4.1.2.3 Operating Leases ... 46
4.1.3 Load Factor ... 48
4.2 Results ... 50
4.2.1 First-step equation ... 50
4.2.2 Second-step equation - Berghöfer ... 57
Chapter 5: Conclusions, Limitations and Further Research ... 69 5.1 Conclusions ... 69 5.2 Limitations ... 72 5.3 Further Research ... 73 References ... 76 Appendix ... 80
List of Figures
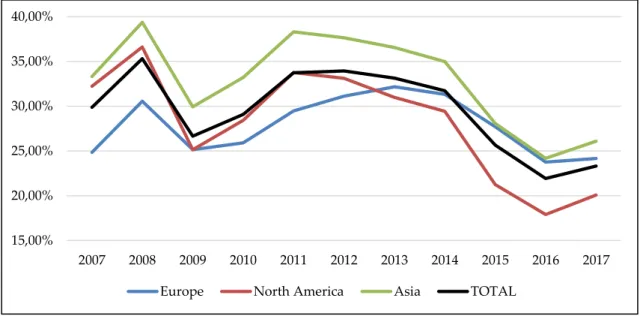
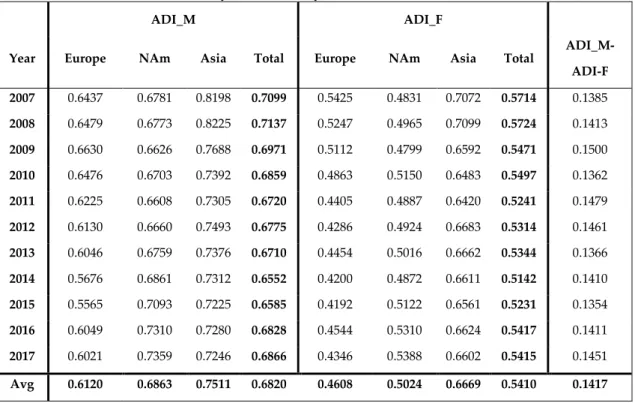
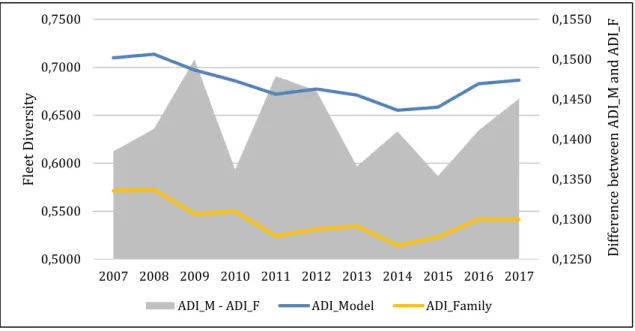
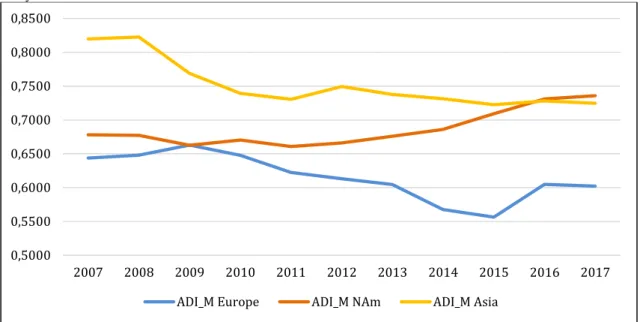
Figure 1: Evolution of the Crude Oil WTI ‘crack spread’ along the years 2007-2017. Daily values for Cushing, OK WTI Spot Price and U.S. Gulf Coast Kerosene-Type Jet Fuel Spot Price. ... 9 Figure 2: Evolution of the Brent Crude Oil ‘crack spread’ along the years 2007-2017. Daily values1 for Europe Brent Spot Price and U.S. Gulf Coast Kerosene-Type Jet Fuel Spot Price... 10 Figure 3: Underlying commodities hedged by airlines between 2007 and 2017. 35 Figure 4: Evolution of the percentage of fuel costs over total operating expenses, between low-cost and premium carriers, for the period 2007-2017. ... 38 Figure 5: Evolution of the percentage of fuel costs over total operating expenses, across continents, during the period 2007-2017. ... 39 Figure 6: Evolution of fleet diversity across the years 2007-2017, measured by models and families. ... 41 Figure 7: Overview of fleet diversity, measured by ADI_M, over the different continents, across the years 2007-2017. ... 42 Figure 8: Overview of fleet diversity, measured by ADI_F, over the different continents, across the years 2007-2017. ... 43 Figure 9: Evolution of airlines’ average fleet age per continent, for the years 2007-2017. ... 44 Figure 10: Comparison fleet age between premium and low-cost carriers, for the years 2007-2017. ... 45 Figure 11: Evolution of fleets’ percentages held under operating leasing, per continent and across the years 2007-2017. ... 46 Figure 12: Comparison of fleet percentage under operating leasing between low-cost and premium carriers, for the years 2007-2017. ... 47 Figure 13: Evolution of the passenger load factor per continent, across the years 2007-2017. ... 48 Figure 14: Evolution of the passenger load factor between premium and
low-cost carriers, across the years 2007-2017. ... 49 Figure 15: Graphical representation of the magnitudes of weekly changes on US Gulf Coast Kerosene versus Singapore Kerosene Spot Prices, throughout the period of 2007 until 2017. ... 55 Figure 16: Impact of the IFRS 16 standards on the balance sheet. ... 74 Figure 17: Impact of the IFRS 16 standards on the income statement. ... 74
List of Tables
Table 1: Overview of the airlines’ annual reports / 10-K fillings analyzed, from 2007 to 2017: ... 14 Table 2: Overview of the data withdrawn from the annual reports and 10-K fillings. ... 15 Table 3: Prediction of coefficient signs for the variables used on the estimation of Equations 4-5. ... 31 Table 4: Prediction of coefficient signs for the variables estimated on Equations 8-10. ... 32 Table 5: Overview per continent, as well as comparing low-cost carriers against premium airlines, on the underlying commodities, maturities and instruments used over the period 2007-2017. The percentage of periods hedged is also included. ... 36 Table 6: Statistics for fleet diversity, measured by models (ADI_M) and families (ADI_F). ... 40 Table 7: Summary statistics of jet fuel exposure coefficients. ... 51 Table 8: Detailed statistics of airlines’ jet fuel price exposure and financial hedging engagement. ... 53 Table 9: Results of a mean-comparison t-test for exposure coefficients between regions. ... 54 Table 10: Results of a mean-comparison t-test for exposure coefficients between types of carriers. ... 56 Table 11: Summary of descriptive statistics for the data used on estimating Equations 4 and 5. ... 57 Table 12: Correlation matrix for the independent variables estimated on Models 1-6. ... 58 Table 13: Estimation results for the same equations computed by Berghöfer & Lucey (2014). ... 60 Table 14: Summary of descriptive statistics for the data used on estimating Equations 8-10... 63 Table 15: Estimation results of Models 7-9, based on equations 8-10, respectively. ... 65
Chapter 1
Introduction
The International Air Transport Association (IATA) recently reported that fuel costs accounted for over 18.8% of airlines’ operating costs during the year of 2017, enhancing the importance of controlling these costs (IATA, 2018). Higher fuel costs are not fully charged to passengers by means of higher ticket fares, as the airline industry is very competitive, but there is a positive pass-through effect from changes in crude oil prices to airfares (Gayle & Lin, 2017). As so, hedging is a mean through with airlines try putting their efforts on, with the goal of having fuel costs relatively lower than its competitors’.
It is clearly stated in previous studies that current results regarding hedging effectiveness in the aviation industry are inconsistent and there is still a lack of research in this field (Berghöfer & Lucey, 2014; Treanor, Carter, Rogers, & Simkins, 2013). Moreover, Treanor (2008) mentioned that studies on the effectiveness of hedging are biased if they exclude operational hedging. Additionally, the biggest motivation for this study comes up with an enormous passion for the airline industry and its operating challenges.
The main goal of this research is to test whether financial and operational hedging decrease airline companies’ jet fuel price risk exposure. This is done using a sample of 43 airlines based on Europe, North America and Asia, throughout a period of 11 years (2007-2017). To our knowledge, this is the first
study taking into account fleet fuel-efficiency and operational leasing, two important operational hedges, on a global sample of airlines.
As a representative measure for financial hedging it is computed the next year’s percentage of fuel hedged (Berghöfer & Lucey, 2014). Three distinct operating hedges are added to test on its effectiveness on decreasing such fuel exposure. Particularizing, a company’s fleet diversity, measured by the number of operating aircraft models (ADI_M) or families (ADI_F), is defined as one of the operational hedges (Berghöfer & Lucey, 2014). Additionally, it is computed the weighted-average of a company’s fleet age on every single year, given that there is a negative relationship between a fleet’s age and its fuel-efficiency (Treanor et al., 2013). Moreover, the percentage of aircrafts being held in operating leasing contracts is taken into account as the third real option for operational hedging (Treanor et al., 2013). This type of contract allows companies for an easier exchangeability of its rented fleet, manageable in accordance to their demand situation, and balancing the need for more fuel-efficient aircrafts depending on the evolution of jet fuel prices.
Other factors might also impact the exposure of airlines to the fuel price risk, such as the average flight distance or the passenger load factor. It is clear that the higher the number of passengers aboard, the greater dilution of some costs which are incurred regardless of the load factor, such as part of the fuel carried.
We start with a brief literature review on Chapter 2, discussing the rationales for hedging, then going deeper within the airline industry and finally counterposing financial and operational hedging. Chapter 3 presents the characteristics of our data sample, manually introduced in Excel from the readings of 440 annual reports and 10-K fillings, followed by an analysis on the methodology used, presenting the different equations to be regressed and formulating our hypothesis to be tested.
On Chapter 4 we present descriptive statistics, being followed by our results and the discussing of our findings. We estimate a two-step model, the first with the intent to extract jet fuel exposure coefficients. From this, we find a similar percentage of negatively exposed carriers, when comparing to Berghöfer & Lucey (2014). We also get differences statistically significant (at a one percent level) between exposure coefficients between Europe and Asia, as well as between Europe and North America, in line with Berghöfer & Lucey (2014). On the other side, and against Berghöfer & Lucey (2014) findings, we did not get statistically significant differences on the exposure coefficients between North America and Asia.
Our study also contributes to the vast research by testing for the difference on jet fuel exposure between premium and low-cost carriers, on a global scale. Although we could not find significant differences between carriers with a two-sided t-test, we were able to prove, at a 10% significant level on a one-two-sided test, that premium carriers are more exposed than low-cost carriers.
This study tests several distinct second-step fixed-effects’ models with panel data, controlling for airline and year, this way putting jet fuel price exposure under test against several proxies for financial and operational hedging. We do not find evidence that financial or operational hedging decrease airlines’ fuel exposure, contrary to Treanor, Simkins, Rogers, & Carter (2014b). In fact, we find evidence that financial hedging increases risk exposure, with five-percent significance. This could be explained by ineffective hedging and sector specificities, validating the policies followed by North American airlines in the past recent years, by decreasing their fuel hedges. Airlines must evaluate if the costs of entering into hedging do not exceed the potential benefits.
Finally, on Chapter 5 we end up presenting the conclusions of our study, followed by some of the limitations a work on this field faces, due to the difficulty and inconsistency of gathering comparable information across annual
reports of companies around the Globe, and still providing some ideas for further researches on the impact of hedging in the airline industry.
Chapter 2
Literature Review
In this chapter, we will review and discuss some literature on risk management theories, performing a brief analysis of which is the rationale behind the reason why firms hedge, and if this practice adds value to firms. This is followed by a deeper analysis on specific practices of hedging within the airline industry and ends counterposing both financial and operational hedges airlines have at their disposal.
2.1 Risk Management Theory. Rationales for Hedging.
Under perfect market conditions, firms would have no incentives to hedge with derivative instruments (Modigliani & Miller, 1958). Nonetheless, due to the existence of market imperfections, there may be room and rationale for hedging, in a way of trying to increase the expected value of a firm (Deshmukh & Vogt, 2005).Froot, Schafstein, & Stein (1993) note that a firm can reduce its variability of cash flows by hedging, ultimately resulting in an increase of firm value. Smith & Stulz (1985) share this opinion, however noticing that hedging will also reallocate wealth from shareholders to bondholders, with prejudice to the first.
Moreover, Smith & Stulz (1985) suggest that hedging can reduce financial distress costs imposed by bond covenants, diminishing the probability of bankruptcy and this way increasing firm value, particularly on larger ones,
which present higher distress costs due to its size. These bond covenants have an important risk exposure for the companies, many times linked with accounting ratios, whose volatility should be carefully managed by the enterprise, avoiding bond covenants to become binding. Froot et al. (1993) further improve, considering hedging can be used as a way to increase debt capacity, once having debt in the capital structure is an advantage due to tax shields and also because financial distress is costly.
Besides, Myers (1977) defends that firms with “debt overhang” might have to turn down some investment opportunities, and so, hedging could help reducing distortions, ultimately adding value. On its turn, Froot et al. (1993) extends previous studies by stating that companies which might need external funding and do not hedge, could be obliged to underinvest in some states, due to high costs of external capital, including deadweight costs. The article written by Carter, Rogers, & Simkins (2005) explains that according to the Froot et al. (1993) model, hedging allows companies to decrease their needs of external financing when its cost is higher.
Froot et al. (1993) remember there is a strong evidence stating that investment is sensitive to internal cash flow levels. Indeed, firms will tend to hedge less when they have lower cash flows available, once this traduces itself in lower investment opportunities. On the other side, firms will have an increased desire for hedging when there is a higher correlation between their cash flows and their facility of obtaining external financing.
Tufano (1998) improved in a certain way Froot et al. (1993) model by considering agency costs between shareholders and managers. He explains that when these agency conflicts get high proportions, managers and shareholders may sparkle and take different opinions regarding the optimal hedging policy, ultimately, destroying value.
According to Stulz (1984), managers are the ones who decide the hedging strategy of a firm, and not shareholders. On the other side, the latter are the ones determining managerial compensation, which has a fixed part, plus typically a variable one, tied to the firm’s value. Hence, there seems to be an arrangement for a compensation package in a way that shareholders' wealth is maximized as long as managers obtain a level of expected utility sufficiently great to persuade them on working for the shareholders (Stulz, 1984), which is a way of outbalancing managers’ risk aversion. Given this, managers would be influenced to reduce the total variance of the firm value, by enforcing hedging contracts.
Froot et al. (1993) finds a weakness on the study computed by Stulz (1984), noticing it relies on the assumption that managers are confronted with substantial costs when “trading in hedging contracts for their own account”, because otherwise, they could fine-tune their risks without implying the firm explicitly in hedging events.
Smith & Stulz (1985) develop one more theory of hedging behavior of value-maximizing corporations. Given the structure of the tax code and assuming taxes as a convex function of earnings, hedging can be considered advantageous. Having in mind that hedging will tend to reduce the variability of a pre-tax firm value, the expected value for the corporate tax liability would also be lower. Consequently, and taking in account that hedging costs are relatively small, the expected post-tax firm value shall be higher.
2.2 Does hedging enhance firm value?
There are scarce studies on the impact of hedging on firm value creation, plus there is not a single clear conclusion. For instance, Allayannis & Weston (2001) study the impact of foreign currency derivatives in a sample of 720 U.S.
nonfinancial firms for the years of 1990-1995. Taking Tobin’s Q as a proxy for the relative market value, they find a positive relation, meaning that hedging improves firm value. Opposing, Jin & Jorion (2006) develop another study, considering a smaller sample of 119 U.S. oil and gas producers for the years of 1998-2001. They observe that hedging decreases a firm’s stock price sensitivity to gas and oil prices, however, concluding that hedging does not appear to affect market value, for that particular industry. As a final example, Carter et al. (2006) compute a narrower research, exclusively looking at U.S. airline companies for the years 1992-2003, for assessing the impact of jet fuel hedging on firm value. Their results show that there is a positive relation between jet fuel hedging and airline enterprise value. Additionally, they suggest a “hedging premium” of around 10% exists, being most of this premium due to the interaction of hedging with investment. They claim this is consistent with the statement that the reduction of underinvestment costs turns to be the main consequence and benefit of jet fuel hedging by airlines.
2.3 Hedging in the airline industry
Airlines use financial hedging in a way to manage their exposure to jet fuel prices (Treanor et al., 2014b). Hentschel & Kothari (2001) remember that there is a distinction between hedging, through which return volatility can be reduced, and speculation, which increases volatility and firm risk exposure. Dybvig & Marshall (1997) and Tokic (2012) highlight that concerning fuel hedging, commercial airlines have a long position, by acquiring future or forward contracts. The counterpart, being an oil/fuel company, or simply a trader, has the short position. Their payoffs are symmetrical.
It should be noted that aviation fuel futures are not so frequently traded on the organized exchange-traded futures market, having to be arranged
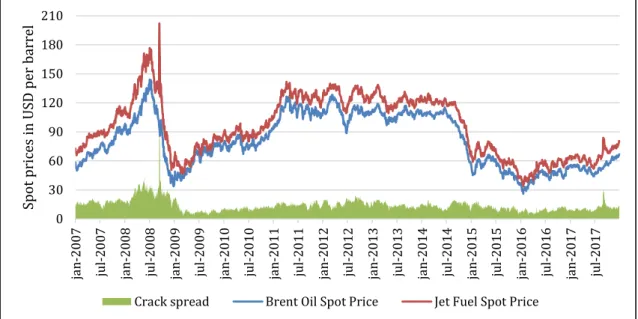
over-the-counter (OTC) alternatives (Berghöfer & Lucey, 2014). OTC derivatives have the ability of being easily customizable, enabling a dynamic hedging strategy. On the other hand, there is a counterparty risk of bankruptcy for both parts involved (Cobbs & Wolf, 2004). As so, airlines rather cross-hedge part of their fuel needs with plain vanilla instruments such as swaps, options, forwards and futures on similar commodities (Bessembinder, 1991). The most common underlying commodities used in financial hedging contracts, for jet fuel hedging purposes, are the jet fuel itself, crude oil or even heating oil (Carter, Rogers, & Simkins, 2004). The crack spread measures the differential between crude oil spot prices and jet fuel spot prices (Berghöfer & Lucey, 2014). This spread can be observed in the next two figures, one related to Crude oil WTI and other for the Brent Crude oil.
Figure 1: Evolution of the Crude Oil WTI ‘crack spread’ along the years 2007-2017. Daily values1
for Cushing, OK WTI Spot Price and U.S. Gulf Coast Kerosene-Type Jet Fuel Spot Price.
Source: Own figure, using data from the U.S. Energy Information Administration (2019).
1 Source: http://www.eia.gov/dnav/pet/pet_pri_spt_s1_d.htm - Data obtained on 22/01/2019 for the period
2007-2017. -40 10 60 110 160 210 ja n -2 00 7 jul-2 00 7 ja n -2 00 8 jul-2 00 8 ja n -2 00 9 jul-2 00 9 ja n -2 01 0 jul-2 01 0 ja n -2 01 1 jul-2 01 1 ja n -2 01 2 jul-2 01 2 ja n -2 01 3 jul-2 01 3 ja n -2 01 4 jul-2 01 4 ja n -2 01 5 jul-2 01 5 ja n -2 01 6 jul-2 01 6 ja n -2 01 7 jul-2 01 7 S po t pr ice s i n U S D pe r ga ll o n
Figure 2: Evolution of the Brent Crude Oil ‘crack spread’ along the years 2007-2017. Daily
values2 for Europe Brent Spot Price and U.S. Gulf Coast Kerosene-Type Jet Fuel Spot Price.
Source: Own figure, using data from the U.S. Energy Information Administration (2019).
Carter et al. (2004) state there are two key reasons why companies use different fuels rather than jet fuel itself, for jet fuel hedging purposes. Firstly, simply due to the nature of refining. When the crude oil is processed, the ‘top of the barrel’ product is gasoline, followed by the middle distillates (heating oil, diesel and kerosene), and then by the ‘bottom of the barrel’ fuel oil. Knowing that products from the same ‘level’ of the barrel present similar characteristics, plus, consequently, extremely correlated prices, and being jet fuel mainly pure kerosene with just a few additives, we have that heating oil is one of the chosen by airliners for hedging purposes. They also affirm crude oil prices are highly correlated with kerosene prices, therefore being another option of underlying for hedging. As final reason, the market for jet fuel is not liquid enough to allow for exchange-traded contracts, as already mentioned, reason why airlines prefer trading other similar commodities which are more liquid. However, this choice
2 Source: http://www.eia.gov/dnav/pet/pet_pri_spt_s1_d.htm - Data obtained on 22/01/2019 for the period
2007-2017. 0 30 60 90 120 150 180 210 ja n-2 00 7 ju l-2 00 7 ja n-2 00 8 ju l-2 00 8 ja n-2 00 9 ju l-2 00 9 ja n-2 01 0 ju l-2 01 0 ja n-2 01 1 ju l-2 01 1 ja n-2 01 2 ju l-2 01 2 ja n-2 01 3 ju l-2 01 3 ja n-2 01 4 ju l-2 01 4 ja n-2 01 5 ju l-2 01 5 ja n-2 01 6 ju l-2 01 6 ja n-2 01 7 ju l-2 01 7 Spot pr ic es in U SD pe r ba rr el
exposes airline companies to ‘basis risk’3, due to the difference between the
price of the commodity being hedged and the price of the instrument used to hedge the price risk.
Guay & Kothari (2003) state that financial derivatives are just employed to “fine-tune an overall risk management program that likely includes other means of hedging”. Many of the overall risks which non-financial firms face (e.g., operating risks) cannot be dealt with by using standard derivatives contracts.
2.4 Financial versus Operational Hedging
Analogous to some previous studies, both the studies of Allayannis, Ihrig, & Weston (2001) and Treanor et al. (2013) find evidence in the airline industry that operational and financial hedges are complements. However, the latter notices the evidence regarding the effectiveness of financial hedging is mixed: financial fuel derivatives have a positive impact on airlines’ value, contrary to fuel contracts, which diminish the value of airlines by locking in the price of fuel. Besides, if an airline solely uses operational hedges, its value is expected to decrease.
Treanor et al. (2013) discuss three types of operational hedges in their studies. First, and commonly to Allayannis & Weston (2001), they account for the diversity of aircrafts in an airline’s fleet, which is based on the Hirschman-Herfindahl concentration index. Secondly, they study airlines’ fleet’s fuel efficiency, which can be estimated by the aircraft’s average age. As last type of operational hedging, the authors evaluate the impact of companies which use operating leases on their fleets.
3 Basis risk can be defined as the risk that changes in a futures’ price over time will not follow accurately the
Firms can engage in hedging activities both through derivatives (financial hedging) or by recurring to operational hedges, which are part of the real options a firm owns (Treanor et al., 2013). These authors also mention on their work that the study computed by Allayannis et al. (2001) tests the impact of using financial and operational hedging on firm value. Their results show that there is not a positive relationship between the value of a multinational company and its practice of operational hedging. On the other side, they find that by using both financial and operational hedges, there is a value-enhancing component up to a 16.7% premium facing a firm’s market to book ratio.
2.5 Empirical Models
Our main models are inspired in Berghöfer & Lucey (2014), who analyze 64 airlines from Asia, Europe and North America, between 2002 and 2012, testing for the efectiveness of financial hedging, by considering the percentage of next year’s fuel hedged, and operational hedging, testing for two different measures of fleet diversity. They reject the hypotheses that financial or operational hedging decrease risk exposure.
Treanor et al. (2013) test whether financial and operational hedging are substitutes or complements, and include two additional operational hedges, fleet fuel efficiency and whether a fleet is held in operating leasing. For their sample of U.S. airlines, throughout the period 1994-2006, they find that financial hedging increases firm value and operational hedging destroys value.
Finally, Treanor et al. (2014b) also study U.S. airlines’ exposure to fuel prices for the period 1994-2008, finding that financial and operational hedging strategies are both effective at reducing airlines’ exposure.
Chapter 3
Data and Methodology
After reviewing the literature on risk management and hedging, the present chapter has the purpose of identifying the data used on this research, as well as identifying and describing the theoretical model and variables which are going to be used as proxies for testing whether financial and operational hedging can reduce airline companies’ jet fuel price risk. We believe this is the first study to include and test three distinct operational hedging measures on a global sample of airlines.
3.1 Data Sample
The period of analysis for this study is comprised between the years 2007 and 2017, considering a sample of 43 airlines based on North America, Europe and Asia as a proxy for the global airline market. Therefore, a panel data is used in the regressions. Due to events such as mergers or withdrawal from publicly listed exchanges, some airlines might not have information available for the whole study period.
The list of companies chosen consists on airlines which are, or at least were quoted, during part of the eleven-year sample, on international exchanges. Airlines from North America are classified with the code 4512 of the Securities and Exchange Commission (SEC) – scheduled air transportation, or also with
codes 4522 and 4513, for non-scheduled air transportation and air courier services, respectively. These last two are applied only to Atlas Air Worldwide and Air Transport Services, correspondingly.
Airlines considered on our sample disclose, at least, four annual reports, out of the eleven periods in study. This was defined in order to include Wizz Air, an important European low-cost carrier, which is the only airline counting with four reports. Out of the low cost carriers hereby analyzed, six are based on Europe, one is headed in Asia and four have its headquarters in North America.
Table 1: Overview of the airlines’ annual reports / 10-K fillings analyzed, from 2007 to 2017:
Asia Europe North America TOTAL LCC4
Airlines 14 15 14 43 11
Periods 144 151 145 440 104
Average periods per airline 10.29 10.07 10.36 10.23 9.45
Source: Own figure.
On the next page, Table 2 presents an overview of the information manually collected.
4 LCC – abbreviation for “low cost carrier”. LCC’s included for Europe are EasyJet, FlyBe Group, Norwegian Air
Shuttle, Pegasus Airlines, Ryanair and Wizz Air. North American low-cost carriers are Allegiant Travel, JetBlue Airways, Southwest Airlines and Spirit Airlines. The only Asian LCC is AirAsia.
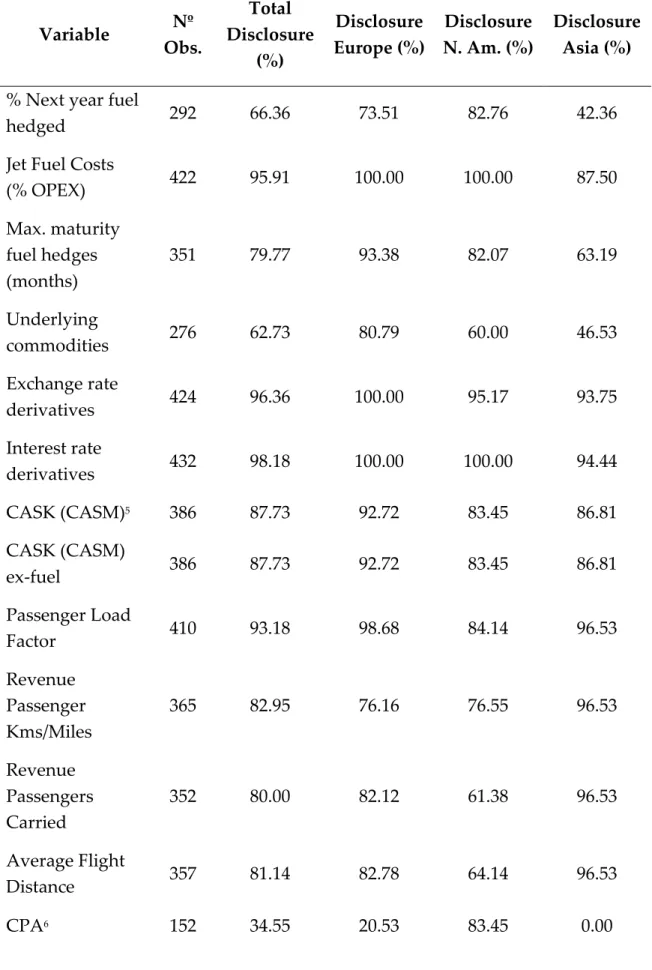
Table 2: Overview of the data withdrawn from the annual reports and 10-K fillings. Variable Nº Obs. Total Disclosure (%) Disclosure Europe (%) Disclosure N. Am. (%) Disclosure Asia (%)
% Next year fuel
hedged 292 66.36 73.51 82.76 42.36
Jet Fuel Costs
(% OPEX) 422 95.91 100.00 100.00 87.50 Max. maturity fuel hedges (months) 351 79.77 93.38 82.07 63.19 Underlying commodities 276 62.73 80.79 60.00 46.53 Exchange rate derivatives 424 96.36 100.00 95.17 93.75 Interest rate derivatives 432 98.18 100.00 100.00 94.44 CASK (CASM)5 386 87.73 92.72 83.45 86.81 CASK (CASM) ex-fuel 386 87.73 92.72 83.45 86.81 Passenger Load Factor 410 93.18 98.68 84.14 96.53 Revenue Passenger Kms/Miles 365 82.95 76.16 76.55 96.53 Revenue Passengers Carried 352 80.00 82.12 61.38 96.53 Average Flight Distance 357 81.14 82.78 64.14 96.53 CPA6 152 34.55 20.53 83.45 0.00
Variable Nº Obs. Total Disclosure (%) Disclosure Europe (%) Disclosure N. Am. (%) Disclosure Asia (%) Fuel derivative instruments 383 87.05 92.05 92.41 76.39 Nº Aircrafts 435 98.86 100.00 100.00 96.53 Nº Models 428 97.27 100.00 100.00 91.67 Nº Families 428 97.27 100.00 100.00 91.67 ADI_M 410 93.18 90.07 100.00 89.58 ADI_F 410 93.18 90.07 100.00 89.58 Fleet Age 334 75.91 82.12 92.41 52.78 % Operational Leasing 364 82.73 84.11 98.62 65.28 Charter 440 100.00 100.00 100.00 100.00 % Turboprop 431 97.95 100.00 100.00 93.75 Total Assets 427 97.05 95.36 98.62 97.22 OPEX7 422 95.91 95.36 98.62 93.75 Average 381 86.52 88.90 89.49 81.03
Source: Own figure.
3.2 Methodology
3.2.1 Financial Hedging
Airlines use financial hedging in a way to manage their exposure to jet fuel prices (Treanor et al., 2014b). Also, jet fuel costs account for an important part of airlines’ operating expenses. Therefore, the proxy considered for financial hedging is the percentage of an airline’s jet fuel hedged for the following year
6 CPA stands for Capacity Purchase Agreement. 7 OPEX stands for Operating Expenses.
(Berghöfer & Lucey, 2014; Treanor et al., 2013; Treanor et al., 2014b). Another aspect of airlines’ financial hedging strategic plan is the maximum maturity of derivative instruments used for fuel hedging (Berghöfer & Lucey, 2014), which is also here included.
3.2.2 Operational Hedging
Previous studies with global samples only included one proxy for operational hedging, being the fleet composition (detailed on Chapter 3.2.2.1), as in the case of Berghöfer & Lucey (2014). The inclusion of fleet fuel-efficiency (Chapter 3.2.2.2) and operational leases (Chapter 3.2.2.3) are herewith firstly tested on a global sample.
3.2.2.1 Fleet Composition
Treanor et al. (2013, 2014b) emphasize a diverse fleet provides additional operational flexibility to airlines, once they can adjust their route’s supply of seats. Because there is a high cost on abandoning certain markets or routes during periods that are not economically favorable (e.g. high fuel prices), it is great having a real option through which an airline can replace larger aircrafts by smaller ones. Nevertheless, although possessing a diverse fleet has its perks, it also comes with a cost. Besides the need for more spare parts and additional storage for these, there might also be an increase of costs with maintenance, flight crew training and pilots’ type-ratings (Berghöfer & Lucey, 2014), in the cases where airlines subsidize these programs.
Similarly to previous studies of Berghöfer & Lucey (2014) and Treanor et al. (2013, 2014b), the proxy for the fleet composition is analogous to the one used by G. Allayannis et al. (2001) as a geographic dispersion measure. Based on the
Hirschman-Herfindahl concentration index, it is computed an aircraft dispersion index (ADI), as entailed next:
𝐴𝐷𝐼_𝑀𝑖 = 1 − ∑(𝑁𝑜. 𝑜𝑓 𝐴𝑖𝑟𝑐𝑟𝑎𝑓𝑡 𝑚𝑜𝑑𝑒𝑙𝑗) 2 (𝑇𝑜𝑡𝑎𝑙 𝑁𝑜. 𝑜𝑓 𝑎𝑖𝑟𝑐𝑟𝑎𝑓𝑡 𝑖)2 𝑀 𝑗=1 (1)
Where M stands for the total number of different models operated on airline
i's fleet, and j represents each aircraft model. The ADI index varies from 0 to 1,
being one the highest degree of diversity, and zero meaning the airline i is operating one single aircraft model.
An Airbus A319neo, for instance, fits a maximum of 140 seats in 1-class configuration8, while the A320neo holds space for up to 194 seats9. These two
aircraft models can serve as substitutes depending on the passengers’ demand on a given time, acting as an important operational hedge.
Berghöfer & Lucey (2014) introduce a rational improvement on the ADI calculation, comparing to the previous studies computed by Treanor et al. (2013, 2014b), presenting this way the same index but considering aircraft families.
Additional costs arise more significantly when operating distinct aircraft families, rather than models. Distinct type ratings for cockpit and cabin crew, as well as specific maintenance such as spare parts, as already mentioned above, are usually specific for each aircraft family, and not per model. For instance, pilots who fly the Airbus A320, can also fly the A318, A319 and A321 with the same type rating, not incurring in additional costs for airlines. Flight attendants can also commute within these aircrafts without the need of extra-costs for airlines.
8 Source: https://www.airbus.com/aircraft/passenger-aircraft/a320-family/a319neo.html consulted on 30/07/2018. 9 Source: https://www.airbus.com/aircraft/passenger-aircraft/a320-family/a320neo.html consulted on 30/07/2018.
As so, Berghöfer & Lucey (2014) add this new method, by treating all aircraft models of a specific family10 as a unit, as can be seen next:
𝐴𝐷𝐼_𝐹𝑖 = 1 − ∑(𝑁𝑜. 𝑜𝑓 𝐴𝑖𝑟𝑐𝑟𝑎𝑓𝑡 𝑓𝑎𝑚𝑖𝑙𝑦𝑘) 2 (𝑇𝑜𝑡𝑎𝑙 𝑛𝑜. 𝑜𝑓 𝑎𝑖𝑟𝑐𝑟𝑎𝑓𝑡 𝑖)2 𝐹 𝑘=1 (2)
Where F stands for the total number of different families operated on airline
i's fleet, and k represents each aircraft family. The ADI index varies from 0 to 1,
being one the highest degree of diversity, and zero meaning the airline i is operating one single aircraft family.
When the 𝐴𝐷𝐼_𝑀𝑖 index is zero, meaning the airline operates just one aircraft
model, the 𝐴𝐷𝐼_𝐹𝑖 index always turns zero, once it is logically not possible to
operate multiple families with just one aircraft model.
The opposite is not necessarily true: if the 𝐴𝐷𝐼_𝐹𝑖 takes the value zero, it
means the airline operates a single family, but nothing can be concluded a priori regarding the 𝐴𝐷𝐼_𝑀𝑖 value. The airline might be operating just one type of
aircraft, or many more, all belonging to the same family.
The following considerations respect to the way of counting aircraft families and models, which is the basis for the calculation of the aircraft dispersion indexes. In a way to better understand the matter, here follows the explanation of how some specific cases were treated:
a. Freighters are distinguished from passenger/combo aircraft in terms of aircraft types (models), but not regarding families.
10 Example: the Airbus 320 family includes the following aircraft models: A318, A319, A320 and A321, ranging
the maximum seat capacity (considering 1-class configuration) from 100 up to 240 seats. Source:
Example 1: Boeing 777-300 (passenger aircraft) and Boeing 777-F (cargo plane)
are two different aircraft types, but belong to a common family (Boeing 777 family).
Example 2: Boeing 767-300F / -300BCF are considered different aircraft types, as
the first is a freighter and the second has a passenger-to-freighter conversion possibility. Both belong to the same family (Boeing 767 family).
b. Aircrafts only differing on engine types were considered different models (ex. A320neo and A320ceo). The designation “neo” stands for “new engine option”, while the “ceo” means “current engine option”. The new engines are more fuel-efficient11.
c. Same models but different range (ER stands for “extended range”).
Example 3: Boeing 777-300 / -300ER are hereby considered as two different
types. Although they share a similar fuselage, they can serve different operational needs due to different range spectrums12. The difference between
these versions is increased tank capacity and wingspan, with the comedown of a slight passenger capacity decrease in the ER version).
Examples of some aircraft families (examples of aircraft models between brackets): 1. Boeing13: a. 737 family (737-300, 737-400, 737-700, 737-800, 737-900…) b. 747 family (747-200, 747-300, 747-400, 747-800…) + Freighter (747-400 Cargo) + Combo (747-400BCF) c. 757 family (757-200, 757-300…)
11 Source: Airbus (https://www.airbus.com/aircraft/passenger-aircraft/a320-family/a320neo.html), visited on
10/02/2019.
12 Source: Boeing (https://www.boeing.com/commercial/777/), visited on 29/12/2018. 13 Source: Boeing (https://www.boeing.com), visited on 29/12/2018.
d. 767 family 200, 767-200ER, 767-300, 767-400…) + Freighter (767-300F)
e. 777 family (777-200, 777-200LR, 777-200ER, 777-300, 777-300ER…) + Freighter (777-F Cargo)
f. 787 family (787-8, 787-9, 787-10)
2. Airbus14:
a. A320 family (A318, A319, A320, A321)
b. A220 family - previously known as Bombardier C-Series - (A220-100, A220-300...)
c. A330 family (A330-200, A330-300, A330-800, A330-900…) + Freighter (A330-200F) + Combo (A330P2F)
d. A340 family (A340-200, A340-300, A340-500, A340-600…) e. A350 XWB family (A350-900, A350-1000)
f. A380 family (A380-800)
3. Bombardier15:
a. CRJ Series – also known as Canadair Jet - (CRJ200, CRJ700, CRJ1000) b. Q Series - also known as De Havilland Dash 8 - (Q200, Q300, Q400)
4. Embraer16:
a. E-Jet Family (175, 170, 190)
b. ERJ-Family (ERJ 140, ERJ 145, ERJ 170, ERJ 135) c. EMB Brasilia Family (EMB 170, EMB 120)
14 Source: Airbus (https://www.airbus.com/aircraft.html), visited on 29/12/2019.
15 Source: Bombardier (https://www.bombardier.com/en/aerospace/commercial-aircraft.html), visited on
29/12/2019.
3.2.2.2 Fleet Fuel Efficiency
Another important factor to take in account is a fleet’s fuel efficiency, given that a significant part of airline’s operational costs is given by jet fuel costs. Treanor et al. (2013, 2014b) remember that airlines which operate newer fleets are less exposed to fuel price fluctuations, once newer aircrafts are more fuel-efficient. Treanor et al. (2013, 2014b) measure this type of operational hedge by using the natural logarithm of an airline’s weighted average fleet age. The fleet age is withdrawn annually from the 10-K reports for the North-American airlines, and from the annual reports for the remaining. When the fleet age is not reported, it is used the adjacent year’s value, whenever available.
3.2.2.3 Operating Leases
As third and last measure of operational hedge by airlines, operating leases comes up with great importance as it allows companies to easily adjust their fleets to market conditions. These are considered in the previous work of Treanor et al. (2013). As cited in this study, Brigham and Ehrhardt (2005) note that by recurring to leasing contracts, companies have more flexibility on switching some aircrafts for others more appropriate given the market conditions, for instance, when seats’ demand for certain routes change.
Operating leasing contracts often include option clauses, which give airlines a real option of buying an airplane when the leasing contract ends, and/or to terminate or modify their leasing responsibilities before the contract ending.
In this study, the proxy used for measuring the impact of leasing is the percentage of an airline’s fleet that is held on operating leasing, as did Treanor et al. (2013). This percentage is computed as the total number of aircrafts an airline has in operating leasing, divided by the total number of aircrafts which
are in operation, whether owned or leased. The leasing data is withdrawn manually from both the 10-K reports for the North-American airlines (when available), and from the annual reports for the remaining.
3.2.3 Regressions
In order to estimate the way airlines might decrease their fuel price exposure, it is computed a two-step procedure, as previously done by other authors (Berghöfer & Lucey, 2014; Treanor et al., 2014b).
3.2.3.1 First-step regression
For the estimation of airlines’ yearly exposure coefficients, we have the following equation:
𝑅𝑖,𝑤 = 𝛼𝑖 + 𝛽𝑖,𝑦𝑅𝑀𝐾,𝑤+ 𝛾𝑖,𝑦𝑅𝐽𝐹,𝑤+ 𝛿𝑅𝑈𝑆𝐷,𝑤+ 𝜀𝑖,𝑤 (3)
Where:
𝑅𝑖,𝑤 is airline i’s weekly log stock price return for week w,
𝑅𝑀𝐾,𝑤 is the log return for the corresponding market index for week w,
𝑅𝐽𝐹,𝑤 is the weekly log change in jet kerosene prices for week w,
𝑅𝑈𝑆𝐷,𝑤 is the log change in the trade weighted U.S. dollar index for week w, 𝛽𝑖,𝑦 is the coefficient for the market risk factor for airline i for year y,
𝛾𝑖,𝑦 is the coefficient for jet fuel risk factor for airline i for year y, and
𝜀𝑖,𝑤 designates the error term of airline i on week w.
The dependent variable on this equation is 𝑅𝑖,𝑤, and the explanatory
For the estimation of this first equation, weekly stock prices and corresponding market indexes are gathered from Datastream in native currency. The same applies to the U.S. Gulf Coast and Singapore jet kerosene spot prices. As computed by Berghöfer & Lucey (2014), Singapore kerosene prices were used for Asian airlines and the Gulf Coast kerosene was attributed to European and North American carriers. Data used for computing 𝑅𝑈𝑆𝐷,𝑤 corresponds to
the “Trade Weighted U.S. Dollar Index: Broad, Index Jan 1997=100, Weekly, Not Seasonally Adjusted” and was retrieved from the website of the “Federal Reserve Bank of St. Louis – Economic Research”.
3.2.3.2 Second-step regression – Berghöfer & Lucey (2014)
The following step computes the regression of jet fuel yearly risk exposure coefficients, previously obtained in the first step, on a series of operational and financial hedging measures, added of some control variables. The following equations17 (4) and (5) are exactly the same Berghöfer & Lucey (2014) did, only
substituting ADI_M for ADI_F on Equation (5). On Section 3.2.3.3, there are presented own alternative versions for the second-step equation, including other variables, such as two additional measures of operational hedging.
|𝛾𝑖,𝑦| = 𝛼0 + 𝛼1(𝐻𝐷𝐺𝑃𝐸𝑅𝑖,𝑦) + 𝛼2(𝐻𝐷𝐺𝑀𝐴𝑇𝑖,𝑦) + 𝛼3(𝐴𝐷𝐼_𝑀𝑖,𝑦) + 𝛼4(𝐿𝑁𝑇𝐴𝑖,𝑦) + 𝛼5(𝐿𝑇𝐷𝐴𝑖,𝑦) + 𝛼6(𝐿𝑁𝐷𝐼𝑆𝑖,𝑦) + 𝛼7(𝐿𝐹𝑖,𝑦) + 𝜀𝑖,𝑦 (4) |𝛾𝑖,𝑦| = 𝛼0+ 𝛼1(𝐻𝐷𝐺𝑃𝐸𝑅𝑖,𝑦) + 𝛼2(𝐻𝐷𝐺𝑀𝐴𝑇𝑖,𝑦) + 𝛼3(𝐴𝐷𝐼_𝐹𝑖,𝑦) + 𝛼4(𝐿𝑁𝑇𝐴𝑖,𝑦) + 𝛼5(𝐿𝑇𝐷𝐴𝑖,𝑦) + 𝛼6(𝐿𝑁𝐷𝐼𝑆𝑖,𝑦) + 𝛼7(𝐿𝐹𝑖,𝑦) + 𝜀𝑖,𝑦 (5)
17 Note: Even though the coefficient terms are displayed with the same notation across
Where:
𝐻𝐷𝐺𝑃𝐸𝑅𝑖,𝑦 is the percentage of next year’s fuel requirements hedged by the airline i on the year y,
𝐻𝐷𝐺𝑀𝐴𝑇𝑖,𝑦 is the maximum maturity of fuel derivatives, in months, which the airline i has entered into, on year y,
𝐴𝐷𝐼_𝑀𝑖,𝑦 stands for the airline i's aircraft dispersion index on year y, in a particular version which considers the counting of aircraft models,
𝐿𝑁𝑇𝐴𝑖,𝑦 is the logarithm of total assets (included to control for firm size) of the
airline i on year y,
𝐿𝑇𝐷𝐴𝑖,𝑦 is the long-term debt to assets ratio (included to control for firm
leverage) of the airline i on year y,
𝐿𝑁𝐷𝐼𝑆𝑖,𝑦 is the logarithm of the average flight distance, in kilometers, for the airline i on the year y,
𝐿𝐹𝑖,𝑦 is the passenger load factor of the airline i on the year y, and 𝜀𝑖,𝑦 designates the error term of airline i on year y.
The dependent variable on this equation is the module of 𝛾𝑖,𝑦, and the
explanatory variables are 𝐻𝐷𝐺𝑃𝐸𝑅𝑖,𝑦, 𝐻𝐷𝐺𝑀𝐴𝑇𝑖,𝑦, 𝐴𝐷𝐼_𝑀𝑖,𝑦, 𝐿𝑁𝑇𝐴𝑖,𝑦, 𝐿𝑇𝐷𝐴𝑖,𝑦,
𝐿𝑁𝐷𝐼𝑆𝑖,𝑦 and 𝐿𝐹𝑖,𝑦.
The jet fuel price risk exposure 𝛾𝑖,𝑦 is considered in absolute values for the
second equation, once it is assumed this exposure to be diminished towards zero with the use of hedging procedures (Berghöfer & Lucey, 2014; Treanor et al., 2014b).
The natural logarithm of total assets (LNTA) is controlling for firm size18.
Haushalter (2000) concluded from an oil and gas producers’ sample that firms
18 The choice for controlling firm size with the log of total assets is made in accordance with Berghöfer & Lucey
with higher total assets have a greater likelihood of hedging, meaning larger firms tend to diminish more their exposure than smaller ones do. Nance, Smith, & Smithson (1993) provide steady findings on the relation between hedging with derivatives and firm size, while assuming that economies of scale could apply to hedging costs, this way existing a positive correlation between enterprise risk management and firm size.
Long-term debt to assets ratio (LTDA) is included to control for firm leverage. Here, the evidence is mixed. Tufano (1998b) verified that exposure has a positive relationship with firm leverage, while studying gold mining firms, and for that reason, Treanor et al. (2014b) include the variable LTDA on their equations, considering it could be applied the same reasoning to the airline industry. Still with the same results, Carter et al. (2006), while studying the U.S. airline industry, observe that firm leverage is negatively correlated with the volume of fuel hedged, and so, airlines with less financial constraints are the ones which hedge the most. On the other side, Haushalter (2000) find a positive relationship between firm leverage and the likelihood of hedging with derivatives, which ultimately means that higher leveraged firms tend to be less exposed to fuel by recurring to hedging.
Long-term debt to assets ratio (LTDA) and the logarithm of total assets (LNTA) are controlling for firm leverage, and size, respectively. Haushalter (2000) concluded from an oil and gas producers’ sample that firms with higher total assets and greater financial leverage have a greater likelihood of hedging.
The variable 𝐿𝑁𝐷𝐼𝑆 is used as control for some operational issues (Berghöfer & Lucey, 2014). As the average sector length increases, airlines have lower possibilities of using undiversified fleets on operation. For instance, EasyJet cannot operate long-haul flights with their aircrafts’ configurations. On the other side, Lufthansa has a much more diverse fleet and can operate short, medium and long-haul flights. Another situation regards tankering, which
means taking extra-fuel on the inbound flight, for the outbound trip also. This is carried out by airlines when it is not viable to refuel the aircraft at the destination, such as for fuel shortage or high fuel prices at destination. The further the outbound flight, the need for carrying more fuel, and less the opportunity to carry on fuel for the return flight. As discussed by Berghöfer & Lucey (2014), this can be applied to the load factor as well. The greater the number of passengers carried, the lower is the capability of carrying fuel for the outbound flight, given maximum takeoff weight restrictions (commonly known as MTOW).
In the cases where the variable 𝐿𝑁𝐷𝐼𝑆 cannot be withdrawn directly from the airlines’ annual reports or in its 10-K fillings, it can be computed through the following expression (Berghöfer & Lucey, 2014):
𝐿𝑁𝐷𝐼𝑆 = ln (𝑅𝑒𝑣𝑒𝑛𝑢𝑒 𝑝𝑎𝑠𝑠𝑒𝑛𝑔𝑒𝑟 𝑘𝑖𝑙𝑜𝑚𝑒𝑡𝑒𝑟𝑠/𝑚𝑖𝑙𝑒𝑠
𝑇𝑜𝑡𝑎𝑙 𝑛𝑢𝑚𝑏𝑒𝑟 𝑜𝑓 𝑝𝑎𝑠𝑠𝑒𝑛𝑔𝑒𝑟𝑠 ) (6)
Whenever required, if there is no disclosure on the “Revenue passenger kilometers/miles” variable, it can be computed by the following formula19
(when in miles, we use 𝑅𝑃𝑀 and 𝐴𝑆𝑀, instead of 𝑅𝑃𝐾 and 𝐴𝑆𝐾, respectively):
𝐿𝐹 =𝑅𝑃𝐾
𝐴𝑆𝐾 ⇔ 𝑅𝑃𝐾 = 𝐿𝐹 ∗ 𝐴𝑆𝐾 (7)
Where:
𝑅𝑃𝐾 is “Revenue Passenger Kilometers”, 𝐴𝑆𝐾 is the “Available Seat Kilometers”,
19 Retrieved from Aegean Airlines 2017 annual report. All the distances in miles were then converted in
𝐿𝐹 is the passenger load factor.
3.2.3.3 Alternative second-step regressions
This section presents some alternative second-step equations, contemplating more variables than Berghöfer & Lucey (2014) regressions. These include new variables controlling for two additional measures of operational hedging, being fleet-fuel efficiency, measured by the average fleet age, and the percentage of fleet held on operating leasing, as well as other control variables.
|𝛾𝑖,𝑦| = 𝜃0+ 𝜃1(𝐻𝐷𝐺𝑃𝐸𝑅𝑖,𝑦) + 𝜃2(𝐻𝐷𝐺𝑀𝐴𝑇𝑖,𝑦) + 𝜃3(𝐹𝑋_𝐷𝐸𝑅𝑖,𝑦) + 𝜃4(𝐼𝑅_𝐷𝐸𝑅𝑖,𝑦) + 𝜃5(𝐴𝐷𝐼_𝑀𝑖,𝑦) + 𝜃6(𝐿𝑁𝐴𝐺𝐸𝑖,𝑦)
+ 𝜃7(𝑂𝑃𝐿𝐸𝐴𝑆𝐸𝑖,𝑦) + 𝜃8(𝑇𝑈𝑅𝐵𝑂𝑃𝑅𝑂𝑃𝑖,𝑦) + 𝜃9(𝐿𝐹𝑖,𝑦)
+ 𝜃10(𝐿𝑁𝐷𝐼𝑆𝑖,𝑦) + 𝜃11(𝐿𝑁𝑇𝐴𝑖,𝑦) + 𝜃12(𝐶𝐹𝑆𝐴𝐿𝑖,𝑦) + 𝑢𝑖,𝑦
(8)
Where, besides the variables already explained on Chapter 3.2.3.2:
- 𝐹𝑋_𝐷𝐸𝑅𝑖,𝑦 is a dummy variable which takes the value 1 if the airline i enters
into foreign exchange derivatives in the year y, turning 0 if otherwise,
- 𝐼𝑅_𝐷𝐸𝑅𝑖,𝑦 is a dummy variable taking the value 1 if the airline i enters into
interest rate derivatives in the year y, turning 0 if otherwise,
- 𝐿𝑁𝐴𝐺𝐸𝑖,𝑦 is the logarithm of the average fleet age, in years, of airline i in the
year y,
- 𝑂𝑃𝐿𝐸𝐴𝑆𝐸𝑖,𝑦 stands for the percentage of fleet held in operating leasing of
airline i in the year y,
-𝑇𝑈𝑅𝐵𝑂𝑃𝑅𝑂𝑃𝑖,𝑦 is the percentage of turboprop aircrafts on the operating fleet of
airline i, in the year y,
- 𝐶𝐹𝑆𝐴𝐿𝑖,𝑦 is the cash-flow to sales ratio of the airline i in year y, and
Dummy variables FX_DER and IR_DER are included in a similar way as Treanor et al. (2013) did on their analysis of whether financial and operational hedges are complements of substitutes, while studying the U.S. airline industry. While they create a single dummy, taking the value 1 if an airline uses currency derivatives, interest rate derivatives or has entered into a fuel pass-through agreement, we discard this last agreement due to the difficulty of obtaining such data on European and Asian carriers, and split interest-rate and currency derivatives into two separate dummies. This was not a problem since their correlation is pretty low20. Treanor et al. (2013) include this variable to control
for relationships among fleets and the use of financial derivatives. These authors concretize, giving the example that airlines flying more international routes have a greater likelihood of entering into fuel and currency derivatives. They consider that the exclusion of this variable would cause bias on the diversity variable (ADI_M or ADI_F).
One of the operational hedges not studied by Berghöfer, is related with a fleet’s fuel-efficiency. This is an important hedge and can be easily proxied by the logarithm of the average fleet age (Treanor et al., 2013; Treanor et al., 2014b). In our study, we always consider fleets in operation.
The other operational hedge added in our equations is the percentage of a fleet that is held under operating leasing. This variable was included by Treanor et al. (2013) and measures airlines’ ability in response to high fuel prices or demand oscillations, which ultimately could diminish risk exposure.
The variable TURBOPROP is included since smaller aircrafts turbo-propelled cannot be considered substitutes for larger jets, once their range and speed does not allow them to operate the same routes. On the other side, we have regional jets, which even though they are smaller than narrow-body aircrafts, can service most of their routes (Treanor et al., 2014b).
Finally, the cash-flow to sales ratio is recommended by Froot et al. (1993) and included by Treanor et al. (2014a) as an inverse proxy for financial constraints. The latter explains that firms with a greater ability for generating cash-flows have less probabilities of facing “binding constraints” in financial investments. Carter et al. (2006) note that the higher a firm’s cash-flows, the higher are investment opportunities and the higher the likelihood of hedging. On the other side, Froot et al. (1993) states that firms will tend to hedge less, the higher the correlation between cash-flows and future investment opportunities. On the other side, firms will hedge more if their cash-flows are highly correlated with their ability of raising external finance.
From Equation 8 to Equation 9, the only difference is dropping the variable 𝐶𝐹𝑆𝐴𝐿𝑖,𝑦. |𝛾𝑖,𝑦| = 𝜃0+ 𝜃1(𝐻𝐷𝐺𝑃𝐸𝑅𝑖,𝑦) + 𝜃2(𝐻𝐷𝐺𝑀𝐴𝑇𝑖,𝑦) + 𝜃3(𝐹𝑋_𝐷𝐸𝑅𝑖,𝑦) + 𝜃4(𝐼𝑅_𝐷𝐸𝑅𝑖,𝑦) + 𝜃5(𝐴𝐷𝐼_𝑀𝑖,𝑦) + 𝜃6(𝐿𝑁𝐴𝐺𝐸𝑖,𝑦) + 𝜃7(𝑂𝑃𝐿𝐸𝐴𝑆𝐸𝑖,𝑦) + 𝜃8(𝑇𝑈𝑅𝐵𝑂𝑃𝑅𝑂𝑃𝑖,𝑦) + 𝜃9(𝐿𝐹𝑖,𝑦) + 𝜃10(𝐿𝑁𝐷𝐼𝑆𝑖,𝑦) + 𝜃11(𝐿𝑁𝑇𝐴𝑖,𝑦) + 𝑢𝑖,𝑦 (9)
Finally, Equation 10 is the same as the previous Equation 9, except for the fleet diversity proxy, having now included ADI_F instead of ADI_M21.
|𝛾𝑖,𝑦| = 𝜃0+ 𝜃1(𝐻𝐷𝐺𝑃𝐸𝑅𝑖,𝑦) + 𝜃2(𝐻𝐷𝐺𝑀𝐴𝑇𝑖,𝑦) + 𝜃3(𝐹𝑋_𝐷𝐸𝑅𝑖,𝑦) + 𝜃4(𝐼𝑅_𝐷𝐸𝑅𝑖,𝑦) + 𝜃5(𝐴𝐷𝐼_𝐹𝑖,𝑦) + 𝜃6(𝐿𝑁𝐴𝐺𝐸𝑖,𝑦) + 𝜃7(𝑂𝑃𝐿𝐸𝐴𝑆𝐸𝑖,𝑦) + 𝜃8(𝑇𝑈𝑅𝐵𝑂𝑃𝑅𝑂𝑃𝑖,𝑦) + 𝜃9(𝐿𝐹𝑖,𝑦) + 𝜃10(𝐿𝑁𝐷𝐼𝑆𝑖,𝑦) + 𝜃11(𝐿𝑁𝑇𝐴𝑖,𝑦) + 𝑢𝑖,𝑦 (10)
21 Note: Even though the coefficient terms are displayed with the same notation across Equations 8-10, their
3.2.4 Hypotheses
Based on the literature review present in Chapter 2, and completing with the analysis performed on Chapter 3.2.3.2, here follows our predictions of the coefficient signs for Equation 4, on the table below.
Table 3: Prediction of coefficient signs for the variables used on the estimation of Equations 4-5.
Variables Predicted Coefficient Signs
HDGPER (percentage of next year’s fuel hedged) -
HDGMAT (max. maturity of fuel derivatives – months) -
ADI_M (aircraft dispersion index – counting for models) - ADI_F (aircraft dispersion index – counting for families) -
LNTA (logarithm of total assets) -
LTDA (Long-Term Debt to Assets) ?
LNDIST (logarithm of the average flight distance – kms) +
LF (passenger load factor) -
Source: Own figure.
Following the same line of thought as in Berghöfer & Lucey (2014), in order to assess the impact of financial and operational hedging in the risk exposure airlines face, the following hypotheses are to be tested:
H1: Airline companies are equally exposed to jet fuel prices regardless the
continent where they are based (𝛾𝐸𝑈,𝑦 = 𝛾𝑁𝐴𝑀,𝑦 = 𝛾𝐴𝑆𝐼𝐴,𝑦).
H2: Financial hedging diminishes airlines’ fuel price risk exposure (𝛼1 < 0).
H3: Airlines experience a higher reduction in risk exposure, the wider its fleet
diversity (𝛼3 < 0).
H4: Airline companies’ fuel exposure increases with higher average flight
distances (𝛼6 > 0).
Furthermore, we can also predict the signs for the variables added on Equations 8-10.
Table 4: Prediction of coefficient signs for the variables estimated on Equations 8-10.
Variables Predicted Coefficient Signs
FX_DER (dummy for the use of currency derivatives) -
IR_DER (dummy for the use of interest rate derivatives) -
LNAGE (logarithm of the average fleet age in years) +
OPLEASE (% of fleet held in operating leasing) -
TURBOPROP (% of turboprop aircrafts on the total fleet) ?
CFSAL (cash-flow to sales ratio) ?
Source: Own figure.
Given the additional variables included in our models, some additional hypotheses can be formulated:
H6: Airlines’ exposure to fuel prices increases with fleet’s average age (𝜃6 > 0).
H7: Airlines’ exposure to fuel prices decreases with the percentage of aircrafts
held in operating leasing (𝜃7 < 0).
H8: Airlines entering into currency derivatives are more likely to hedge with
fuel derivatives, consequently their exposure is expected to decrease (𝜃3 < 0).
H9: Airlines entering into interest rate derivatives are more likely to hedge with
Given we have a dummy variable in our data for differentiating between premium airlines and LCC, it should be interesting testing for the following hypothesis:
H10: Airline companies are equally exposed to jet fuel prices regardless they are
Chapter 4
Results and Discussion
In the present chapter, are presented descriptive statistics for financial and operational hedging variables, as well as statistics regarding passenger load factor. This is followed by the results of the first-step equation, and finalized with the results for several second-step equation versions, the first six replicating Berghöfer & Lucey (2014) and three more formulations we propose.
4.1 Descriptive Statistics
4.1.1 Financial Hedging
Of the total 440 annual reports and 10-K fillings analyzed, 57 had no information regarding the instruments used, 164 did not report the underlying commodity used on fuel hedging, and 89 did not report derivatives’ maturities.
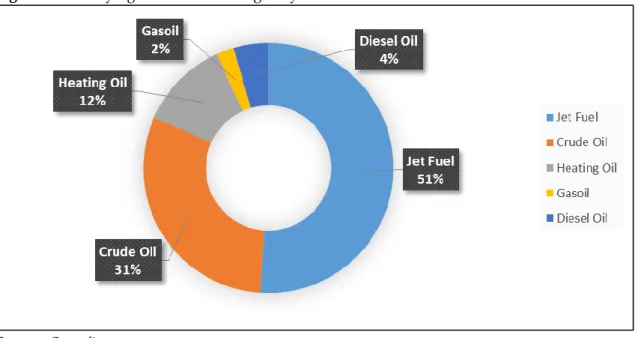
Figure 3: Underlying commodities hedged by airlines between 2007 and 2017.
Source: Own figure.
Note: Based on 276 observations.
From the figure above it can be perceived that jet fuel still represents the main commodity used as an underlying, with a global value of 51%, once Berghöfer & Lucey (2014) reported approximately 42% for the period 2002-2012, although with a slightly different sample. The second and third choice for airlines are noticed to be crude oil, with 31 percent, followed by heating oil with 12 percent, maintaining the same ranking of Berghöfer & Lucey (2014). Finally, the two less used underlyings are diesel oil and gasoil, with approximately 4 and 2 percent, respectively.
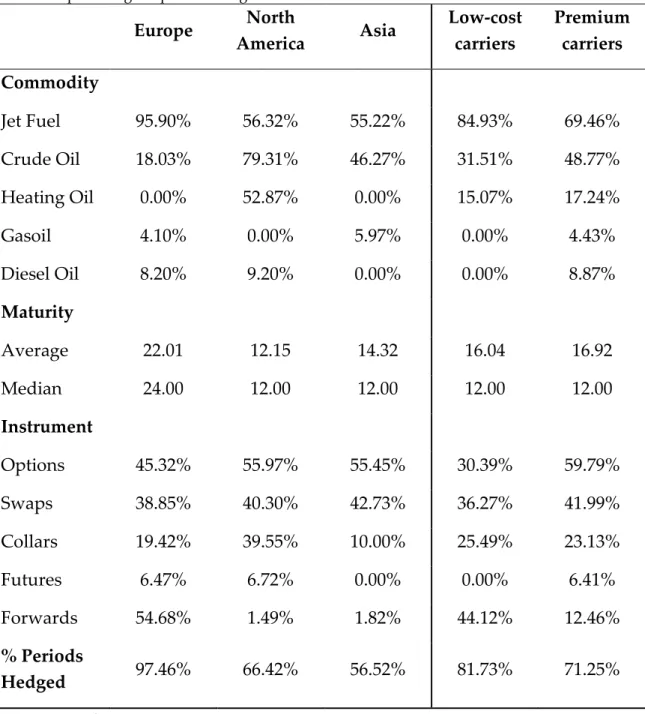
Table 5: Overview per continent, as well as comparing low-cost carriers against premium
airlines, on the underlying commodities, maturities and instruments used over the period 2007-2017. The percentage of periods hedged is also included.
Europe North America Asia Low-cost carriers Premium carriers Commodity Jet Fuel 95.90% 56.32% 55.22% 84.93% 69.46% Crude Oil 18.03% 79.31% 46.27% 31.51% 48.77% Heating Oil 0.00% 52.87% 0.00% 15.07% 17.24% Gasoil 4.10% 0.00% 5.97% 0.00% 4.43% Diesel Oil 8.20% 9.20% 0.00% 0.00% 8.87% Maturity Average 22.01 12.15 14.32 16.04 16.92 Median 24.00 12.00 12.00 12.00 12.00 Instrument Options 45.32% 55.97% 55.45% 30.39% 59.79% Swaps 38.85% 40.30% 42.73% 36.27% 41.99% Collars 19.42% 39.55% 10.00% 25.49% 23.13% Futures 6.47% 6.72% 0.00% 0.00% 6.41% Forwards 54.68% 1.49% 1.82% 44.12% 12.46% % Periods Hedged 97.46% 66.42% 56.52% 81.73% 71.25%
Source: Own figure.
Table 5 allows a wide analysis on multiple aspects of airlines’ choices for commodity, maturity and instruments used on fuel hedging.
Both in Europe and Asia, the main choice for underlying asset is jet fuel, with 95.90 percent of European carriers having hedged jet fuel during the years 2007-2017. This value drops to 55.22 percent when mentioning Asian carriers,