Universidade Católica Portuguesa
Faculdade de Engenharia
Fourier Transform Infrared Spectroscopy, a powerful tool to
monitor biopharmaceuticals production
Kevin Costa Sales
Dissertação para obtenção do Grau de Mestre em Engenharia
Biomédica
Mestrado em Engenharia Biomédica
Especialização em Engenharia Biomolecular, de Tecidos e de Órgãos
Júri
Prof. Doutor Manuel José Martinho Barata Marques (Presidente)
Prof. Doutor Luís Joaquim Pina da Fonseca
Doutora Carla Maria Cadete Martins Moita Brites
Prof.ª Doutora Cecília Ribeiro da Cruz Calado (Orientadora)
To BestGFriend,
my parents and
my grandparents.
i
Resumo
A Escherichia coli é o microorganismo mais usado como hospedeiro para a produção de produtos recombinantes, tais como plasmídeos usados para terapia génica e vacinação de ADN. Desta forma, torna-se importante compreender as relações metabólicas complexas e a bioprodução de plasmídeo, que ocorre em ambientes de cultura dinâmicos, a fim de controlar e optimizar o desempenho do sistema de expressão recombinante. O objectivo principal deste trabalho consiste em avaliar a potencialidade da espectroscopia FT-IR para monitorizar e caracterizar a produção do plasmídeo pVAX-LacZ em culturas recombinantes de E. coli, nomeadamente para extrair informação relacionada com as variáveis críticas (biomassa, plasmídeo, fontes de carbono e acetato) e informação metabólica da célula hospedeira E. coli. Para tal, culturas de E. coli com diferentes concentrações de glucose e glicerol e diferentes estratégias de cultivo (batch e fed-batch) foram monitorizadas por espectroscopia de infravermelho perto (NIR) e de infravermelho médio (MIR).
Tanto a espectroscopia NIR com a MIR permitiram extrair informação sobre as variáveis críticas do bioprocesso, através da construção de modelos de regressão por mínimos quadrados parciais, que resultaram em elevados coeficientes de regressão e baixos erros de previsão. A abordagem NIR apresenta a vantagem de aquisição em tempo real das variáveis do bioprocesso, já a abordagem MIR permite a leitura simultânea de centenas de amostras de várias culturas ao mesmo tempo através do uso multi-microplacas, sendo muito vantajosa nos casos de micro-bioreactores usados para optimização. Para além disso, como os espectros MIR apresentam mais informação do que os espectros NIR, uma vez que representam os modos de vibração fundamentais das biomoléculas, enquanto que os espectros NIR representam sobreposições e combinações de vibrações, os dados espectrais MIR também permitiram a aquisição de informação bioquímica ao longo das culturas de E. coli a partir da análise das componentes principais (PCA) bem como do estudo das características bioquímicas, tais como as reservas de glicogénio e os níveis de transcrição aparente.
Portanto, a espectroscopia FT-IR apresenta assim características relevantes para a compreensão e monitorização do processo de produção de culturas recombinantes, sendo, de acordo com Quality-by-Design e Process Analytical Technology, muito importante para fins de controlo e optimização.
Palavras-chave: Escherichia coli, espectroscopia MIR, espectroscopia NIR, caraterização
iii
Abstract
Escherichia coli is the most used microorganism as host for the production of recombinant
products, such as plasmids used for gene therapy and DNA vaccination. Therefore, it is important to understand the complex metabolic relationships and the plasmid bioproduction process occurring in dynamic culture environments, in order to control and optimize the performance of the recombinant expression system. The main goal of this work is to evaluate the potential of Fourier Transform Infrared (FT-IR) spectroscopy to monitor and characterize recombinant E. coli cultures producing the plasmid model pVAX-LacZ, namely to extract information concerning the critical variables (biomass, plasmid, carbon sources and the by-product acetate) and metabolic information regarding the host E. coli. To achieve that cultures of E. coli conducted with different mixture of glucose and glycerol and different cultivation strategies (batch and fed-batch) were monitored in-situ by a fiber optic probe in near- infrared (NIR) and of the cell pellets in at-line in high-throughput mode by mid-infrared (MIR) spectroscopy.
Both NIR and MIR spectroscopy setup enabled to extract information regarding the critical variables of the bioprocess by the implementation of partial least square regression models that result in high regression coefficients and low prediction errors. The NIR setup presents the advantage of acquiring in real time the knowledge of the bioprocess variables, where the at-line measurements with the MIR setup presents more advantageous in cases of micro-bioreactors used in optimization protocols, enabling the simultaneously information acquisition of hundreds samples by using multi-microplates. Furthermore, as the MIR spectra presents more information than the NIR spectra, since it represents the fundamental vibration modes of biomolecules while the NIR spectra represents overtones and combinations of vibrations, the MIR data also enabled to acquire biochemical information along the E. coli cultures as pointed out in an principal component analysis and by the estimation of biochemical features as glycogen reserves and apparent transcriptional levels.
Therefore, FT-IR spectroscopy presents relevant features towards the understanding and monitoring of the production process of recombinant cultures for control and optimization purposes, in according to the Quality-by-Design and the Process Analytical Technology.
Keywords: Escherichia coli, MIR spectroscopy, NIR spectroscopy, metabolic profiling,
v
Acknowledgments
I would like to express my sincere gratitude to my advisors, Prof. Cecília Calado, Dr. Marta Belchior Lopes and Prof. Pedro Sampaio, for their continuous support, patience and motivation. It is an honor to work with all of you!
I would also like to thank Professor Manuel Barata Marques, Director of the Faculdade de
Engenharia, Universidade Católica Portuguesa, for all the understanding and support from the
first day of classes to the last days of my Master’s Thesis!
To Professor António Mendonça from Universidade da Beira Interior thanks for providing technical support.
To Instituto Nacional de Saúde Dr. Ricardo Jorge, and within to Dr. Jorge Machado, Dr. João Brandão, Dr.ª Helena Rebelo and Dr.ª Raquel Rodrigues for collaboration and technical support. I also thank Fundação para a Ciência e Tecnologia (FCT) and Agência de Inovação for supporting this work by the project PTDC/BIO/69242/2006 and CLARO, respectively.
To Filipa, my colleague, thank you for helping with data interpretation and also for all the support and patience along the Master’s Thesis!
To all of my friends, not only who shared this academic journey with me, especially João Mesquita, Sónia Vaz, Catarina Gama, Gonçalo Condeço, André Valério and Maria Raimundo, but only who are always present in my heart, a great “thank you” for supporting me unconditionally, making me to smile and giving me the strength to continue.
To my beloved girlfriend, Vânia, the greatest thanks for all the unconditionally support, I am truly sure that I could not have made it without you! You are my motivation in everything I do and I will be eternally grateful.
I would also like to thank Vânia’s parents who believe me and in my own capabilities, and, of course, for supporting me.
Last, an enormous thanks to my family. You supported me despite of anything, specially my bad temper! Parents, thank you for allowing me to have an education.
vii
Table of Contents
Resumo ... ii
Abstract ... iii
Acknowledgments ... v
Table of Contents ... vii
List of Figures ... ix
List of Tables ... xi
Nomenclature and Abbreviations ... xiii
Chapter I: Thesis Overview... 1
I.1. Objectives ... 1
I.2. Thesis Outline ... 1
Chapter II: General Introduction ... 3
II.1. E. coli recombinant systems and bioprocesses monitoring ... 3
II.2. Infrared Spectroscopy ... 5
II.3. Chemometrics ... 11
Chapter III: In-situ near-infrared (NIR) versus high-throughput mid-infrared (MIR) spectroscopies to monitor biopharmaceuticals bioproduction ... 19
Abstract ... 19
III.1. Introduction ... 21
III.2. Materials and Methods ... 24
III.3. Results and Discussion ... 28
Chapter IV: Metabolic profiling of recombinant cell cultivations based on high-throughput FT-IR spectroscopy analysis ... 41
Abstract ... 41
IV.1. Introduction ... 42
IV.II. Materials and Methods ... 44
viii
IV.4. Conclusions ... 60 Chapter V: General Conclusions ... 61 References ... 63
ix
List of Figures
Figure II.1: Important factors in the monitoring and control of plasmid production, in bioreactors
... 4
Figure II.2: Electromagnetic spectrum with IR region highlighted ... 5
Figure II.3: Main molecular vibrational modes ... 6
Figure II.4: Scheme of the Michelson interferometer ... 8
Figure III.5: Evolution along the time of the biomass, glucose, glycerol, acetate and plasmid concentrations for the three cultures (A to C), conducted with a C-source composition on the batch phase of glycerol (culture A), glucose (culture B) and glucose and glycerol (culture C) ... 30
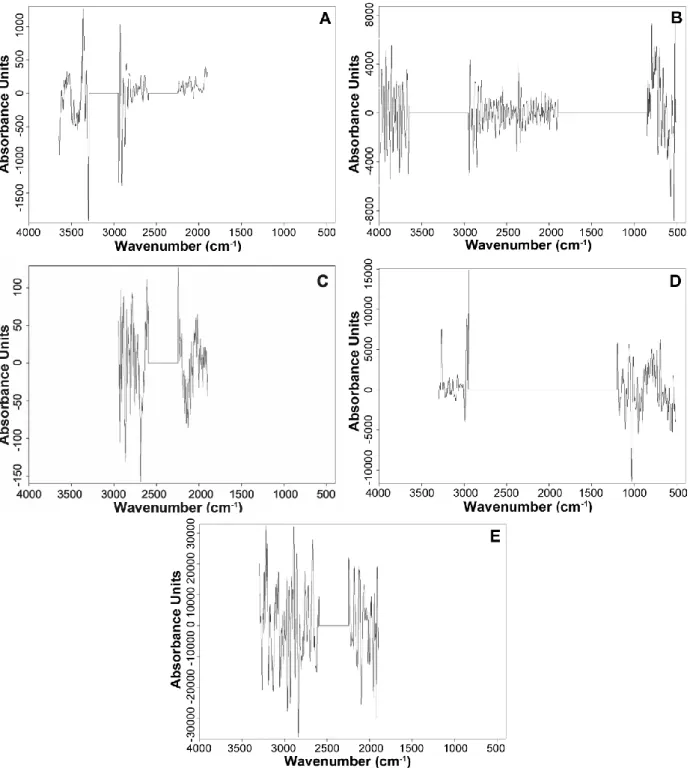
Figure III.6: Examples of MIR and NIR spectra acquired during bioprocess monitoring ... 32
Figure III.7: True and predicted biomass, glucose and plasmid concentrations obtained by the PLS regression model based on the MIR spectra ... 34
Figure III.8: PLS regression vectors obtained from MIR models ... 35
Figure III.9: PLS regression vectors obtained from NIR models ... 37
Figure III.10: True and predicted biomass, glucose and plasmid concentrations obtained by the PLS regression model based on the NIR spectra ... 38
Figure IV.11: Evolution along the time of the biomass, glucose, glycerol, acetate and plasmid concentrations for the two cultures (A to B), conducted with a C-source composition on the batch phase of glycerol (culture A) and glucose and glycerol (culture B) ... 49
Figure IV.12: IR spectra from different samples in different stages of the bioprocess: without pre-processing; with baseline correction and MSC; and with baseline correction, MSC and normalization to amide II band ... 51
Figure IV.13: Principal components analysis of the batches cultures A and B... 52
Figure IV.14: IR spectrum of a sample of the culture A and the reversed second derivative spectrum of the same sample, and an amplification of the spectral region between 1000 and 1185 cm-1 ... 52
Figure IV.15: The reversed second derivative spectrum of a given sample with the presentation of the peaks identified, followed by IR spectrum of the same sample with the deconvoluted peaks, after the deconvolution process ... 53
x
Figure IV.16: Glycogen levels along the cultivations A and B ... 55
Figure IV.17: RNA concentration in the host cell along the cultivation A and B ... 56
Figure IV.18: Intensities of the amide I bands along the cultivations A and B ... 57
Figure IV.19: Intensities of the lipids bands along the cultivations A and B ... 58
Figure IV.20: Intensity ratio of the 1111 cm-1 and amide II along the cultivations A and B ... 59
xi
List of Tables
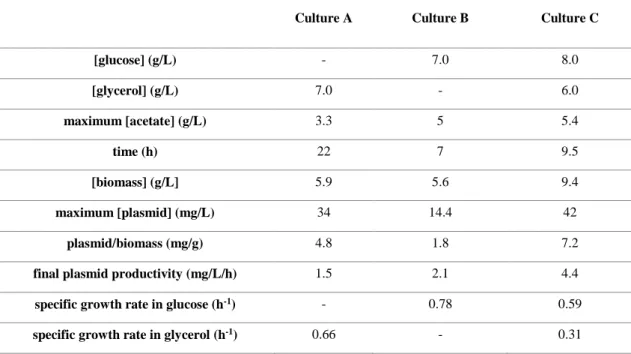
Table III.1: Description of the three batches cultures conducted with mixtures of glucose and glycerol as carbon source ... 31 Table III.2: Description of the two fed-batches cultures conducted with mixtures of glucose and glycerol as carbon source ... 31 Table III.3: Best MIR PLS regression models for biomass, plasmid, glucose, glycerol and acetate concentrations concerning the R2, the RMSE, the number of latent variables used, the pre-processing technique and the selected spectral regions for culture A, B and C ... 33 Table III.4: Best NIR PLS regression models for biomass, plasmid, glucose, glycerol and acetate concentrations concerning the R2, the RMSE, the number of latent variables used, the pre-processing technique and the selected spectral regions for culture A, B and C ... 38 Table IV.5: Description of the two batches cultures conducted with mixtures of glucose and glycerol as carbon source ... 50 Table IV.6: The identified bands and its proposed assignment according to the literature. ... 54 Table IV.7: Specific growth rates in the different consumption phases of the cultures A and B ... 55
xiii
Nomenclature and Abbreviations
µ - specific growth rate Ace - acetate
ACKA - acetate kinase C-source(s) - carbon source(s) DCW - dry cell weight
DOC - dissolved oxygen concentration EMA - European Medicines Agency FDA - Food and Drug Administration FT-IR - Fourier Transform Infrared Glu - glucose
Gly - glycerol
HPLC - high performance liquid chromatography IR - infrared
LOO - leave-one-out lv - latent variable max - maximum MIR - mid-infrared
MSC - multiplicative scatter correction NIR - near-infrared
OD - optical density
PAT - Process Analytical Technology PC - principal component
PCA - principal component analysis PLS - partial least squares
PTA - phosphotransacetylase QbD - Quality-by-Design
R2 - coefficient of determination RMSE - root mean square error RPM - rotation per minute S - substrate
SNR - signal-to-noise ratio SNV - standard normal variate
xiv
v/v - volume/volume w/v - weight/volume
1
Chapter I
Thesis Overview
I.1. Objectives
The main goal of the present work was to evaluate the potential of Fourier Transform Infrared (FT-IR) spectroscopy to monitor and characterize recombinant Escherichia coli cultures during the production of biopharmaceuticals, namely the production of a plasmid model used for the construction of DNA vaccines. For that, i) first, the critical variables of the bioprocesses studied (e.g., host cell growth, plasmid production, carbon sources consumption and the by-product acetate production and consumption) were monitored based on infrared (IR) spectral data acquired along the cultivation time based on mid-infrared (MIR) spectroscopy of the cell pellets in high-throughput analysis using multi-microplates, and on near-infrared (NIR) spectroscopy by the cultivation in-situ analysis using a fiber optic probe; ii) second, metabolic information regarding, e.g., lipids, proteins, nucleic acids, glicids and other chemical species present in cells, was extracted from the MIR spectra for metabolic profiling of the host cell, as the MIR spectra represents the fundamental vibration modes of biomolecules.
I.2. Thesis Outline
The thesis is divided into 5 chapters. A general introduction is presented in chapter II, which contains a brief introduction to the E. coli systems and bioprocesses’ monitoring, an overview on IR spectroscopy and a short introduction to chemometrics and spectral analysis. The following two chapters, chapters III and IV, describe the experimental work developed. Chapter III presents a comparative study of MIR and NIR spectroscopies for monitoring the critical variables involved in the production of a biopharmaceutical (e.g., the host cell growth, the production of plasmid, the carbon sources consumption (glucose and glycerol) and the by-product acetate production and consumption) by different recombinant E. coli cultures producing the plasmid pVAX-LacZ. Chapter IV describes the potential of FT-IR spectroscopy for estimating the metabolic profiles of, e.g., lipids, proteins, nucleic acids, glicids, and other biochemical information from the host cell along the cultures. The last chapter, chapter V, comprises the main conclusions of the previous chapters and presents new research directions for future work.
3
Chapter II
General Introduction
II.1. E. coli recombinant systems and bioprocesses monitoring
The growing interest in biopharmaceutical products calls for a need for developing reproducible, reliable and cost-effective production processes. An example of such products are plasmids, which can be used as vectors for gene therapy and DNA vaccination, as an alternative to viral based vectors [Carnes, 2005; Prather et al., 2003].
Recombinant E. coli is the most used microorganism for plasmid production, given its capacity to growth under a wide range of conditions, from rich complex organic media to salt-based chemically defined media, as well as it is ease manipulation by genetic engineering [Moen et al., 2009; Prather et al., 2003; Scholz et al., 2012; Yang, 1999]. As a consequence of the current growing interest on plasmids, their production has to meet the market requirements, i.e., the optimization and efficiency of plasmid production are required, as well as the monitoring of the bioproduction process. Generally, the main goals for an optimization procedure for recombinant
E. coli cultures are (Figure II.1) [Carnes, 2005; Voss et al., 2003]:
Maximize the plasmid production in the supercoiled conformation, the most efficient conformation in relation to circular and linear conformations for therapeutic applications, according to Food and Drug Administration (FDA) and European Medicines Agency Home (EMA);
Maximize the plasmid concentration;
Maximize the productivity;
Maximize the biomass per carbon source yield, to make the best use of nutritional media;
Maximize the specific yield, i.e., the quantity of plasmid produced per cell, in order to simplify the purification processes.
4
Nevertheless, differences in the cultivation strategies adopted (e.g., batch and fed-batch) and environmental conditions and medium composition with respect to the carbon source (glucose or glycerol) influence the stability and expression of the cloned gene product, and consequently the optimization of the plasmid production processes [O’Kennedy et al., 2003; Ow et al., 2007; Ow
et al., 2009]. Furthermore, the characteristics of the plasmid and host cell are critical factors that
should be carefully evaluated [McNeil and Harvey, 1990].
Therefore, to control and optimize the performance of recombinant systems, the complex interrelationships between these factors and its effects must be well understood towards a more economic and robust process that ensures reproducibility and quality of the final product, in accordance to the Process Analytical Technology (PAT) initiative launched in 2004 by FDA. The PAT initiative encourages biopharmaceutical companies to adopt modern bioprocess monitoring tools based on at-line or in-situ analyses of critical parameters along the manufacturing processes, thus enabling the formulation of mathematical models through of the complex datasets acquired along of all process stages, towards more robust control and optimization processes [FDA, 2004]. IR spectroscopy is an example of a powerful tool for bioprocesses’ monitoring, which perfectly matches the PAT initiative and presents promising capabilities to serve the above purposes, as described next.
Figure II.1: Important factors in the monitoring and control of plasmid production, in bioreactors.
5
II.2. Infrared Spectroscopy
II.2.1. Theory of the Infrared Spectroscopy
Originally, spectroscopy was defined the study of the interaction between electromagnetic radiation and matter as a function of wavelength. Afterwards, the concept was expanded to include the measurement of any property, as a function of wavelength or frequency [Lourenço et
al., 2012]. All electromagnetic spectroscopic techniques work on the same principle, i.e., under
certain conditions, the materials interacting with the radiation, absorb or emit energy. However, some materials can also reflect and/or disperse/diffract radiation. Absorption spectroscopy is based on the measurement of the radiation that is emitted by the light source but attenuated by the sample, while emission spectroscopy is based on the measurement of the radiation that is produced by the sample on excitation. The reflection and diffraction of the radiation essentially depends on the materials’ surface and composition, shape and microstructure of the sample, respectively [Nicolaï et al., 2007].
IR spectroscopy is a spectroscopic technique that uses the infrared region of the electromagnetic spectrum. The IR region ranges from 14000 to 4 cm-1 (0.7 to 250 µm) and is surrounded by the visible and microwave regions, as shown in the figure II.2. The IR region is further subdivided in the near infrared (NIR), the mid infrared (MIR) and the far infrared (far-IR) regions. MIR represents the region of the IR spectrum between 4000 and 400 cm-1, whereas the NIR region is between 14000 and 4000 cm-1 (Figure II.2). Both regions will be discussed along this work, as they represent the IR radiation that are most used in several applications of spectroscopy [Landgrebe et al., 2010; Smith, 2011].
6
Photon energies associated with the infrared region of the electromagnetic spectrum are not large enough to excite electrons, rather they induce vibrational excitation of covalently bonded molecules. At temperatures above absolute zero, all atoms in molecules are in continuous vibration with respect to each other. Therefore, in IR spectroscopy, when a sample is irradiated by IR light, the absorption of this radiation results in changes in the vibrational modes of the molecules, which are sensible to the IR light and are presented in the sample. However, the absorption of IR only occurs when the radiant energy matches the energy of the specific molecular vibration, and the covalent bond of a molecule must undergo a net change in dipolar moment, as a consequence of its vibrational motion. The changes in the vibrational modes of the molecules produce the bands seen in the IR spectrum, with each band being characterized by a frequency and an amplitude [Babrah, 2009; Duygu, 2009].
Considering the changes in the vibrational modes of the molecules, there are essentially two types of vibrations, which can be classified depending on changes on the bond length or angle: stretching and bending vibrations (Figure II.3). The stretching is a symmetric or antisymmetric rhythmical movement along the bond length. The bending vibration occurs when there is a change of the angle between two atoms or a group of atoms [Babrah, 2009].
7
Therefore, an IR spectrum is characteristic of each kind of molecule, since it depends mainly on the mass of the atoms, their geometric arrangement and the bound forces between them. Consequently, each molecule presents a distinct IR spectrum, since there are no different molecules that have the same three characteristics previously presented. When that concept is extended two different samples, which have distinct molecular composition, different spectra will also be obtained, thus enabling to distinguish, qualify or quantify virtually any type of sample [Smith, 2011].
The application of the IR spectroscopy in the biological field is possible, because certain regions of the IR spectrum have been attributed to certain molecular bonds and combinations of atoms, and the composition of every biomolecules is known, thus being possible to associate the biomolecules to certain IR region, especially in MIR region. Despite of the complex composition of biological samples and the presence of several biomolecules in the samples, it can be observed that the strongest vibrational frequencies correspond to macro-biomolecules, such as proteins, lipids, carbohydrates and nucleic acids [Smith, 2011], due to its high concentration in the cell, when compared to other biomolecules.
II.2.2. Instrumentation
The instrument used in IR spectroscopy is called infrared spectrometer or, more precisely, spectrophotometer, and consists mainly in a beam source, a monochromator or an interferometer, depending on the type of spectrometer, a sample holder or sample presentation interface and a detector, which detects the radiation that is transmitted or reflected by the sample [Reich, 2005].
Considering the beam source, it may consist on an inert solid thermally heated [Hsu, 1997] or in an incandescent filament, like tungsten or quartz/halogen lamps, for the NIR region, and carbon-silicon bars, for the MIR region [Christian, 1994].
The existing detectors are essentially of two types: thermal detectors, which measures the heat produced by the IR radiation when in contact with the sample, and photon detectors that are based on the interaction of IR light with semiconductor materials, allowing the excitation of electrons and the generation of a small quantifiable electrical current [Hsu, 1997].
Another important component of the spectrometer is the monochromator or the interferometer, which enables the light modulation and defines the type of spectrophotometer. There are mainly two types of spectrometers: Dispersive Infrared Spectrometers and Fourier Transform Infrared Spectrometers. In both configurations the beam source, detectors and sample holders used are essentially the same.
The Dispersive Infrared Spectrometers were the first kind of spectrophotometers developed, using a monochromator in its configurations. A monochromator is a device used to separate a
8
range of radiations in a certain range of wavelengths or frequencies. The most common monochromator are prism and gratings coupled with systems of mirror and filters [Stuart, 2004]. The introduction of interferometry brought significant improvements to IR spectroscopy and the monochromator has been substituted by the interferometer. An interferometer measures the interference pattern between two light beams. After entering in the interferometer, the IR radiation is divided in two beams that will travel by different paths. Before leaving the interferometer, these two beams will be merged in a single beam again. The development of interferometers opened the window to the Fourier Transform Infrared (FT-IR) spectrometers.
The first spectrometer with interferometer to be developed was a Michelson interferometer and the current interferometers are based on the same principle. The Michelson interferometer consists of four active components: a collimating mirror, a moving mirror, a fixed mirror oriented perpendicularly and a beamsplitter (Figure II.4). The collimating mirror collects the IR light from the source and makes its rays parallel to each other, while directing them to the beamsplitter. The beamsplitter splits the radiation from collimating mirror in two beams, with half the IR beam being transmitted to the fixed mirror and the other half reflected to the moving mirror. These beams recombine at the beamsplitter, but the difference in paths lengths creates constructive and destructive interference: an interferogram. The recombined beam passes through the sample, which absorbs all the different wavelengths characteristic of its spectrum, and this subtracts specific wavelengths from the interferogram. A mathematical operation, known as a Fourier transformation, converts the interferogram (a time domain spectrum displaying intensity versus time within the mirror scan) to the final IR spectrum, which is the frequency domain spectrum showing intensity versus frequency [Smith, 2011; Stuart, 2004].
9
When compared to dispersive systems, the development of FT-IR spectrometers and their implementation contributed to high reproducibility and low sampling noise, while making
sample analysis faster [Hsu, 1997; Pistorius, 1995]. The low sampling noise is maybe the mains
contribution of the FT-IR spectrometer, since it allows more sensitive measurements and,
consequently, less noisy spectra with smaller peaks becoming evident.
As the amount of signal in a spectrum is highly dependent on the amount of light that reaches the detector, the signal-to-noise ratio (SNR) in FT-IR spectrometers is higher than in the
dispersive spectrometers. This is due to the fact that in the dispersive spectrometers the beam
needs to travel through prisms, slits and gratings, before reaching the sample and, consequently, the final beam that is detected have a much lower intensity, compared to the beam that leaves the source and, consequently, the final spectrum has a lower SNR [Smith, 2011].
II.2.3. Types of acquisition
Depending on the sample properties, the spectral data can be acquired essentially by two
different modes: transmission and reflection.
In transmission mode, IR radiation passes through the sample and the decrease in the radiation intensity due to absorption or scattering by the sample is measured. Therefore, the spectrum obtained is the result of the radiation that passes through the sample (that is proportional to the radiation absorbed by the sample) as function of wavelength, and depends of the radiation’s pathlength [Hsu, 1997].
In reflectance mode, the ratio of the intensity of the radiation reflected by a sample to the radiation reflected by a background reflective surface is measured. This acquisition mode is useful when the sample absorbs too much or too less energy, as well as in cases where samples reflect the majority of the incident radiation.
Though transmission and reflectance are the main acquisition modes, transflection has been increasingly being used in NIR spectroscopy applications. It combines the transmittance and reflectance measurements, i.e., the IR radiation is transmitted through a sample and the unabsorbed radiation is reflected back from a mirror or a diffuse reflectance surface placed at the end of the probe [Lourenço et al., 2012].
10
II.2.4. Mid-Infrared Spectroscopy
MIR spectroscopy is an extremely reliable and widely recognized fingerprinting technique. Many compounds can be characterized, identified and quantified by this method, since it is in the MIR region, between 4000 cm-1 and 400 cm-1, where most of the fundamental structural information is produced, therefore presenting enhanced sensitivity and selectivity and more distinctive spectral features, when compared to NIR spectroscopy [Smith, 2011]. Another important particularity of MIR spectroscopy is that it can be applied in an automatable way with high-throughput instruments [Scholz et al., 2012].
Nevertheless, an important disadvantage of the use of MIR spectroscopy is related to the fact that MIR region presents higher interference by water than NIR region, being usually necessary to dehydrate the samples before spectral acquisition [Landgrebe et al., 2010]. Furthermore, MIR radiation has a shorter wavelength than NIR radiation and consequently less energy, so the ability of this kind of radiation to penetrate the sample is reduced. The difficulty of transport and to obtain remote measures is also a disadvantage of the MIR radiation.
MIR spectroscopy allows a rapid acquisition of spectra, no sample preparation is necessary, beside the dehydration step for aqueous samples, and it is a non-invasive method, which is extremely useful when the sample preservation is required. However, spectra can be changed due to fluctuations in the equipment’s environment and sometimes chemometric methods are necessary, in order to extract all information contained in a spectrum.
II.2.5. Near-Infrared Spectroscopy
NIR spectroscopy is a spectroscopic method that uses the NIR region of the electromagnetic spectrum from 14000 to 4000 cm-1 [Smith, 2011]. This technique is usually applied for aqueous in-situ analyses, given the low adsorption coefficient of NIR radiation and the low interference of water in this IR region, when compared with MIR region. NIR spectroscopy allows the direct analysis of samples that are highly absorbing or strongly light scattering without dilution or extensive preparation. Nevertheless, most bands in NIR region are consequence of overtones and combinations of vibrations from different chemical elements and functional group, which makes NIR spectroscopy less sensitive and informative than MIR spectroscopy. Since NIR spectroscopy is less sensitive and its spectra are visually poor, it is often necessary to apply chemometric methods to extract meaningful information from the data [Hall et al., 1996; Lourenço et al., 2012; Shenk et al., 2001].
11
Given the low interference of water in the NIR region, NIR spectroscopy can be used non-destructively for monitoring bioprocesses, by placing of a fiber optic probe inside the bioreactor. Other particularities of this technique are the fact that the NIR radiation presents a greater penetration power, since it is little absorbed by sample, and can be easily transported by optical fibers, which makes possible a remote acquisition of spectra [Lourenço et al., 2012].
In sum, NIR spectroscopy is a non-destructive fast technique, it does not need any sample’s preparation and it can measure several samples’ properties at once [Smith, 2011].
II.3. Chemometrics
Chemometrics is the application of statistical, mathematical and computational methods to analyze chemical data and to extract information from certain chemical systems. These methods allow the extraction of the relevant information concerning the analytes of interest, which otherwise would be very difficult [Lourenço et al., 2012; McGovern et al., 2002]. Chemometrics was first introduced in the chemical field, although today is a widely used tool in several other areas such as spectroscopy [Geladi, 2003].
The successful implementation of the spectroscopic techniques, essentially NIR spectroscopy, which produces broad and overlapping spectral bands, was only possible due to the development of chemometric methods. Beside NIR spectroscopy, MIR spectroscopy, normally producing well defined spectral bands, also rely on chemometric methods for easy of interpretation and handling of large data sets, as well as to reduce the noise that is often present in spectra.
The most widely chemometric methods used for spectral data analysis in spectroscopy are mathematical pre-processing techniques and multivariate data analysis, which are mainly divided into qualitative and quantitative methods.
In the present work some pre-processing techniques are reviewed, namely those studied along the work: multiplicative scatter correction (MSC), standard normal variate (SNV), baseline correction, normalization and derivatives. Principal component analysis (PCA) and partial least squares (PLS) regression are the choice for multivariate data analysis of spectral data acquired during this work, and will be presented next.
12
II.3.1. Mathematical Pre-Processing Techniques
The application of pre-processing techniques is a very important step in the analysis of spectral data, since they enable the elimination of physical phenomena due to undesired variations, such as noise, differences along the sample thickness, differences in the number cells across the sample and scattering events [Rinnan et al., 2009; Sharaf et al., 1986]. This procedure has as goal of minimizing the irrelevant information present in the final spectra.
Multiplicative Scatter Correction (MSC)
MSC is a pre-processing method used to eliminate the effect of physical phenomena like the light scattering effect of particles of different sizes and shapes [Helland et al., 1995]. The goal is to find the “ideal” spectrum of the group. For that, it is necessary a reference spectrum, which is usually the mean spectrum of all available spectra or the mean spectrum of replicate spectra. MSC works by fitting each spectrum to the average spectrum, which is supposed to be the ideal, performing a transformation where the spectral data xi is converted into new values zi, where i =
1, …, p, with p being the wavelengths [Fearn et al., 2009]. The following equation describes the transformation from xi to zi:
𝑧𝑖 =
𝑥𝑖− 𝑎 𝑏 ,
where a represents the intercept and b the slope of a least squares regression of xi on the values ri
coming from the reference spectra.
Standard Normal Variate (SNV)
The SNV transformation centers each spectrum and then scales it by its own standard deviation. The resulting spectra have always zero mean and variance equal to one, and are thus independent of original absorbance values. Dhanoa et al. (1994) and Helland et al. (1995) observed that MSC and SNV transformed spectra are closely related and that the difference in prediction ability between these methods is very small.
13
Hence, SNV eliminates the interference of scatter events by individually transforming the spectral data xi into new values zi, where i = 1, …, p (p are the wavelengths), according to the
following equation:
𝑧𝑖 =
𝑥𝑖− 𝑚 𝑠 ,
where m corresponds to the mean and s to the standard deviation of xi values in the original
spectrum [Fearn et al., 2009].
Baseline Correction
Since the obtained spectra are not always grounded at zero, methods for baseline correction are usually necessary to remove both baseline offset and slope from a spectrum. The type of algorithm used depends on the baseline correction needed. Spectra which are dislocated from zero by a constant value are the simpler cases and, consequently, subtracting the value in question from the spectrum is usually enough. However, there are cases where the baseline presents a slope or even spectra with curvatures, which makes baseline correction more difficult. In these cases, an algorithm generating a function, a linear or polynomial function, can bring the spectrum to zero [Otto, 1999; Smith, 2011].
Baseline correction has a limited utility as a spectral pre-processing, since it is difficult to find a function that exactly adjusts to the spectrum curvature. Although there are algorithms that automatically determine the best parallel function, they do not always work properly and may add variance to the data. Furthermore, the slope and curvature along the spectrum is not always the same, so a unique function will hardly correctly adjust to the entire spectrum.
Considering the disadvantages related to baseline correction methods, derivatives for offset correction may be preferred. But the problem of derivatives’ application is that the resulting spectra will be noisier than the raw one. In cases where there is a low SNR, baseline correction must be applied instead [Smith, 2011].
14
Normalization
There are many possible ways to normalize the data. Normalization involves multiplying all spectra by a different scaling factor for each wavenumber. The goal is to remove differences between the samples that are related with factors, such as differences in the samples’ number of cells, and not with the property of interest. It should be noted that a careful design of the experience is still a critical factor that must be always taken into account before pre-processing the data. There are several methods for normalizing spectral data and a full review on this topic may be found at Randolph (2006).
Spectral Derivatives
Spectral derivatives can be used to eliminate offset and background slope variations among spectra. The first derivative removes baseline offset variations in spectral profiles and the second derivative removes both baseline offset differences and differences in baseline slopes between spectra [Otto, 1999].
First and second derivatives also enable the resolution of overlapping peaks, being the second derivative the most used for this purpose. However, before applying derivatives, it is important to have in mind that the derivative spectra will have more noise than the initial spectra and, consequently, a decrease in the SNR will be observed. In order to avoid the SNR decreasing, the smoothing has to be incorporated when applying derivative. The Savitzky-Golay smoothing is the most common algorithm used to avoid the decrease of the SNR. Its principle is the same of an average filter, i.e., each point of the dataset is replaced by the average of itself and n points before and after [Lourenço et al., 2012; Scholz et al., 2012].
II.3.2. Multivariate data analysis
The most widely used chemometric techniques are principal component analysis (PCA) and partial least-squares (PLS) regression.
15
Principal Component Analysis (PCA)
The PCA is a data-reduction method extensively used for qualitative spectral analysis that works by reducing the dimension of a dataset to a simpler representation in the space of the new variables, called principal components (PCs). PCs are ordered in terms of variance explained in the data set, with the first PCs representing the major variance in the data. Sometimes the variance in data can be distributed by more PCs, so it may be more difficult to select those which are relevant to extract some useful information [Jollife, 2002]. This kind of method is a very useful tool for chemometricians, not only for data compression but also information extraction, allowing the identification of major trends in the data [Naes et al., 2002].
The PCA model can be described in matrix notation as: 𝑋 = 𝑇𝑃𝑇+ 𝐸
where 𝑋 is the spectral data matrix, 𝑇 is the matrix containing the scores of the PCs, 𝑃 the matrix containing the loadings and 𝐸 the matrix that contains the model residuals and represents the noise or irrelevant variability in 𝑋. The scores in 𝑇 are linear combinations of the original variables of 𝑋 (wavelengths). The loadings in 𝑃 are estimated by regressing 𝑋 on to 𝑇 and the residual matrix 𝐸 is calculated by subtracting the estimated 𝑇𝑃𝑇 from 𝑋 [Naes et al., 2002].
Data evaluation and qualification can be generally achieved by plotting different combinations of PC’s scores, since it is easier to visualize and evaluate the samples in a smaller dimensional space. As the fraction of variance can be covered by one, two or three PCs, it is possible to visualize almost the entire data by plotting these PCs against each other [Otto, 1999]. In theory the samples with closer scores will be more similar to each other.
16
Partial Least Squares (PLS) regression
The PLS regression is a quantitative method that establishes a relationship between spectra and the quantifiable properties of samples. It works by determining a small number of latent variables (lv) that allow predicting the sample properties by using the spectral data as efficiently as possible [Naes et al., 2002].
Let X be the mean-centered 𝑛 × 𝑝 matrix composed of the 𝑛 sample vectors 𝑥
𝑖, 𝑖 =
1, … , 𝑝 containing the spectral measurements at 𝑝 wavelengths and let 𝑦 be the
mean-centred vector containing the reference values for the variable of interest. With this
information, PLS finds new variables 𝑡
𝑖, 𝑖 = 1, … , 𝑝, which will be used to estimate the
lv, and determines the loadings matrix
𝑃 and y-loadings vector 𝑞 by maximizing the
correlation between those variables 𝑡
𝑖found, as described below:
𝑋 = 𝑇𝑃
𝑇+ 𝐸
𝑦 = 𝑇𝑞
𝑇+ 𝑓,
where 𝐸 and 𝑓 are the 𝑋 and 𝑦 residuals, which are the difference between the observed
and the modelled variable [Naes et al., 2002].
The PLS regression coefficients
are given by:
𝛽 = 𝑊(𝑃
𝑇𝑊)
−1(𝑇
𝑇𝑇)
−1𝑇𝑦,
where W is the PLS weights matrix and can be used to obtain the predictions:
𝑦̂ = 𝑋𝛽
In order to evaluate the performance of the developed models to predict the samples’
properties, the root mean squared error (RMSE) was used, which is based on the squared
differences between real and predicted y-values. The RMSE is given by:
RMSE = √
1
𝑠
∑(𝑦
𝑖𝑝𝑟𝑒𝑑𝑖𝑐𝑡𝑒𝑑− 𝑦
𝑖𝑟𝑒𝑎𝑙)
2 𝑠 𝑖=1,
where 𝑠 is the number of spectra. Besides RMSE, the coefficient of determination (R
2)
was also calculated in order to evaluate the robustness of the PLS models.
17
The validation of the developed PLS models is usually performed using two different
approaches: external validation, where a set of external samples not used for calibration
was used for validating the model developed; and the leave-one-out (LOO)
cross-validation, where the calibration and validation are done by successively excluding a
sample from the calibration set and using it as validation set, until all samples have been
used for calibration and validation. Generally, the choice of the approach to be used is
dependent on the number of samples available.
19
Chapter III
In-situ near-infrared (NIR) versus high-throughput mid-infrared
(MIR) spectroscopies to monitor biopharmaceuticals bioproduction
Abstract
The process development for biopharmaceuticals presents a number of relevant constraints, being the major one the fact that they are synthesized by living cells with inherent variability, further enhanced by sensitivity to the manufacturing environment. To monitor and consequently control the cultivation processes it is therefore relevant to develop at-line and/or in-situ monitoring techniques. The versatility presented by FT-IR spectroscopy, both in the near (NIR) and mid infrared (MIR) regions, makes it a relevant tool towards this goal as it enables an economic, rapid, sensitive and simultaneous measurement of all critical variables of the bioprocess. In the present work the high-throughput at-line MIR spectral analysis from dehydrated cell pellets and the in-situ analysis of the whole culture broth using a NIR fiber optic were compared for monitoring the same cultures of recombinant E. coli DH5 producing a plasmid model, conducted over different media compositions and on different cultivation modes (batch and fed-batch). For that, several Partial Least Square (PLS) regression models for MIR and NIR spectra data were built to estimate the host cell growth, the production of plasmid, the carbon sources consumption (glucose and glycerol) and the by-product acetate production and consumption. Robust calibration PLS models were developed, that are valid through different cultivation processes, presenting a range of final biomass concentrations between 5.6 to 12.1 g DCW/L, of final plasmid concentrations between 14 to 142 mg/L and of plasmid productions per biomass from 1.8 to 12.4 mg/g DCW. The PLS models developed are valid for control purposes in cases of possible industrial environment fluctuations and for optimizations purposes. The PLS models developed, both for MIR and NIR regions, presented very high and similar correlation coefficients and low predictive errors. The predictive errors for models based on MIR data, were 0.71, 8.55, 0.29, 0.4 and 0.4 concerning biomass, plasmid, glucose, glycerol and acetate, respectively. For NIR data, the predictive errors were 0.39, 7.86, 0.3, 0.23 and 0.41, respectively.
20
NIR spectral data is in general less informative as it results from combinations and overtones of the fundamental vibrations. Therefore, the slightly better PLS models based on NIR spectra could result from the fact that in the NIR setup an in-situ probe was used, whereas in the MIR setup it was necessary to extract the pellet sample from the bioreactor and subsequently dehydrate it, which could input an error associated to the biomass acquisition. Moreover, the concentration of glucose, glycerol and acetate were directly analyzed from the culture broth in the NIR setup while in the MIR setup this information was indirectly estimated obtained from the biomass.
In conclusion, NIR and MIR spectroscopy represents valuable approaches for bioprocess monitoring. The use of a NIR fiber optic probe enables to extract in-situ, i.e, in real time, information concerning the critical variables of the bioprocess. In cases of cultivation optimization, where multi-bioreactors of small size are used, the use of a NIR fiber optic probe may not be possible, or due to economic limitations of having a large number of these probes. The MIR setup can therefore represent an efficient alternative, as it can be conducted in high-throughput mode by using multi-microplates that enable the simultaneously reading of hundreds of samples from several cultures at once.
Keywords: Biopharmaceuticals, Bioprocess monitoring, Cultivation, MIR spectroscopy, NIR
21
III.1. Introduction
The biopharmaceuticals products like plasmids have becoming more appealing due it is potential for advanced medical therapies (e.g. DNA vaccines and gene therapy), being the bacterium Escherichia coli the most used host microorganism for their production, since it presents capacity to grow under a wide range of conditions, from rich complex organic media to salt-based chemically defined media, as well as ease of manipulation by genetic engineering [Carnes, 2005; Coban et al., 2013; Coban et al., 2011; Kalams et al., 2013; Moen et al., 2009; Prather et al., 2003; Scholz et al., 2012; Shibui et al., 2013; Yang, 1999].
However, the process development for biopharmaceuticals presents a number of relevant constraints, being the major one the fact that they are synthesized by living cells with inherent variability, further enhanced by sensitivity to the manufacturing environment. To monitor and consequently control the cultivation processes it is therefore relevant to develop monitoring techniques.
Currently, online information about a bioprocess concerning its critical variables (e.g., biomass, products, nutrients and metabolites) is possible mainly through offline analyses, which are labor-intensive and time-consuming, and imply removing samples from the bioreactor. However, in order to better understanding the bioprocesses, and to reach a more economic and robust process regarding reproducibility, and consequently quality of the final product, the adoption of modern bioprocess monitoring tools based on in-situ analyses is essential, in accordance to the Process Analytical Technology (PAT) initiative, introduced by the Food and Drug Administration (FDA), in 2004 [FDA, 2004]. This is especially relevant in heterologous products used as medicines, i.e. in the case of biopharmaceuticals.
The introduction of the PAT initiative in the biopharmaceutical industry opened the window to the implementation of spectroscopic techniques, namely Fourier transform infrared (FT-IR) spectroscopy, to monitor bioprocesses. FT-IR spectroscopy is a physicochemical method that measures vibrations of the functional groups of molecules, providing therefore information about the biochemical composition of a biological sample. It is rapid, requires minimal sample preparation or no preparation at all and is multi-parametric, i.e., it enables the determination of the concentration of multiple compounds at once, from a single spectroscopic measurement [Huang et al., 2006; McGovern et al., 2002; Schenk et al., 2006].
The versatility presented by FT-IR spectroscopy, both in the near (NIR) and mid infrared (MIR) regions, makes it a potential tool in many applications, either in the laboratory or in industrial plants. Nevertheless, it is in the domain of monitoring and optimization of bioprocesses that this technique has increasingly been applied, as it enables a rapid, sensitive and simultaneous measurement of all critical variables of the bioprocess, namely, the host cell growth, the
22
production of the heterologous product, the carbon sources consumption and by-products (e.g., acetate and ethanol) production and consumption [Di Egidio et al., 2010; Roychoudhury et al., 2006; Scholz et al., 2012]. Depending on the infrared (IR) region used, MIR or NIR, IR spectroscopy presents specific characteristics, and therefore specific advantageous and limitations, that at the end may complement each other.
While MIR spectroscopy reflects the fundamental vibrations of the molecular bonds, NIR spectroscopy reflects overtones and combinations of vibrations, which makes MIR spectra more informative concerning the samples’ biomolecular composition. However, due to the high absorption of water in the MIR region, it is usually necessary to take the samples from the bioreactor and subsequently dehydrate the samples, which increases the risk of bioreactor contamination and inputs a time delay in the analysis [Arnold et al., 2002; Cimander and Mandenius, 2002; Guillen and Cabo, 1997; Tamburini et al., 2003]. An advantageous of MIR-spectroscopy is that it is possible to at-line conduct the MIR spectral acquisition in a high-throughput mode, using micro-plates, which is particularly important if hundreds of samples are to be analyzed in a short period of time, as is the case of bioprocess optimization protocols [Scholz
et al., 2012].
In spite of being theoretically less informative, NIR spectroscopy is not so affected by the water present, and combined with chemometric techniques, also allows the construction of calibration models for the prediction of the critical variables of the bioprocess. Moreover, NIR fiber optic probes, that can be immersed directly in the culture broth and steam sterilized with it, enable the acquisition of information in-situ, i.e., in real time [Arnold et al., 2002; Cimander and Mandenius, 2002; Lopes et al., 2013; Navrátil et al., 2005; Shenk et al., 2001; Tamburini et al., 2003; Tosi et al., 2003]. Nevertheless, the use of this kind of probes in optimization protocols in microbioreactors may be impaired, due to space constraints and low biomass concentrations.
The use of chemometric techniques is crucial in IR spectroscopy, as it allows extracting quantitative information from the IR spectra [Huang et al., 2006; McGovern et al., 2002; Moen
et al., 2009]. Chemometrics is the application of statistical or mathematical methods to analyze
chemical data and to extract information from certain chemical systems. These methods allow the extraction of the relevant information concerning the analytes of interest enclosed in the spectral data [Lourenço et al., 2012; McGovern et al., 2002]. The application of pre-processing techniques is also a very important step in the analysis of spectral data, since they enable the elimination of physical phenomena, thus improving the subsequent multivariate analysis [Rinnan et al., 2009; Sharaf et al., 1986]. The classical spectrum pre-processing methods include multiplicative scatter correction (MSC), standard normal variate (SNV) and derivatives.
23
When scatter effects are the dominating sources of spectral variability, a MSC or a SNV transformation can be used to remove those effects. MSC is a pre-processing method eliminates the light scattering effect due to particles of different sizes and shapes [Helland et al., 1995], by calculating a reference spectrum, which is usually given by the mean of all samples, and each spectrum is then fitted to this reference spectrum. With this method, each spectrum is corrected and all samples appear to have the same scatter level as the ideal. On the other hand, the SNV transformation centers each spectrum and then scales it by its own standard deviation. The resulting spectra have always zero mean and variance equal to one, and are thus independent of the original absorbance values. Dhanoa et al. (1994) and Helland et al. (1995) observed that MSC and SNV transformed spectra are closely related and the difference in models predictive ability using these pre-processing techniques is very small. Derivatives can be used to eliminate offset and background slope variations among spectra. The first derivative removes baseline offset variations in spectral profiles, whereas the second derivative removes both baseline offset differences and differences in baseline slopes between spectra.
For spectral data analysis, the most widely used chemometric techniques are principal component analysis (PCA) and partial least-squares (PLS) regression. The PCA is a data-reduction method extensively used for qualitative spectral analysis that reduces the dimension of a dataset to a simpler representation by creating new variables, called principal components. This kind of method is a very useful tool for chemometricians, not only for data compression but also for information extraction, allowing the identification of major trends in the data [Naes et al., 2002]. However, for quantification purposes the most used multivariate data analysis is the PLS regression, used to establish a relationship between the spectra and the quantifiable properties of samples, by determining a small number of latent variables that allow predicting sample properties, using the spectral data as efficiently as possible [Naes et al., 2002]. When a calibration model is developed from the full spectra, the prediction results can be affected by wavelengths that do not provide relevant information about the metabolite of interest. Wavelength selection is therefore very useful, as it allows eliminating the uninformative wavelengths [Triadaphillou et
al., 2007].
It is intended in the present work to compare the MIR and NIR spectroscopy in monitoring in high-throughput and in-situ mode, respectively, a heterologous product production over a recombinant culture. As expression system model, a recombinant Escherichia coli DH5 producing the plasmid pVAX-LacZ (Invitrogen, USA) was chosen, since E. coli is the most widely used expression host, and the production of plasmids has also gained considerable attention as a safer vector for gene therapy and DNA vaccination. The use of FT-IR spectroscopy for plasmid production monitoring has previously been studied for example, Lopes et al. (2013)
24
used in-situ NIR spectroscopy and Scholz et al. (2012) a high-throughput at-line MIR spectroscopy to monitor a plasmid bioproduction process in Escherichia coli cultures. However, the efficiency of the two techniques for monitoring plasmid bioprocesses, provided by these two studies, cannot be compared, as different cultures conditions were used, and in the case of the MIR spectroscopy monitoring few samples were used for model building that could have impaired the model prediction capability. In this regard, in the present work the high-throughput at-line MIR spectral analysis and the in-situ analysis using a NIR fiber optic were compared for monitoring the same cultures of recombinant E. coli DH5 producing pVAX-LacZ. For that, several PLS regression models for MIR and NIR data were built to estimate the critical variables of the bioprocess, such as the host cell growth, the production of plasmid, the carbon sources consumption (glucose and glycerol) and the by-product acetate production and consumption. As it was also intended to compare the robustness of the predicting models over different cultivation conditions, several PLS were also built based on cultures conducted over different media conditions and on different cultivation modes (batch and fed-batch).
III.2. Materials and Methods
III.2.1. Cultivation
Escherichia coli DH5-α containing the plasmid model pVAX-LacZ (Invitrogen, USA) was
used. The stock cultures, grown on 2% (w/v) Luria-broth (Sigma, UK) and 30 µg/ml kanamycin (Sigma-Aldrich, Germany), were maintained in 40% (v/v) glycerol solution (Panreac Quimica SA, Spain) with 10 mM Tris-HCl (Sigma-Aldrich, Germany) buffer pH 8.0 at -80 °C. An aliquot of 10 µl of stock culture was inoculated into 1 L shake flask containing 300 mL with 20 g/L bactotryptone (BD, USA), 10 g/L yeast extract (Difco, USA), 10 g/L sodium chloride (Merck, Germany) and 30 µg/mL kanamycin), grown to mid-exponential phase, and then used to inoculate
a batch culture to an initial optical density at 600 nm (OD600) of approximately 0.5.
The cultivation was performed in a 2 L bioreactor (Biostat MD, B. Braun, Germany) with a 1.8 L working volume, in absence of antibiotic. Cultivation was maintained at pH 7.0 0.1 by automatic control through 1 M NaOH (Fluka, Switzerland) or 1 M HCl (Sigma-Aldrich, Germany) addition, and at 37 0.1 °C with a minimal dissolved oxygen concentration (DOC) of 30 5% of air saturation, by automatic adjustment of the agitation rate, while adjusting the air flow rate range between 1.0 and 1.5 vvm (volume of air/volume of medium/minute). The initial batch cultivation media of the three cultures studied contained 10 g/L of yeast extract (Difco, USA), 20 g/L bactotryptone (BD, UK) and 7 g/Lof glycerol (culture A), 7 g/L of glucose (culture
25
B), and 6 g/L of glycerol and 8 g/L of glucose (culture C). An exponential feeding phase was started on cultures B and C with a feeding of 0.3 L medium, containing 22.5 g yeast extract, 22.5 g bactotryptone and 45 g glucose, and considering a maximum specific growth rate of 0.18 h-1 and a constant yield of biomass per glucose of 0.6 g/g. Samples were taken from the bioreactor along the culture, and subsequently used for offline reference analysis of biomass, glucose, glycerol, acetate and plasmid.
III.2.2. Reference analyses
Biomass in units of dry cell weight (DCW) per volume of culture medium (g/L) was determined by centrifuging the cultivation samples, washing the pellet with 0.9% (w/v) sodium chloride and drying at 80 oC until constant weight. The bacterial cell pellet and the supernatant obtained from sample centrifugation (Hermle Z160M, Germany) were frozen at -20 oC. Glucose, glycerol and acetate were determined by HPLC with a L-6200 Intelligent Pump (Merck-Hitachi, UK), a L-7490 LaCrom-Ri-detector (Merck, Germany), a D-2500 Chromato-integrator (Merck-Hitachi, Germany) and an Aminex® Fermentation Monitor HPLC column (Bio-Rad, USA) maintained at 50 °C, and by using H2SO4 at 0.6 mL/min as eluent. Plasmids were extracted from the bacteria cell by the alkaline cell lysis method, and subsequent plasmid concentration and purity degree were determined by hydrophobic interaction HPLC, as described in Scholz et al. (2012).
III.2.3. MIR spectroscopy
The cell pellet obtained from the centrifugation of each 1 mL sample taken from the bioreactor was resuspended with NaCl 0.9% (w/v), so that an equivalent optical density of 6.0 (at 600 nm) in all samples was achieved. Triplicates of 25 µL of this suspension were placed on IR-transparent ZnSe microtiter plates with 96 wells (Bruker Optics, Germany) and subsequently dehydrated for 2.5 h in a vacuum desiccator (ME2, Vaccubrand, Germany). The MIR spectra were recorded in transmission mode by a HTS-XT associated to Vertex-70 spectrometer (Bruker Optics), using a spectral resolution of 4 cm-1 and 40 scans per sample.
III.2.4. NIR spectroscopy
NIR spectra were obtained using an NIR transflection fiber optic probe IN-271P (Bruker Optics, Germany), with a pathlength of 2 mm, coupled to a Vertex-70 spectrometer (Bruker Optics, Germany) with a TE-InGaAs detector. The fiber optic probe was submerged in the bioreactor and stem sterilized simultaneously with the cultivation medium. NIR spectra were
26
collected every 2 minutes in the 12500-5400 cm-1 (800-1851 nm) range, consisting of 32 coadded scans with 8 cm-1 resolution (2 nm steps). The scanner velocity was set to 20 kHz and the aperture setting defined was 6 mm.
III.2.5. Chemometric Methods
MIR data consisted of mean spectra of triplicates in each well of the ZnSe plate, while NIR data consisted of the spectra correspondent to the samples taken from the bioreactor and analyzed by offline reference methods.
Pre-processing
The following data pre-processing methods were studied: constant offset elimination, straight line subtraction, first and second derivatives, multiplicative scatter correction (MSC) and standard normal variate (SNV), and a combination between them.
While constant offset elimination shifts the spectra in order to set the y-minimum to zero through the subtraction of the spectra by a certain constant, straight line subtraction fits a straight line to the spectra and subtracts it, enabling the shift of the spectra to zero [Otto, 1999; Smith, 2011]. Spectral first and second derivatives were also employed to remove baseline offsets. As derivatives usually broaden spectra noise, a Savitzky-Golay smoothing was applied, where each point of the dataset is replaced by the average of itself and n points before and after.
SNV eliminates the interference of scatter events by individually transforming the spectral data xi into new values zi, where i = 1, …, p (p are the wavelengths), according to the following
equation:
𝑧𝑖 =𝑥𝑖− 𝑚 𝑠 ,
where m corresponds to the mean and s to the standard deviation of xi values in the original
spectrum [Fearn et al., 2009].
MSC was also used to eliminate changes in spectra due to radiation scattering, by determined the mean spectrum of replicate spectra, by performing a transformation where the spectral data
xi is converted into new values zi, where i = 1, …, p, with p being the wavelengths [Fearn et al.,
2009]. The following equation describes the transformation from xi to zi:
𝑧𝑖 =𝑥𝑖− 𝑎 𝑏 ,
where a represents the intercept and b the slope of a least squares regression of xi on the values ri
27
Multivariate data analysis
For multivariate calibration the PLS method, also known as projection to latent structures, was applied, by determining a small number of latent variables (lv) that can predict sample properties by using the spectral data.
Let X be the mean-centered 𝑛 × 𝑝 matrix composed of the 𝑛 sample vectors 𝑥𝑖, 𝑖 = 1, … , 𝑝
containing the spectral measurements at 𝑝 wavelengths and let 𝑦 be the mean-centred vector containing the reference values for the variable of interest. With this information, PLS finds new variables 𝑡𝑖, 𝑖 = 1, … , 𝑝, which will be used to estimate the lv, and determines the loadings matrix 𝑃 and y-loadings vector 𝑞 by maximizing the correlation between those variables 𝑡𝑖 found, as described below:
𝑋 = 𝑇𝑃𝑇+ 𝐸
𝑦 = 𝑇𝑞𝑇+ 𝑓,
where 𝐸 and 𝑓 are the 𝑋 and 𝑦 residuals, which are the difference between the observed and the modelled variable [Naes et al., 2002].
The PLS regression coefficients are given by:
𝛽 = 𝑊(𝑃𝑇𝑊)−1(𝑇𝑇𝑇)−1𝑇𝑦,
where W is the PLS weights matrix and can be used to obtain the predictions: 𝑦̂ = 𝑋𝛽
In order to evaluate the performance of the developed models to predict the samples’ properties, the root mean squared error (RMSE) was used, which is based on the squared differences between real and predicted y-values. The RMSE is given by:
RMSE = √1 𝑠∑(𝑦𝑖𝑝𝑟𝑒𝑑𝑖𝑐𝑡𝑒𝑑− 𝑦𝑖𝑟𝑒𝑎𝑙) 2 𝑠 𝑖=1 ,
where 𝑠 is the number of spectra. Besides RMSE, the coefficient of determination (R2) was also calculated in order to evaluate the robustness of the PLS models.
The validation of the developed PLS models was performed using two different approaches: external validation, where a set of external samples not used for calibration was used for validating the model developed; and the leave-one-out (LOO) cross-validation, where the


![Figure II.3: Main molecular vibrational modes [Babrah, 2009]](https://thumb-eu.123doks.com/thumbv2/123dok_br/15257854.1025042/24.892.251.627.664.999/figure-ii-main-molecular-vibrational-modes-babrah.webp)
![Figure II.4: Scheme of the Michelson interferometer [Smith, 2011].](https://thumb-eu.123doks.com/thumbv2/123dok_br/15257854.1025042/26.892.193.699.779.1044/figure-ii-scheme-michelson-interferometer-smith.webp)