ISSN : 2248-9622, Vol. 4, Issue 10( Part - 5), October 2014, pp.38-46
Characterization and DC Conductivity of Novel CuO doped
Polyvinyl Alcohol (PVA) Nano-composite Films
Chivukula Srikanth*, Chakradhar Sridhar B**, B.M.Nagabhushana*** and
R.D.Mathad*
*(Department of Physics, Gulbarga University, Gulbarga-585 106, Karnataka, India.) ** (Department of Physics, Gulbarga University, Gulbarga-585 106, Karnataka, India)
***(Department of Chemistry, M.S. Ramaiah Institute of Technology, Bangalore 560 054, India)
ABSTRACT
DC conductivity of PVA-CuO nano-composite films have been studied in the present work. The composites were prepared by solution-casting technique. The prepared PVA-CuO composites have been characterized by X-ray diffraction (XRD) analysis, Fourier Transform Infrared Spectroscopy (FT-IR), Scanning Electron Microscopy (SEM) and Energy Dispersive X-ray Spectroscopy (EDXS); which confirmed the presence of CuO in polyvinyl alcohol and the formation of the composite. DC conductivity studies show thermally activated behavior of all the composites. The conductivity was found to increase with the increase in temperature indicating the semiconducting behavior of all the compositions. The activation energy increases as the content of CuO nanoparticles increases from 1 to 4 in wt% in the PVA- CuO nano-composites. Maximum conductivity was observed in 4 wt% of CuO in polyvinyl alcohol.
Keywords
-
DC conductivity, FTIR, Nano copper oxide, polyvinyl alcohol, X-ray diffraction.I.
INTRODUCTION
The organic–inorganic composite polymeric
materials have attracted researchers because of their potential uses in developing new materials and devices [1]. Recently, polyvinyl alcohol has received much attention because of its unique chemical, physical properties as well as its industrial
applications [2–5]. Its good film-forming nature,
hydrophilicity, processibility and good chemical resistivity [6] have been used to develop inorganic-organic nano-composites. Cupric oxide (CuO,
tenorite) is a monoclinic (Fig.1) p-type
semiconductor with a band gap of 1.5 - 1.8 eV [7-9].It has been a hot topic because of their promising applications in various fields such as dye sensitized solar cells [10], gas sensors [11],bio-sensors[12], nanofluid [13], photo detectors [14], energetic materials (EMs) [15], field emissions [16], super capacitors [17],removal of inorganic pollutants [18,19],photo catalysis [20] and magnetic storage media [21].Combining the properties of the organic polyvinyl alcohol and inorganic nano CuO will help in the generation of the new class of materials with improved properties and that can overcome the drawbacks coming from the individual counterparts as well as will also improve the physical and chemical properties of materials. These composites are expected to find commercial applications like gas sensors, electro chromic devices and super capacitors. In the present work, attempts have been made to synthesize the nano-cupric oxide particles by low solution heat combustion method and PVA-CuO
nano-composite by solution-casting method. These polymer nano-composites have been characterized by using various techniques such as X-ray diffraction (XRD), Fourier Trans-form Infrared Spectroscopy (FTIR), Scanning Electron Microscopy (SEM) and Energy Dispersive X-ray Spectroscopy (EDS).The dc conductivity measurements are done by using two probe set-up.
Fig.1. Monoclinic crystal structure of CuO with each Cu atom being surrounded by 4 oxygen atoms (red
spheres).
II.
E
XPERIMENTAL2.1. Materials:
Polyvinyl alcohol of analytical grade was obtained in the powder form from Nice Chemicals Pvt.Ltd. Cochin, with the average molecular weight of
125,000 (98% hydrolyzed). Cupric Nitrate of AR grade was purchased from S.D. Fine-Chem. Ltd.Mumbai.
2.2. Synthesis of Nano Cupric Oxide (CuO):
Low Solution combustion (LSC) technique was employed for the preparation of nano- cupric oxide
[22]. Hydrated Cupric Nitrate [Cu (NO3)2 3H2O] is
used for the synthesis of cupric oxide. The filtered lemon juice was used as a fuel [22]. 4 gm of Cupric Nitrate and 12ml of filtered lemon juice were taken into the cylindrical Petri dish of 300 ml and well
dissolved in de-ionized water. The aqueous redox
mixture was dispersed uniformly by stirring the mixture using a magnetic stirrer for 5 min. Then the resulting mixture was placed into a pre-heated muffle furnace maintained at (400 ± 10) °C. In the beginning, the solution was thermally dehydrated and ignited
with the liberation of large amount of gases (N2, O2,
etc.). The entire process took place within 8 min. The resultant powder occupied the entire volume of the reaction vessel. The combustion was self-propagating and within a few minutes the reaction was completed and fluffy powder was obtained. After completion of the process, the product obtained was grinded well using mortar and pestle. The powder is voluminous, weakly agglomerated, foamy, nano in size and has a high surface area. The formation of product through LSC process can be represented by the following reaction.
Cu (NO3)2 3H2O+Lemon juice (aq.) Combustion
product(S) + Heat + Gases (1)
LSC process can be considered as a thermally induced redox reaction of the precursor wherein a fuel acts as
reductant and NO3 ions act as oxidant.
2.2.1. Synthesis of Polyvinyl alcohol film.
The pure PVA films were prepared by solution casting technique [23]. Powdered PVA of about 2.5 g was dissolved in 50ml of double distilled water by stirring. The solution was then warmed up to 333 K and thoroughly stirred, using a magnetic stirrer, for about 1h until the polymer became completely soluble. By removing the trapped air bubbles, the solution was poured onto a leveled clean glass plate and left to dry at room temperature for about 48 h.The dried films were peeled off from the glass plate and cut into suitable pieces for measurements [24].
2.2.2. Synthesis of PVA–CuO nano-composite films:
PVA-CuO nano-composite films were also prepared again by the solution casting method. First, the PVA stock solution was prepared by the above method and to this solution 1.0 wt%,2.0wt%, 3.0 wt% and 4.0 wt% of CuO nano powder was mixed and stirred vigorously by using magnetic stirrer until transparent
PVA–CuO multi component dispersion was obtained.
Further, ultrasonication was done for complete dispersal of CuO in PVA solution. Then known
volume of viscous PVA–CuO solution was poured
onto a leveled clean glass plate and left to dry at room temperature for about 48 h. The dried films were peeled off from the glass plate and cut into suitable pieces for characterization.
2.3. Measurements:
The X-ray diffraction (XRD) patterns of the pure PVA film, nano CuO powder and the polymer nano-composite films were recorded at room temperature
using an X-ray powder diffractometer with Cu Kα
radiation (λ = 1.5416
Ǻ
) in the 2 (Bragg angles)range (10˚ 2 80˚) to elicit the information
related to phase purity, crystallinity and details of their structure. The FTIR spectra of the samples were recorded on a Perkin Elmer 1600 spectrophotometer in KBr medium. The morphology of the composites in the form of powder was investigated using scanning electron microscope (SEM) Model-EVO-18 Special Edison, Zeus, Germany. The nano-composite films are coated with silver paste on either side to study DC electrical conductivity. Temperature dependent electrical conductivity was measured from 35°c to 125°c using Keithley 6514 electrometer.
III.
R
ESULTS ANDD
ISCUSSIONS3.1. X–Ray diffraction:
The X-ray diffraction pattern of pure PVA is shown in Fig.2 (a). In this spectrum, one main peak
appeared around 2= 19.72° corresponding to (101)
crystal plane for PVA, which indicates the semi crystalline nature of PVA [25]. The crystalline nature of PVA results from the strong intermolecular interaction between PVA chains through hydrogen bond [26].
The XRD patterns of CuO nanoparticles are shown in Fig.2 (b). CuO was synthesized by Heat Combustion method. These nanoparticles have shown good crystallinity because of the existence of sharp peaks in the XRD pattern. The crystallite size of the synthesized CuO nanoparticles was calculated using
Scherer’s formula [27] given by
0.9
cos
D
(2)where D is the average crystallite size, λ is the X-ray
wavelength (1.5416A°) and
is full width at halfmaximum in radian.
The calculation of crystallite size from XRD is a quantitative approach which is widely accepted and used in scientific community [28-30]. The average crystallite size is found to be ~10 nm. In the XRD pattern, different lines are attributed to the (110),
ISSN : 2248-9622, Vol. 4, Issue 10( Part - 5), October 2014, pp.38-46
(113),(311),(220),(221),(004) and (023) planes are in good agreement with the data of CuO powder file (JCPDS number 80-1917) which corresponds to the monoclinic structure. The XRD spectrum exhibits an intense peak for (111) plane. The lattice constants calculated from the present data are a=4.6890A°, b=3.4250A° and c=5.1324A° respectively, which are in good agreement with the reported data [31].
The X-ray diffraction pattern of PVA, PVA–CuO
composite (1%wt.to 4% wt.) and nano CuO is shown in the Fig.2(c). In the XRD pattern, different lines are attributed to the (110), (002), (111), (200), (112), (113) and (004) planes; by comparing the XRD pattern of the composite and CuO, it is confirmed that CuO has retained its structure even though it is dispersed in PVA during polymerization reaction.
10 20 30 40 50 60 70 80
In te n si ty(a rb .u n it s. )
2 (degree)
PURE PVA
(101)
Fig.2 (a) XRD of Pure PVA
20 30 40 50 60 70 80
In te n si ty (a rb . u n it s)
2(degree)
Nano CuO (110) (0 0 2 ) (111) (2 0 0 ) (2 0 2
) (11
2 ) (2 0 2 ) (1 1 3 ) (3 1 1 ) (2 2 0 ) (2 2 1 ) (0 0 4 ) (0 2 3 )
Fig.2 (b) XRD of Nano CuO
0 10 20 30 40 50 60 70 80
(A) (110) (002) (111) (112) (2 0 2 ) (1 1 3 ) (3 1 1 ) (2 2 0 ) (B) (C)
(101) (101)
(1 1 0 ) (0 0 2 ) (1 1 1 ) (D) (1 1 0 ) (0 0 2 ) (1 1 1 ) (E)
(101) (101)
(1 1 0 ) (0 0 2 ) (1 1 1 ) (1 1 2 ) (2 0 2 ) Int en si ty (arb. un it s)
2(degree)
(F)
(101)
(1 1 0 ) (0 0 2 ) (1 1 1 ) (1 1 2 ) (2 0 2 )
Fig.2(c). XRD of (A) pure CuO (B) pure PVA (C) PVA-1% CuO , (D)PVA-2% CuO (E) PVA-3%
CuO (F) PVA-4% CuO
3.2. FTIR Spectra
3500 3000 2500 2000 1500 1000 500
T ra n smi tt a n ce % Wavenumber(cm-1) PURE PVA 3290 2934 2353 1724 14201326 1086 915 836 682 2850 3575 1142
Fig.3(a). FTIR of pure PVA
The FT-IR spectroscopy is important in the investigati -on of polymer structure, since it provides information about the complexation and interactions between the various constituents in the polymer composite. The Fig.3a shows spectra of pure PVA film wherein the
peaks at 2934 cm-1, 1420 cm-1, 1326 cm-1, 1086 cm-1,
915 cm-1 are assigned to the characteristic vibration
bands of PVA. The O–H stretching band in IR
spectrum is by far the most characteristic feature of
alcohols and appears in the range 3500–3000 cm-1 in
pure PVA.The bands around 3290 cm-1 and 1326 cm-1
respectively. The band around 1420 cm-1 is attributed
to –CH3 bending and the bands around 2934 cm-1 and
2850 cm-1 correspond to the –CH2 asymmetric and
symmetric stretching, respectively. The peak at 1086
cm-1 is attributed to (C–O) stretching vibration of
the ether group. The band at 915 cm-1 has been related
to syndiotactic structure and is assigned to the CH2
rocking vibration. The bands at 836 cm-1 and 682 cm-1
are assigned to (C–C) stretching vibration and out of
plane OH bending,respectively.The band at 1724 cm-1
of the carbonyl group is due to absorption of the residual acetate groups during the manufacturing of PVA from hydrolysis of polyvinyl acetate [32].
4000 3500 3000 2500 2000 1500 1000 500
T
ra
n
smi
tt
a
n
ce
%
Wavenumber(cm-1)
Nano CuO
3334
598
525
430
1385
Fig.3 (b) FTIR of nano CuO.
The Fig. 3(b) shows FTIR spectrum of nano CuO which shows several characteristic bands. The
presence of a weak adsorption at 3334 cm-1 is due to
the stretching vibration of the adsorbed water and surface hydroxyls. Several other bands appeared in
the FTIR spectrum at 598, 525, and 430 cm-1 [33] are
the characteristic for monoclinic CuO phase and confirms the monoclinic phase for the as-grown structures[34].
The Fig.3(c) shows the FTIR spectra of PVA–CuO
nano-composite films where a marginal shift in position of bands corresponding to OH stretching and C=O group are seen which may be attributed to the strong interaction between filler CuO and host PVA polymer matrix. Further-more, peaks observed around
430 cm-1 and 525 cm-1 in the PVA-CuO
nano-composites, is due to Cu-O stretching, which is not observed in the pure PVA film. This suggests the presence of CuO in the PVA matrix.
4000 3500 3000 2500 2000 1500 1000 500
Transmi
tt
an
ce
%
pva 3575
3258 29342850
2353 1724
1420
1326
1142
1326
1086
915
836 682
525
pva-1%cuo
598
430
pva-2%cuo
Wavenumber(cm-1)
pva-3%cuo pva-4%cuo
Fig.3(c). FTIR Spectra of PVA, PVA– CuO (1% to 4%) nano-composites.
3.3 Scanning electron microscopyand EDX analysis:
The scanning electron micrographs of PVA film, CuO nano powder and CuO doped PVA films are shown in Fig. 4. SEM of pure PVA shows uniformly processed smooth PVA matrix and the semi crystalline nature of PVA supporting the observations of XRD analysis (Fig.4 (a)). The average grain size for PVA is found to be 114nm to 234nm. Well defined nanocrystalline morphology of CuO is shown in Fig.4(b).The particles are rod like [35] in shape having an average grain size from 52nm to 84nm. The grains are found to be well interconnected with each other which indicate that they have enough binding energy to combine with neighbour grains or molecules.Fig.4(c-f) show the SEM image of PVA- CuO (1% to 4%Wt.) nano-composites. The average grain size for PVA-1%CuO is found to be 76nm to 132nm and that of PVA-4%CuO is 53nm to 104nm.Thus the crystalline nature of the composites increases, as CuO concentration increases in PVA.
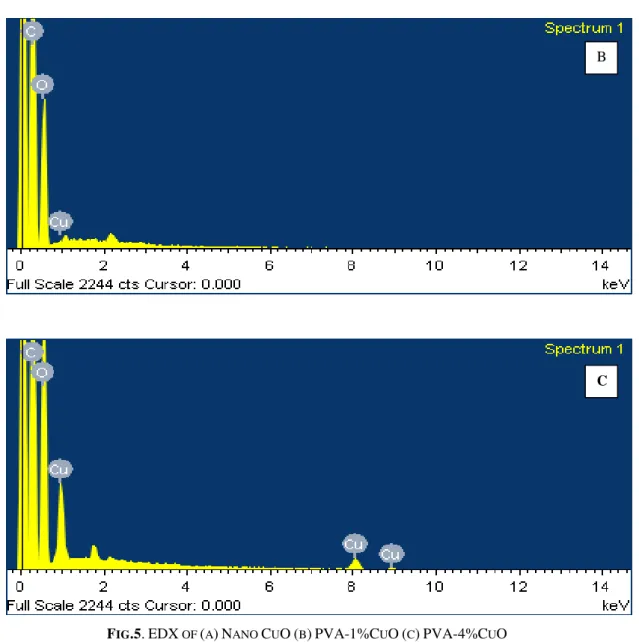
The representative EDX spectra of nano CuO, PVA–
1% CuO and PVA–4% CuO composite films are
shown in Fig.5.The spectra shows enhancement in copper and oxygen content when concentration of the
CuO increases.
3.4 DC Conductivity Measurements:
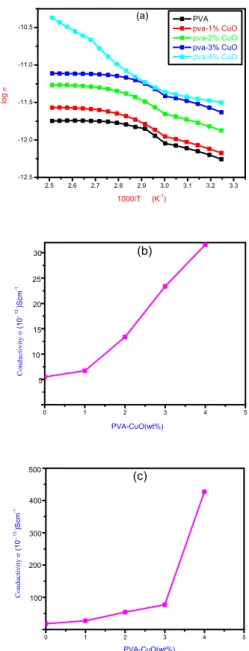
Fig.6 (a) shows a typical logσ vs.1000/T plot for
ISSN : 2248-9622, Vol. 4, Issue 10( Part - 5), October 2014, pp.38-46
has been determined from the slopes of these curves by using the relation [36],
log2.303 1 /
k E
T e
(3)
where σ is the conductivity at temperature T, E is the activation energy, e is the charge of an electron and k is the Boltzmann constant.
The activation energy increases with the increase in doping concentration of CuO in PVA matrix both at high temperature and low temperature regions (Table 1). At 308K and 398K, the dc electrical conductivity
of pure PVA was found to be 5.51×10⁻¹³ Scm-1 and
17.9×10⁻¹³ Scm-1 respectively. As content of CuO
increases from 1% to 4% in PVA matrix, the
conductivity of PVA–CuO nano-composite increases
from 6.69×10⁻¹³Scm-1 to 31.59×10⁻¹³ Scm-1 at 308K,
similarly at 398K it increases from 27.0×10⁻¹³ Scm-1
to 427.0×10⁻¹³ Scm-1 (Table 1).The increase in
conductivity with increase of temperature is the characteristic behavior of semiconductors. The
temperature dependence of the conductivity σ (T) of
disordered semiconducting materials is generally described by the Mott Variable Range Hopping (VRH) model [37],
1 4
( )T exp TO
T
(4)
where σ is the conductivity, T is the temperature and
σ0 is the conductivity at characteristic temperature T0.
PVA–CuO nano-composites follow the
three-dimensional VRH electrical conduction process [38]. Fig. 6(b) and 6(c) shows the plot of conductivity vs.
the content of CuO nanoparticles in the PVA– CuO
nano-composites both at 308K and 398K. The plot shows that the conductivity of PVA increases remarkably after insertion of CuO nanoparticles
(1 to 4%) in the PVA matrix.PVA, CuO and PVA–
CuO nano-composites are of P-type semiconducting materials having large number of free charge carriers
available for the purpose of conduction.Hence, as the
concentration of CuO increases the number
of
free charge carriers also increases, all together
electrons from polar O2- terminated CuO
nanoparticles surfaces and from the PVA chains, resulting in the improvement in the conductivity of
PVA– CuO nano-composites [39].
2.5 2.6 2.7 2.8 2.9 3.0 3.1 3.2 3.3
-12.5 -12.0 -11.5 -11.0 -10.5
lo
g
1000/T (K-1
)
PVA
pva-1% CuO
pva-2% CuO
pva-3% CuO
pva-4% CuO
(a)
0 1 2 3 4 5
PVA-CuO(wt%)
C
o
n
d
u
c
ti
v
it
y
(1
0
¯
13
)Scm
-1
5 10
15 20 25
30 (b)
0 1 2 3 4 5
PVA-CuO(wt%)
C
o
n
d
u
c
ti
v
it
y
(1
0
¯
13
)Scm
-1
100 200 300 400 500
(c)
Fig.6.
(a) Plot of logσ vs. 1000/T PVA, PVA- CuO (1-4%) composites. (b) Plot of conductivity vs. PVA- CuO (wt. %) (at 308K) (c) Plot of conductivity vs.PVA- CuO (wt. %) (at 398K)
IV.
C
ONCLUSIONSPolyvinyl alcohol-Nano cupric oxide composites of various weight percentages were synthesized by solution casting method. X-ray diffraction studies show the retention of CuO in polymer matrix. Studies on Fourier Transform Infrared Spectroscopy (FTIR) confirm the formation of PVA- CuO composites and the SEM image reveals the presence of CuO particles which are uniformly distributed throughout the
composite films. Maximum conductivity was
observed in 4 wt.% of CuO in PVA. The room
temperature dc electrical conductivity of PVA–CuO
content increases in PVA matrix, which is described by the Mott Variable Range Hopping (VRH) model.
ACKNOWLEDGMENT
Author would like to thank T.Navalea, Functional Materials Research Laboratory,School of Physical Sc iences, Solapur University, Solapur; and Prof.M.V.N. Ambika Prasad, Department of Materials Science, Gul barga University, Gulbarga for providing lab facility to measure DC conductivity.
R
EFERENCES[1] S.H.S.Zein, A.R.Boccaccini, W.N.H.W.
Zainal, Effect of manganese oxide on the properties of polyvinyl alcohol multi-walled carbon nanotube composites as
model super capacitors material, World
Appl. Sci. J. 6 (6),2009, 737–747.
[2] D. Lopez, I.Cendoya, F.Torres, J.Tejada,
C.Mijangos, J. Appl. Poly. Sci. 82, 2001,
3215– 3222.
[3] M.Suzuki, T. Yoshida, T.Koyama,
S.Kobayashi, M.Kimura, K.Hanabusa,
H.Shirai, Polymer 41, 2000, 4531.
[4] K.M.Abd, A.S.O.El-Kader, A.S.Orabi,
Polymer Testing 21, 2002, 591–596.
[5] A.S.Ibrahim, G.Attia, M.S.Abo-Ellil, F.H.Abd
El- Kader, J. Appl. Poly. Sci. 63, 1997,
343–348.
[6] M.Krumova, D.Lopez, R.Benavente,
C.Mijangos, J.M.Perena, Effect of cross linking on the mechanical and thermal properties of poly (vinyl alcohol),
Polymer 41, 2000, 9265–9272.
[7] B. Balamurugan and B. R Mehta,
“Nanocrystalline Thin Films,Optical
Properties,Structural
Properties.X-RayDiffraction,” Thin Solid Films,
Vol. 396, No. 1-2, 2001, 90-96.
[8] F.Marabelli, G.B.Parraviciny, F.S.Orioli,
“OpticalGap of CuO,” Physical Review B,
Vol. 52 No. 3, 1995, 433- 1436.
[9] J.Ghijsen, L.H.Tjeng, J.V.Elp, H.Eskes,
J.Westerink, G.A.Sawatzky and M.T.Czyzyk,
“Electronic Structure of Cu2O and
CuO,” Physical Review B, Vol. 38, No. 16, 1988, 1322-11330.
[10] J. S. Cruz, G. T. Delgado, R. C. Perez, S. J. Sandoval, O. J. Sandoval, C. I. Z. Romero, J.
M. Z. An-gel, “Dependence of
Electrical and Optical Properties of Sol–
Gel Prepared Undoped Cadmium Oxide
Thin Films on Annealing Temperature,”
Thin Solid Films, Vol. 493 No.1-2,2005,
83-87.
[11] Choi KJ, Jang HW. One-dimensional oxide nanostructures as gas-sensing materials:
review and issues.
Sensors (Basel, Switzerland) 2010; 10:4083–
99.
[12] Rahman MM, Saleh Ahammad aJ, Jin J-H, Ahn SJ, Lee J-J. A comprehensive review of glucose biosensors based on
nanostructured metal-oxides. Sensors
(Basel, Switzerland) 2010; 10:4855–86.
[13] Zhou LP, Wang BX, Peng XF, Du XZ, Yang YP. On the specific heat capacity of CuO
nanofluid. Adv. Mech. Eng. 2010; 2010:1–4.
[14] Wang SBB, Hsiao CHH, Chang SJJ, Lam KTT, Wen KHH, Hung SCC, et al. A
CuO nanowire infrared photo detector.
Sensor Actuat A: Phys 2011; 171:207–11.
[15] Rossi C, Zhang K, Esteve D, Alphonse P, Tailhades P, Vahlas C. Nanoenergetic
materials for MEMS: a review.J
Microelectromech Syst 2007; 16:919–31.
[16] Zhu YW, Yu T, Cheong FC, Xu XJ, Lim CT, Tan VBC, et al. Large-scale synthesis and field emission properties of vertically oriented CuO nanowire films.
Nanotechnology 2005; 16:88–92.
[17] Zhang X, Shi W, Zhu J, Kharistal D, Zhao W, Lalia B, et al. High-power and
high-energy-density flexible pseudo capacitor
electrodes made from porous CuO nanobelts
and single-walled carbon nanotubes. ACS
Nano2011; 5:2013–9.
[18] Ali I. New generation adsorbents for water
treatment. Chem. Rev 2012; 112:5073–91.
[19] Yu X-Y, Xu R-X, Gao C, Luo T, Jia Y, Liu J-H, et al. Novel 3D hierarchical cotton-candy-like CuO: surfactant-free solvothermal synthesis and application in As(III) removal.
ACS Appl Mater Interfaces 2012; 4:1954–62.
[20] Liu J, Jin J, Deng Z, Huang S-Z, Hu Z-Y,
Wang L, et al. Tailoring CuO
nanostructures for enhanced photo
catalytic property. J Colloid
Interface Sci 2012; 384:1–9.
[21] Kumar R, Diamant Y, Gedanken A. Sonochemical synthesis and characterization of nanometer-size transition metal oxides
from metal acetates. Chem Mater 2000;
12:2301–5.
[22] Mimani T, Patil K.C. “Solution Combustion
Synthesis of Nanoscale Oxides and their
Composites”.Mater Phys Mech., 4, 2001, 1.
[23] H.N.Chandrakala, B. Ramaraj,
Shivakumaraiah, G.M. Madhu,
Siddaramaiah, J. Mater. Sci. 47, 2012, 8076.
[24] G.N.Hemanth Kumar, J.Lakshmana Rao, N.O. Gopal, K.V.Narasimhulu, R.P.S.Chakradhar,
A.Varada Rajulu, Polymer 45, 2004, 5407–
ISSN : 2248-9622, Vol. 4, Issue 10( Part - 5), October 2014, pp.38-46
[25] S.Gandhi, R.Hari Hara Subramani,
T.Ramakrishnan, A.
Sivabalan,V.Dhanalakshmi,R . Gopinathan
Nair, R. Anbarasan, J. Mater. Sci.
45, 2010, 1688.
[26] H.N.Chandrakala, B.Ramaraj,
Shivakumaraiah, Siddaramaiah, Optical properties and structural characteristics of zinc oxide, cerium oxide doped
polyvinyl alcohol films, Journal of Alloys and
Compounds 586, 2014, 333–342.
[27] V. Gupta and A.Mansingh, “Influence of Post
-Deposition Annealing on the Structural and Optical Properties of Sputtered Zinc
Oxide Film,” Journal of Applied Physics,
Vol. 80, No.2, 1996, 1063-1073.
[28] P.K.Ghosh, R.Maity and K.K.Chattopadhyay,
“Elec-trical and Optical Properties of Highly Conducting CdO: Thin Film Deposited
by Sol-Gel Dip Coating Technique,”
Solar Energy Materials and Solar Cells,
Vol. 81, No. 2, 004, 279-289.
[29] K.Gurumurugan, D.Mangalaraj,
S.K.Narayandass and Y.Nakanishi, “DC
Reactive Magnetron Sputtered CdO Thin
Films,”Materials Letters, Vol. 28, No. 4-6, 1996,307-312.
[30] M.Ghosh and C.N.R.Rao, “Solvothermal
Synthesis of CdO and CuO Nanocrystals,”
Chemical Physics Letters, Vol. 393, No.
4-6, 2004, 493-497.
[31] Dattarya Jundale, Shailesh Pawar, Manik Chougule, Prasad Godse, Sanjay Patil, Bharat
Raut, Shashwati Sen, Vikas
Patil,“Nanocrystalline CuO Thin Films for
H2S Monitoring: Microstructural and
Optoelectronic Characterization” Journal of
Sensor Technology, 2011, 1, 36-46.
[32] K.S.Hemalatha, K.Rukmani, N.Suriyamurthy,
B.M. Nagabhushana, Synthesis,
characterization and optical properties of
hybrid PVA–ZnO nanocomposite: A
composition dependent study”, Materials
Research Bulletin 51, 2014, 438–446.
[33] M.Vaseem , Ahmad Umar, S.H.Kim , A.Al-Hajry ,Y.B.Hahn , Growth and structural properties of CuO urchin- like and sheet-like structures prepared by simple solution
process”, Materials Letters 62,2008, 1659– 1662.
[34] J.A.Switzer, H.M.Kothari, P.Poizot, S.
Nakanishi, E.W.Bohannan, Nature 425,2003,
490.
[35] D.Paul Joseph, C.Venkateswaran, R.Selva
Vennila, Critical Analysis on the Structural
and Magnetic Properties of Bulk and
Nanocrystalline Cu-Fe-O, Advances in
Materials Science and
Engineering,Volume2010,2010, Article
ID 715872.
[36] J.G.Simmons,L.I.Maissel, R. Glang , Hand
Book of Thin Film Technology
(McGraw-Hill,NewYork, 1970).
[37] N.F.Mott, E.Davis, Electronic Process in
Noncrystalline Materials, second ed.
(Clarendon, Oxford, 1979).
[38] B.T.Raut, P.R Godse, S.G. Pawar, M.A. Chougul e, D.K.Bandgar, Shashwati Sen, V.B.Patil, New process for fabrication of
polyaniline–CdS nanocomposites: structural,
morphological and optoelectronic investigatio
ns.Phys.Chem. Soli ds 74,2013, 236–244.
[39] S.R.Nalage, S.T Navale, and V.B.Patil,
Polypyrrole-NiO hybrid nanocomposite:
Structural, morphological, optical and electric
al transport studies, Measurement 46, 2013,
Fig.4. SEM of (a) Pure PVA (b) Nano CuO (c) PVA-1%CuO (d)PVA-2%CuO (e) PVA-3%CuO (f) PVA- 4%CuO
a
b
c
d
e
f
ISSN : 2248-9622, Vol. 4, Issue 10( Part - 5), October 2014, pp.38-46
FIG.5.EDX OF (A)NANO CUO(B)PVA-1%CUO(C)PVA-4%CUO
TABLE 1. Activation energy and Conductivity of PVA-CuO Nano-composite films.
S.NO.
COMPOSITION
ACTIVATION ENERGY E(eV) Conductivity 13 1
( ) 10
Scm
Hightemperature range.
Low
temperature range.
(At 308K) (At 398K)
1.
2.
3.
4.
5
.
PVA
PVA-1%CuO
PVA-2%CuO
PVA-3%CuO
PVA-4%CuO
0.081
0.109
0.132
0.143
0.444
0.173
0.180
0.194 0.195
0.197
5.51
6.69
13.35
23.36
31.59
17.90
27.0
53.9 77.1
427.0
B b