Endoplasmic reticulum chaperone Gp96 controls
actomyosin dynamics and protects against
pore-forming toxins
Francisco Sarmento Mesquita1,2, Cláudia Brito1,2,3, Maria J Mazon Moya4, Jorge Campos Pinheiro1,2,3, Serge Mostowy4 , Didier Cabanes1,2,* & Sandra Sousa1,2,**
1 I3S-Instituto de Investigação e Inovação em Saúde, Universidade do Porto, Porto, Portugal 2 Group of Molecular Microbiology, IBMC, Universidade do Porto, Porto, Portugal
3 Instituto de Ciências Biomédicas Abel Salazar (ICBAS), Universidade do Porto, Porto, Portugal 4 Section of Microbiology, MRC Centre for Molecular Bacteriology and Infection (CMBI), Imperial College London, London, UK
*Corresponding author. Tel: +351 220 408 800; E-mail: [email protected] **Corresponding author. Tel: +351 220 408 800; E-mail: [email protected]
Originally published in EMBO reports 18(2), 303–318, December 30, 2016. DOI: 10.15252/embr.201642833
Keywords: actomyosin; endoplasmic reticulum chaperone; Listeria monocytogenes; plasma membrane blebbing; pore-forming toxins
Abstract
During infection, plasma membrane (PM) blebs protect host cells against bacterial pore-forming toxins (PFTs), but were also proposed to promote pathogen dissemination. However, the details and impact of blebbing regulation during infection remained unclear. Here, we identify the endoplasmic reticulum chaperone Gp96 as a novel regulator of PFT-induced blebbing. Gp96 interacts with non-muscle myosin heavy chain IIA (NMHCIIA) and controls its activity and remodelling, which is required for appropriate coordination of bleb formation and retraction. This mechanism involves NMHCIIA–Gp96 interaction and their recruitment to PM blebs and strongly resembles retraction of uropod-like structures from polarized migrating cells, a process that also promotes NMHCIIA–Gp96 association. Consistently, Gp96 and NMHCIIA not only protect the PM integrity from listeriolysin O (LLO) during infection by Listeria monocytogenes but also affect cytoskeletal organization and cell migration. Finally, we validate the association between Gp96 and NMHCIIA in vivo and show that Gp96 is required to protect hosts from LLO-dependent killing.
Introduction
Plasma membrane (PM) blebs are dynamic cell protrusions, which depend on non-muscle myosin II (NMII) activity and have been associated with multiple processes such as apoptosis, cytokinesis and cell migration [1,2]. Regarding bacterial infections, blebs preserve PM integrity upon damage caused by bacterial pore-forming toxins (PFTs) [3]; allow the establishment of an
intracellular replicative niche for Pseudomonas aeruginosa [4]; and are released by infected macrophages promoting Mycobacterium tuberculosis killing by neighbouring macrophages (efferocytosis) [5] or favouring cell-to-cell spreading of Listeria monocytogenes [6].
Listeria monocytogenes (Lm) is a facultative intracellular human foodborne pathogen that causes severe infection in susceptible hosts. Virulence mainly depends on the activity of its secreted PFT, the cholesterol-dependent cytolysin listeriolysin O (LLO) [7,8]. LLO targets phagosomal membranes allowing escape of Lm to the cytosol and has numerous other roles during infection [7]. In particular, LLO promotes pathogen dissemination by inducing controlled necrosis [9] and release of bacterial-containing blebs [6].
Endoplasmic reticulum (ER) stress pathways are central for host survival against PFTs, including LLO, and ER distribution is often altered during intoxication [10,11]. Concurrently, we have shown that Lm infection redistributes the ER chaperone Gp96 to the PM through an uncharacterized mechanism [12]. Gp96 is an ER-resident HSP90 paralogue, which controls the expression and folding of proteins assigned to the secretory pathway and has crucial roles in cellular homoeostasis, host development and immunity [13–15]. Gp96 translocates to the PM where it interacts with different bacteria, modulating adherence, internalization [16–18], survival [19] and endothelial permeability [20]. Cascades involved in these processes may rely on calcium signalling, protein kinase C (PKC) activation and nitric oxide production. However, the molecular outcomes underlying such events remain poorly defined.
Given that PFTs alter ER distribution, we evaluated whether LLO affects Gp96 distribution and function, thereby modulating host responses to Lm. We found that LLO triggers the interaction between Gp96 and NMHCIIA and the concomitant assembly of unique NMHCIIA cortical bundles, which coordinate the formation and retraction of PM blebs and preserve PM integrity during Lm cellular infection. Strikingly, this process resembles the formation of uropod-like structures required for tail retraction during polarized cell migration [21,22] and is controlled by Gp96 that regulates NMII activity and general cytoskeleton-driven cell properties. Importantly, Gp96 interacts with NMHCIIA during in vivo Lm infection and promotes host survival. Our data establish a novel ER–cytoskeletal interplay crucial for host protection against PFT-mediated bacterial infection.
Results
Listeria monocytogenes causes LLO-dependent ER redistribution and promotes the interaction between Gp96 and NMHCIIA
Given that Lm infection leads to increased levels of PM-associated Gp96 and to ER expansion and that different PFTs were reported to alter ER distribution, we studied the effect of LLO on ER morphology and Gp96 surface levels. HeLa cells infected with wild-type (wt) Lm, but not with LLO-deficient bacteria (∆hly), displayed increased Gp96 PM levels and contained distinct ER vacuoles/structures harbouring proteins with ER retention signal (KDEL), including Gp96 (Fig EV1A and B). Purified LLO was sufficient to induce a dose-dependent ER-Gp96 redistribution with ER vacuoles/structures expanding close to the PM (Fig EV1C–E). Concurrently, surface-exposed Gp96 was also increased upon LLO treatment (Fig EV1F).
We tested whether the LLO-mediated ER redistribution could alter Gp96 interacting partners. Gp96 immunoprecipitation (IP) fractions from untreated or LLO-treated HeLa cells were resolved by SDS–PAGE. A specific band from LLO-treated sample was identified, by tandem mass spectrometry (MS) analysis, as non-muscle myosin heavy chain IIA or NMHCIIA (P < 0.05). Peptide coverage spanned 23% of the NMHCIIA sequence, covering all functional domains (Fig EV1G). Immunoblot analysis of Gp96 IP confirmed that LLO triggers NMHCIIA–Gp96 co-IP in a
dose-responsive manner (Fig 1A), yet the interaction decreased upon high concentrations of LLO possibly due to cytotoxicity. LLO increased NMHCIIA–Gp96 coIP also during Lm infection (Figs 1B and EV2A–D). The specificity of the IPs was confirmed using isotype antibodies (Fig EV2A and B). Moreover, the NMHCIIA–Gp96 interaction was amplified throughout the infection time (Fig 1C) and could also be detected in colon epithelial (Caco-2) and macrophage-like (RAW264.7) cells (Fig EV2C and D), showing that Lm infection promotes LLO-dependent NMHCIIA–Gp96 co-IP in various cell types.
Analysis of NMHCIIA and Gp96 cellular distribution revealed that, besides NMHCIIA–Gp96 co-IP, LLO induced the formation of distinct NMHCIIA cortical clusters or bundles which associated with cortical Gp96 in HeLa (Fig 1D) and Ca2 (Fig EV2E). Quantification of NMHCIIA–Gp96 co-localization confirmed that both proteins co-localized within cortical bundles when compared to other cellular regions (control region of interest, ROI) or to the overall NMHCIIA–Gp96 correlation in the entire cell in both untreated and LLO-treated cells (Fig 1E). Infection with wt but not ∆hly Lm promoted the formation of similar cortical structures, often associated with intracellular bacteria (Fig 1F). Thus, through LLO, Lm redistributes the ER, Gp96 and NMHCIIA into unique cortical bundles and triggers novel association between the ER and the host cytoskeleton.
NMHCIIA-ER/Gp96 bundles are hallmarks of PFT-induced blebbing
NMII activity is required for PFT-induced PM blebbing [3]. We thus analysed the dynamics of LLO-induced NMHCIIA remodelling in HeLa cells ectopically expressing GFPNMHCIIA and/or mcherryKDEL (mcherry fused to KDEL signature). LLO induced a profound reorganization of the NMHCIIA network into cortical bundles at sites of PM blebbing (Fig 2A and Movie EV1). Cortical ER structures and vesicles associated with NMHCIIA bundles and localized within PM blebs (Fig 2B and Movie EV2). PM labelling with fluorescently conjugated wheat germ agglutinin (FITCWGA) showed NMHCIIA bundles at PM blebs, which occasionally appeared detached from the cell body (Fig 2C). Phosphorylated ezrin (p-ezrin), which connects the PM to cortical actin and is recruited to PM blebs [23], was present at NMHCIIA bundles (Appendix Fig S1A), further validating the link between bundles and PM blebs.
Pore-forming toxins-induced PM blebbing depends on Ca2+ influx from the extracellular milieu caused by PM damage [3]. Accordingly, treatment of HeLa cells with LLO pre-incubated with cholesterol, which blocks its pore-forming activity but allows cell surface binding and signalling [24], did not enhance NMHCIIA–Gp96 interaction or affect their cellular distribution (Fig 2D and G). LLO treatment carried out in Ca2+-depleted medium disrupted normal NMHCIIA-ER/Gp96 distribution but failed to trigger formation of distinct NMHCIIA bundles and reduced NMHCIIA– Gp96 coIP (Fig 2E and G). In contrast, increasing the extracellular concentration of K+, which prevents the K+ efflux responsible for numerous host responses to PFTs [25], did not affect NMHCIIA bundle formation or NMHCIIA–Gp96 co-IP (Fig 2E and G). Using blebbistatin, which inhibits the NMII contractile force required for PM blebbing [26], we showed that NMII activity is also required for both NMHCIIA–Gp96 co-IP and NMHCIIA bundle formation (Fig 2F and G). We then tested other PFTs inducing PM blebbing and showed that aerolysin (AL) from Aeromonas hydrophila induced formation of NMHCIIA–Gp96 cortical bundles, and AL and streptolysin O (SLO) from Streptococcus pneumonia promoted NMHCIIA–Gp96 co-IP (Fig 2H and I). Finally, in accordance with the transient nature of PM blebbing, host cells recovered normal NMHCIIA and ER distribution by 8 h after LLO washout (Appendix Fig S1B–D). NMHCIIA–Gp96 association and cortical bundling appear thus as hallmarks of PFT-induced PM blebbing that rely on NMII activity and Ca2+ influx upon PFT-induced PM damage.
Gp96 and NMHCIIA regulate PM blebbing through modulation of NMII activity
Next, we evaluated the frequency of cells harbouring NMHCIIA bundles following incubation with LLO, AL or Lm infection of HeLa cells expressing control oligonucleotides (shControl) or oligonucleotides targeting the expression of Gp96 or NMHCIIA (shGp96 and shNMHCIIA) (Appendix Fig S2). For all conditions, Gp96 depletion significantly reduced the frequency of cells with NMHCIIA bundles when compared to controls (Fig 3A–D). Such effect was observed in response to different LLO concentrations (Fig EV3A). LLO-treated shGp96 cells displayed less bundles per cell (Fig EV3B) and showed a disrupted cortical actomyosin network, which appeared unable to bundle. Expectedly, actin co-localized with NMHCIIA bundles (Fig EV3C) and could also hallmark PFT-induced cortical cytoskeletal bundles. Similar to blebbistatin treatment, depletion of NMHCIIA impaired bundling (Figs 3A–C and EV3C).
Subsequently, we studied GFPNMHCIIA dynamics during LLO intoxication in control or Gp96-depleted cells. Upon LLO treatment, shControl cells assembled NMHCIIA bundles and displayed organized PM blebbing with PM blebs expanding and retracting (Fig 3G and Movie EV3). In contrast, shGp96 cells failed to stabilize their NMHCIIA network into cortical bundles and displayed uncontrolled PM blebbing, with more blebs per cell and less bleb retraction throughout the experiment (Fig 3E–G and Movie EV4). Blebbistatin inhibited NMHCIIA rearrangements, causing disruption of cell morphology during LLO treatment (Fig 3G and Movie EV5). These cells showed passive blebbing with limited expansion, which agrees with the requirement of NMII activity for PM blebbing [1,3,23].
NMII activity and actomyosin filaments turnover are regulated by phosphorylation of the myosin II regulatory light chain (MRLC) [27,28]. In resting conditions, when compared to shControl, shGp96 cells showed higher levels of MRLC phosphorylation (pMRLC) (Fig 3H). Moreover, whereas MRLC was rapidly dephosphorylated in shControl cells upon LLO treatment, its phosphorylation was sustained longer in shGp96 cells (Fig 3H). These data demonstrate that Gp96 modulates NMHCIIA activity and dynamics required for actomyosin network remodelling during PM blebbing.
Coordination of PM blebbing resembles control of cell polarity and trailing edge retraction during polarized cell migration
To our knowledge, ER–cytoskeletal interactions during PM blebbing have never been described. However, the ER was associated with the assembly of trailing edge uropod-like Wnt-receptor– actin–myosin polarity (WRAMP) structures during polarized migration [22]. We thus surveyed PFT-induced NMHCIIA bundles for proteins found in WRAMPs. Our co-localization analysis demonstrated that NMHCIIA co-localized with WRAMP markers such as NMHCIIB, lysosomal-associated glycoprotein 1 (LAMP1), tubulin, ERK and filamin A within the cortical cytoskeletal bundles. In addition, actin and calpain 2 also co-localized at cortical bundles (Fig 4A). Notably, filamin A, an actin-crosslinking protein required for uropod retraction [29], also co-immunoprecipitated with Gp96 upon LLO treatment (Fig 4B). Moreover, promoting WRAMP/uropod assembly with Wnt5a [22] induced NMHCIIA–Gp96 co-IP and polarized distribution of NMHCIIA-ER/Gp96 (Fig 4C and D).
Together, these data indicate that NMHCIIA and Gp96 stabilize rapid cytoskeletal rearrangements, which coordinate membrane retraction and cytoskeletal organization in different cellular contexts. Consistently, Gp96 depletion increased formation of stress fibres and focal adhesions (Fig 4E–H), which correlated with an elongated and less circular and irregular cell shape (Fig EV4). On the other hand, NMHCIIA-depleted cells expectedly lack stress fibres (Fig 4E–H) and displayed a less circular and irregular but not elongated cell shape (Fig EV4).
Conclusively, wound closure assay showed that both Gp96- and NMHCIIA-depleted cells display reduced cell migration compared to control cells (Fig 4I and J, and Movie EV6). Thus, Gp96 and NMHCIIA are recruited to polarized cell structures and coordinate cytoskeletal organization and polarity, affecting cell shape, blebbing and migration.
Gp96 and NMHCIIA control PM integrity following LLO treatment of host cells
Given the protective role of PM blebbing during PFT intoxication [3], we investigated whether Gp96 and NMHCIIA depletion affected loss of PM material or compromised PM integrity after LLO treatment. We isolated PM blebs from culture supernatants of LLO-treated cells and observed that shGp96 and shNMHCIIA cells released more PM material to supernatants when compared to shControl cells (Fig 5A and B). The lack of DAPI staining in our samples confirmed that PM bodies were not originated from deadcell detachment (Fig 5A). Subsequently, we assessed PM integrity by flow cytometry, measuring the incorporation of the impermeable dye, propidium iodide (PI). Depletion of Gp96 and NMHCIIA increased PI uptake throughout the time of LLO treatment and upon increasing LLO concentrations (Fig 5C and D). Nevertheless, cells treated with very high concentrations of LLO displayed equivalent PI uptake, consistent with their inability to recover from exposure to overwhelming PFT concentrations (Fig 5D). Moreover, comparing to shControl, shGp96 or shNMHCIIA cells showed reduced ability to recover PM integrity even after 24 h of LLO washout (Fig 5E). These data show that besides regulating PM blebbing, Gp96 and NMHCIIA control PM integrity in response to LLO intoxication.
Gp96 and NMHCIIA preserve PM integrity during Listeria monocytogenes infection Plasma membrane damage caused by PFTs disrupts lipid asymmetry, exposing phosphatidylserine (PS) to the extracellular space [3,6]. Accordingly, exofacial-PS sites labelled with fluorescently conjugated annexin V were virtually absent from untreated cells but were abundantly spread throughout the cell and often colocalized with NMHCIIA cortical bundles upon LLO treatment (Fig 6A). Exofacial-PS was also detected in infected HeLa cells and frequently associated with bacteria and/or NMHCIIA cortical bundles (Fig 6B). Notably, the percentage of cells showing exofacial-PS sites was increased in shGp96 or shNMHCIIA cells, 6 h after bacterial invasion (Fig 6B and C). Consistently, depletion of Gp96 and NMHCIIA from both HeLa cells and RAW264.7 macrophages (Appendix Fig S3A) increased PI uptake by host cells following infection with wt Lm but not with ∆hly bacteria (Fig 6D and E). Equivalent numbers of intracellular bacteria were verified (Appendix Fig S3B and C). These data demonstrate that Gp96 and NMHCIIA, while controlling actomyosin dynamics and PM blebbing, preserve PM integrity from LLO-mediated damage during Lm infection.
Gp96 protects the host against LLO-mediated killing in vivo
We used Lm infection of zebrafish (Danio rerio) larvae to evaluate the protective role of Gp96 during infection in vivo. Zebrafish have a single Gp96 ortholog sharing 85% homology with the human Gp96, and Gp96 morphants (i.e. zebrafish embryos depleted of Gp96 by morpholino oligonucleotides) develop normally at 1, 2 and 5 days post-fertilization (dpf) [30]. Zebrafish was proposed as a suitable model to study Lm pathogenesis and interaction with phagocytes in vivo [31]. We confirmed that Lm injected in the hindbrain of zebrafish larvae 3 dpf colonize the host and cause a dose-dependent lethality that requires LLO expression (Fig EV5A and B). Furthermore, we also verified that Lm recruits and interacts with macrophages in vivo (Fig EV5C
and Movie EV7) and detected bacterial-associated actin clouds and comet tails in vivo (Fig EV5D).
We evaluated whether Lm infection could trigger the formation of Gp96–NMHCIIA complexes in vivo. Gp96 IP from infected larvae revealed that Lm infection promoted a strong NMHCIIA– Gp96 interaction, which was enhanced by LLO expression (Fig 7A). Furthermore, analysis of infected larvae showed an LLO-dependent ER and cytoskeletal disorganization (Fig 7C). Infected Gp96 morphants displayed an apparent increase in tissue damage and bacterial spreading compared to controls (Fig 7B and C), which nicely correlated with an increased bacterial load and diminished host survival (Fig 7D and E). Importantly, lethality of Gp96 infected morphants was dependent on the expression of LLO, since Gp96 morphants recovered from ∆hly infection, even when larvae were inoculated with 10 times more bacteria (Fig 7D). Such recovery was equivalent to the one observed in wt zebrafish larvae (Fig 7F). Hence, Gp96 protects against LLO-mediated killing during Lm infection in vivo.
Discussion
The transient blebs displayed by PFT-wounded cells were proposed to confine PM damage and protect the host cytosol from leakage and Ca2+ overload. Despite the evidences that favour such protective role [3,32], blebbing has been mainly studied in the context of cell migration and it remains unclear how host cells maintain cytoskeletal cohesion during PM recovery responses. We show here that the ER chaperone Gp96 plays an important role during this process. Gp96 modulates NMHCIIA rearrangements and NMII activity required for the assembly of cytoskeletal cortical bundles that coordinate formation and retraction of PM blebs. This mechanism preserves PM integrity against PFTs and intracellular bacteria and involves ER redistribution to cortical sites and interactions between Gp96, NMHCIIA and filamin A. Notably, we demonstrate that these events also occur during cell migration and assembly of uropod-like WRAMP structures, suggesting a common mechanism to regulate PM retraction and cytoskeletal dynamics during PFT-induced PM blebbing and cell migration [21,22,29]. Consistent with our findings, NMII has established roles in both processes [28,33] and Gp96 was recently shown to promote cell polarity and migration [34,35].
How the NMHCIIA–Gp96 interplay coordinates cytoskeleton dynamics and PM remodelling remains elusive. Despite the well-known protective role of PM blebbing against PFT-mediated damage, the apparent opposite effects of Gp96 and NMHCIIA activity in PM blebbing indicate that cytoskeletal homoeostasis must be fine-tuned in order to respond rapidly to changes in organization and polarity, which can regulate PM blebbing and avoid cell death. Such balance of cytoskeletal activity and membrane plasticity may derive from control of vesicular trafficking and organelle dynamics. Different studies have suggested that polarized secretion of lysosomes and redistribution of ER and/or endosomal compartments regulate uropod dynamics and trailing edge retraction during migration of cancer cells or leucocytes [22,36]. We show that ER and LAMP1-positive compartments localized within NMHCIIA bundles and Gp96 was proposed to modulate polarity via vesicular trafficking [35]. Additionally, NMHCIIA can control polarized secretion [37] and organelle positioning [38] and was recently shown to mediate lysosomal exocytosis in PFT-wounded cells [39]. Thus, it is possible that the link NMHCIIA–Gp96 assists the assembly of actomyosin cortical structures in migrating cells or at wound sites through the control of vesicular compartments. In addition, Gp96 can regulate Wnt signalling, which modulates cytoskeletal dynamics and cell polarity, via expression of Wnt co-receptors [14]. We propose that Gp96-mediated actomyosin regulation protects against LLO activity during infection. Pathogenic Escherichia coli can target Gp96 to promote nitric oxide production, Ca2+ oscillations and activation of cellular kinases such as PKC-α and FAK, which disrupts endothelial
cell junctions and mediates bacterial internalization [40]. LLO and other PFTs trigger such events, which were associated with increased tissue damage in vivo [41,42], and NMHCIIA protects the epithelial barrier in vivo [43]. Interestingly, Lm can interact with Gp96 via its surface protein Vip, which promotes bacterial internalization [18]. Vip is not sufficient to activate host kinases and mediate bacterial invasion of host cells. It is thus possible that LLO and Vip act together to modulate the host cell cytoskeleton and control bacterial internalization, cell death and/or endothelial damage in vivo. Notably, deletion of vip affects multiple infection stages besides internalization, which can also be promoted by LLO or reduced by NMHCIIA [18,44,45].
On the other hand, macrophage-specific deletion of gp96 renders mice highly susceptible to Lm, but this phenotype was attributed to the lack of Toll-like receptors (TLRs) [15]. Gp96 did not affect intracellular bacterial replication in vitro or the ability of zebrafish larvae to recover from infection with high doses of LLO-deficient bacteria. The susceptibility of Gp96 morphants may result from a combination of the lack of TLRs and the inability of cells to control LLO-mediated damage. LLO and other PFTs can induce programmed necrosis and PM blebbing in infected macrophages. Both process were proposed to favour infection in vivo [6,9,46]. In agreement with this, larvae infected with wt bacteria display pronounced tissue damage and disorganized ER distribution, phenotypes that appear aggravated in the absence of Gp96.
In conclusion, we describe Gp96 as novel regulator of PM blebbing during PFT-induced PM damage and infection and further highlight the important crosstalk between the ER and cytoskeleton which impacts fundamental cellular processes [47] and innate responses to bacteria.
Materials and Methods Plasmids, antibodies and dyes
Plasmid GFPNMHCIIA (#11347) was obtained from Addgene [48], and mcherryKDEL was a gift from M. Davidson through Addgene (mCherry-ER-3, #55041). The following antibodies were used at 1/200 for immunofluorescence microscopy (IF) or 1/1,000 for immunoblotting (IB): rabbit NMHCIIA (Sigma); mouse antiNMHCIIA (Abcam); rat Gp96 (Enzo); mouse anti-actin, AC-15 (Sigma); rabbit anti-filamin A (Santa Cruz); rabbit anti-MRLC or phospho-MRLCSer19 (Cell Signaling); rabbit Lm (Abcam); mouse α-tubulin (Sigma); goat anti-calpain 2 (Santa Cruz); rabbit anti-NMHCIIB (Sigma), rabbit anti-ERK (Cell Signaling), rabbit anti-calnexin (Millipore); rabbit anti-GRP78 BiP (Abcam); rabbit anti-FAK (Santa Cruz); rabbit phospho-ezrin (Thr567) (Cell Signaling); and mouse anti-KDEL (Abcam). For IF, F-actin was labelled with Alexa Fluor 647- or 555-conjugated phalloidin (Invitrogen), PM with FITC-conjugated WGA (Sigma) that recognizes sialic acid and N-acetylglucosaminyl sugar residues at PM, and DNA with 4’,6-diamidino-2-phenylindole dihydrochloride (DAPI; Sigma). For IF, secondary antibodies were used at 1/500: goat anti-rabbit or anti-mouse Alexa Fluor 488 (Invitrogen), goat anti-rat Alexa Fluor 568 or 647 (Invitrogen), goat anti-rabbit or anti-mouse Cy3 (Jackson ImmunoResearch), goat anti-rabbit or anti-mouse Cy5 (Jackson ImmunoResearch) and donkey anti-goat or anti-rabbit Alexa 555 or 488 (Invitrogen). For IB, secondary antibodies were used at 1/10,000: goat anti-rabbit or anti-mouse HRP (PARIS) and goat antirat HRP (Santa Cruz).
Reagents and toxins
Drug and toxin treatments and washes were carried out in Hanks’ balanced salt solution (HBSS) or as indicated in HBSS Ca2+-free medium or supplemented with 140 mM K+. Blebbistatin
(Sigma) was used at 25 µM for 30 min prior to LLO and maintained throughout the treatment. Cholesterol (Sigma) was used as described [24]. LLO was purified as described [49]. Human active Wnt5a (Abcam) was used at 25 µg/ml for the indicated time. For LLO recovery assays, cells were washed three times in HBSS and recovered in culture medium supplemented with 10% foetal bovine serum (FBS; Biowest). Purified proaerolysin [50] was used at 0.2 nM for 40 min and SLO [51] at 1.5 µg/µl for 30 min.
Cell lines and zebrafish
Caco-2 cells (ATCC HTB-37) were cultivated in EMEM with L-glutamine, supplemented with non-essential amino acids, sodium pyruvate and 20% FBS. HeLa (ATCC CCL-2) and RAW264.7 (ATCC TIB-71) cells were cultivated in DMEM with glucose and L-glutamine, supplemented with 10% FBS. Cells were maintained at 37°C in a 5% CO2 atmosphere. Cell culture media and supplements were from Lonza. Wild-type AB zebrafish were from the Zebrafish International Resource Center (Eugene), and the transgenic line Tg (mpeg1:G/UmCherry) was previously described [52,53]. Embryos were raised at 28°C in E3 medium with 0.003% 1-phenyl-2-thiourea (Sigma) to prevent pigmentation for microscopy. Larvae were anaesthetized with 200 µg/ml tricaine (Sigma) for injection procedure and in vivo imaging.
Transfections, shRNA lentiviral transductions and morpholinos
HeLa cells (5 × 10⁴) seeded into Ibitreat µ-dishes (Ibidi) were transfected with 0.5 µg of the indicated plasmid DNA using jetPRIME® Polyplus-transfection reagent according to the manufacturer’s instructions. The lentiviral shRNA expression plasmids Mission pLKO.1-puro (control) and Mission shRNA-Gp96 or shRNA-Myh9 (Sigma) were used in combination with the envelope plasmid pMD.G and packaging plasmid pCMVR8.91 and co-transfected into HEK293 cells. Viral supernatants were harvested after 72 h, filtered and incubated with target HeLa cells for 48 h. Puromycin was used for selection of cell lines. Efficient knockdown was verified by immunoblot. The following oligonucleotide sequences (Sigma) were used for shRNA knockdown experiments: shControl-SHC016: CCGGGCGCGATAGCGCTAATAATTTCTCGAGAAATTATTAGCGCTATCGCGCTTTTT; shGp96#1.TRCN0000029425: CCGGCCTGTGGATGAATACTGTATTCTCGAGAATACAGTATTCATCCACAGGTTTTT; shGP96#2.TRCN0000029426: CCGGCGTGGTCTGTTTGACGAATATCTCGAGATATTCGTCAAACAGACCACGTTTTT; shGp96#4.TRCN0000276247: CCGGCCATGATATGATGCCTAAATACTCGAGTATTTAGGCATCATATCATGGTTTTTG; shMyh9#1.TRCN0000276055: CCGGCCGCGAAGTCAGCTCCCTAAACTCGAGTTTAGGGAGCTGACTTCGCGGTTTTTG; shMyh9#3.TRCN0000029467: CCGGCCGCGAAGTCAGCTCCCTAAACTCGAGTTTAGGGAGCTGACTTCGCGGTTTTT;
and shMyh9#4.TRCN0000029468: CCGGGCCAAGCTCAAGAACAAGCATCTCGAGATGCTTGTT CTTGAGCTTGGCTTTTT.
Antisense morpholino oligonucleotides, control (TACCAAAAGCTCTCTTATCGAGGGA, with no known target on the zebrafish genome) and Gp96-specific (GAAGTTCAAGTGCATACAAACCTCT)
targeting nuclear processing, were obtained from GeneTools. Thawed morpholinos were heated at 65°C for 10 min to ensure complete dissolution and diluted to the desired concentration (typically, 250–500 µM, for an injected amount of 2–4 ng) in morpholino buffer (120 mM KCl, 10 mM HEPES, pH 7.2) containing 0.1% phenol red. Injections were performed (1 nl/embryo) into one-cell embryos.
Bacterial infections
Wild-type (wt), ∆hly mutant or GFP-expressing wt or ∆hly Lm (EGDe) were grown overnight at 37°C, with shaking, in brain–heart infusion (BHI; BD-Difco), sub-cultured at a 1:10 dilution until optical density of 0.8–1, washed and inoculated into cells at a multiplicity of infection of 50. After 1 h, infection medium was replaced by complete medium with 20 µg/ml gentamicin (Sigma) and infection was allowed to proceed. For injection of zebrafish larvae, washed bacteria were resuspended in phosphate-buffered saline (PBS; Lonza). Anaesthetized zebrafish larvae, 3 days post-fertilization (dpf), were microinjected in the hindbrain ventricle or tail muscle with 0.5–2 nl of bacterial suspension as described [52]. Real inoculum was verified by plating at least three independent larvae onto BHI agar. Infected larvae were transferred into individual wells (containing 1 ml of E3 in 24-well plates), incubated at 30°C and regularly observed under a stereomicroscope. Infections with a quantified standard dose were performed at least three times.
Immunoprecipitation and immunoblotting assays
HeLa, Caco-2 or RAWS264.7 cells (6 × 10⁶ cells) treated as indicated were washed with PBS and lysed in RIPA buffer (Santa Cruz), and lysates were recovered after centrifugation (15,000 g, 10 min, 4°C). For zebrafish larvae, approximately 10 larvae (4 dpf) left uninfected or infected with low dose (200–1,500 CFU/ml) of the indicated Lm strains for 24 h were anaesthetized, rinsed and lysed in 400–600 µl RIPA buffer, and lysates were recovered after two rounds of centrifugation (15,000 g, 10 min, 4°C). Cell lysates (500–700 µg) were pre-cleared with protein G-immobilized PureProteome magnetic beads (Millipore) and incubated overnight (4°C) with 3 µg of anti-Gp96 or 5 µg of anti-NMHCIIA antibodies. Immune complexes were captured with 50 µl of protein G-immobilized magnetic beads (Millipore) and processed for immunoblotting (IB). Protein lysates and IP fractions were resuspended in sample buffer (0.25 mM Tris–Cl, pH 6.8; 10% SDS; 50% glycerol; and 5% b-mercaptoethanol), resolved by SDS–PAGE and transferred onto nitrocellulose membranes (Hybond ECL; GE Healthcare). Primary and secondary HRP-conjugated antibodies were diluted in TBS–Tween (150 mM NaCl; 50 mM Tris–HCl, pH 7.4; and 0.1% Tween). IB were visualized using ECL (Thermo Scientific). Densitometry was performed on film by high-resolution scanning and analysed using ImageJ64 software (NIH).
Protein identification by mass spectrometry
Protein identification was performed by MALDI-TOF/TOF mass spectrometry as described [45]. Protein bands were excised from SDS–polyacrylamide gels, stained using PageBlueTM Protein Staining Solution (Thermo Fisher) and treated to in-gel digestion with trypsin. Peptides were extracted, desalted, concentrated using Ziptips (Millipore), crystallized onto a MALDI sample plate and analysed using a 4700 Proteomics Analyzer MALDI-TOF/TOF (Applied Biosystems). Peptidic mass spectra were acquired in reflector positive mode at a 700- to 4,000-m/z mass window, and proteins were identified by peptide mass fingerprint using Mascot software (Matrix Science, UK) integrated in the GPS Explorer software (ABSCIEX) and searched against
the SwissProt/UniProt Homo sapiens protein sequence database. The maximum error tolerance was 35 ppm, and up to two missed cleavages were allowed.
Immunofluorescence microscopy
Cells were fixed in 3% paraformaldehyde (15 min), quenched with 20 mM NH4Cl (1 h), permeabilized with 0.1% Triton X-100 (5 min) and blocked with 10% BSA in PBS (30 min). Antibodies were diluted in PBS containing 1% BSA. Coverslips were incubated for 1 h with primary antibodies, washed three times in PBS and incubated 45 min with secondary antibodies and phalloidin Alexa 555 or 647. DNA was counterstained with DAPI (Sigma). Coverslips were mounted onto microscope slides with Aqua-Poly/Mount (Polysciences). Images were collected with an epifluorescent Olympus BX53 microscope or a confocal laser-scanning microscope (Leica SP5II) and processed using ImageJ64 or Adobe Photoshop software. Anaesthetized zebrafish larvae were fixed overnight at 4°C in 4% paraformaldehyde with 0.4% Triton X-100, then washed with PBS–0.1% Tween and processed for IF. Larvae were incubated in PBS–1% Triton X-100 (20 min) followed by 3 × 5-min washes in PBS–0.4% Triton X-100 and incubation in blocking solution (PBS supplemented with 10% BSA, 1% DMSO and 0.1% Tween) for 1 h. Primary antibodies were diluted in blocking solution (1/300) and incubated with larvae overnight at 4°C. Larvae were washed 4 × for 15 min each in PBS–0.1% Tween and incubated with secondary antibodies diluted in block solution overnight at 4°C followed by 4 × 15-min washes in PBS–0.1% Tween. Fluorescently labelled larvae were cleared by progressive transfer to 80% glycerol and imaged using a Leica SP5II confocal microscope.
Immunofluorescence quantifications
Unless indicated, for all IF quantifications, at least 200 cells were analysed for each sample in at least three independent experiments. For NMHCIIA bundles, cells were scored positive when displaying at least one compact NMHCIIA or actin bundle. For ER vacuoles, cells were scored positive when displaying at least one KDEL-positive ER distinct vacuole. Individual focal adhesions were detected by FAK labelling. Stress-fibre cells were scored positive when displaying distinct NMHCIIA-actin fibres. For exofacial-PS sites, infected cells were scored positive when displaying at least one distinct punctum of exofacial-PS. DAPI nuclear staining was used for the quantification of the number of cells per field. For colocalization analysis, confocal microscopy images were used to define individual regions of interest (ROIs): entire cell, cortical bundles or equivalent-size cellular regions outside cortical bundles (control ROI). Pearson’s correlation coefficient was obtained using Coloc 2 for FIJI-ImageJ. At least 30 individual cells and 50 bundles or Ctrl ROIs were quantified in six independent experiments for NMHCIIA–Gp96 co-localization analysis and three independent experiments for co-localization analysis of WRAMP components. PM blebs from supernatants of HeLa cells seeded into six-well culture plates (5 × 10⁶ cells), left untreated or treated with 0.5 nM of LLO were collected through mild centrifugation (2,000 g, 10 min) into glass coverslips previously coated with poly-L-lysine solution (Sigma) according to the manufacturer’s instructions. Coverslips were then processed for immunofluorescence microscopic analysis using DAPI and FITCWGA. The levels of PM blebs released to the supernatant upon LLO treatment represent the quantification of total fluorescence (FITCWGA) area per field of view (in arbitrary units) quantified for at least five different fields for each sample from three independent experiments using ImageJ64. Values were normalized to the basal levels obtained for untreated cells.
The samples were collected and fixed in 2,5% glutaraldehyde and 4% paraformaldehyde in 0.1 M sodium cacodylate buffer pH 7.4, post-fixed in 2% OsO4, dehydrated and embedded in Epon (Electron Microscopy Sciences). The ultrathin sections (60 nm) were counterstained with aqueous uranyl acetate solution and lead citrate. Sections were examined under a JEOL JEM 1400 TEM 120 kV (Tokyo, Japan). Images were digitally recorded using a CCD digital camera Orious 1100W (Tokyo, Japan).
Analysis of cell shape parameters
Different live HeLa cell shRNA lines were imaged in three independent days by transmission microscopy using a CKX41 Olympus microscope. Individual cells (shControl n = 227, shGp96 n = 207, shNMHCIIA n = 192) were selected manually and standard shape indicators calculated using ImageJ64. Circularity = 4π × area/perimeter2. A value of 1.0 indicates a perfect circle. Elongation or aspect ratio = major axis/minor axis. Solidity: measurement of the overall concavity or surface irregularity = area/convex area. A value of 1.0 indicates a solid or regular shape where the real area coincides with convex hull area of the same particle. Values < 1.0 indicate surface irregularity.
Live imaging and quantification of PM blebbing of LLO-treated cells
Cells seeded into Ibitreat l-dishes (Ibidi), expressing GFPNMHCIIA alone or combined with mcherryKDEL, maintained in HBSS or HBSS supplemented with the indicated drug treatments at 37°C with 5% CO2 were imaged using an Andor Revolution XD spinning-disk confocal system with an EMCCD iXonEM+ camera, 488-nm lase lines, and a Yokogawa CSU-22 unit on an inverted microscope (IX81; Olympus), driven by Andor IQ live-cell imaging software. LLO (0.5 nM) was added 10 min after initial image acquisition. Differential interference contrast (DIC) images and GFP fluorescent data sets with 0.5-lm z-steps were acquired using a UPLSAPO 100×/1.40 objective lens every 10 s for cells expressing GFPNMHCIIA alone or every 15 s for cells expressing both GFPNMHCIIA and mcherry-KDEL. ImageJ64 was used for image sequence analysis and video assembly. For the quantification of the number of blebs per cell or retracting blebs per cell, 32 shControl cells and 40 shGp96 cells were analysed during an average of 1,501 ± 103.1 s (shControl) and 1,636 ± 229.0 s for shGp96 samples. Blebs were detected by analysis of DIC or transmission images.
Wound closure assay
Confluent HeLa cell monolayers seeded into Ibitreat culture-insert µ-dishes (Ibidi) were imaged using the Axiovert 200M microscope (Zeiss) equipped with a NanoScan Piezo Z stage (Prior Scientific Instruments), driven by Micro-Manager 1.4 software, and transmission images acquired every 10 min with A-Plan 20×/0.30 phase objective after removal of silicon stopper. Samples were maintained at 37°C with 5% CO2, and for each sample, at least three independent areas were imaged for three independent wounds. Images were compiled and analysed using ImageJ64.
Flow cytometry analysis of LLO-treated and infected cells
For flow cytometry, 5 × 10⁶ cells seeded in six-well plates 24 h before use and treated as indicated were washed twice in ice-cold PBS, trypsinized and resuspended in 0.5 ml of cold PBS containing 2 lg/ml PI. For detection of Gp96 surface levels, cells were immunolabelled with PE-conjugated rat anti-Gp96 9G10 (Enzo) and PI was used to discriminate live cells. At least 20,000
cells were analysed for each sample of LLO-treated cells or 5,000 to 10,000 of GFP-positive for infected samples. Analysis was carried out using a FACSCalibur cytometer or FACSCanto II flow cytometer (BD Biosciences), and data were analysed using FlowJo (TreeStar).
In vivo imaging of infected larvae
Anaesthetized zebrafish larvae were oriented and immobilized in 1% low-melting-point agarose in 60-mm plastic-bottom Petri dishes and then covered with 2 ml E3 medium containing tricaine. Transmission and fluorescence widefield imaging was done using a Leica M205FA at 30°C with a 10× Planapo objective. Multiple-field Z-stacks with a 10-µm Z-step were acquired every 15 min.
Determination of bacterial burden in vivo
Animals were anaesthetized, rinsed and collected in 30 µl of sterile water. Lysis was carried out in 200 µl of 0.4% Triton X-100, and serial dilutions of the homogenates were plated onto BHI for CFU counts.
Statistical analyses
Statistical analyses were carried out with Prism 6 software (GraphPad) using one-way ANOVA with Dunnett’s post hoc analyses to compare different means in relation to a control sample, Tukey’s post hoc analyses for pairwise comparisons of more than two different means, or using two-tailed unpaired Student’s t-test for comparison of means between two samples. Survival curves were analysed using log-rank (Mantel–Cox) test.
Acknowledgements
We are grateful to M.T. Almeida and M. Martins who made preliminary observations on the Gp96–NMHCIIA interaction. We are thankful to P. Cossart from Institut Pasteur, Paris, France; O.V. Vieira from CEDOC, Nova Medical School Lisbon, Portugal; and G. Van der Goot from École Polytechnique Fédérale de Lausanne, Switzerland, for the kind gift of purified LLO, SLO and aerolysin, respectively. We thank C. Leitão (AFCU), P. Sampaio (ALM) and R. Fernandes (HEMS) from IBMC facilities for technical assistance and J. Bessa and J. Marques for guidance in zebrafish experiments. This work was supported by national funds through FCT—Fundação para a Ciência e a Tecnologia/MEC—Ministério da Educação e Ciência and cofunded by Fundo Europeu de Desenvolvimento Regional (FEDER) within the partnership agreement PT2020 related to the research unit number 4293 and through the Operational Competitiveness Programme (COMPETE) under the project “NORTE-07-0124-FEDER-000002-Host-Pathogen Interactions” cofunded by Programa Operacional Regional do Norte (ON.2—O Novo Norte), under the Quadro de Referência Estratégico Nacional (QREN), through the FEDER and by FCT. It also received support from a Research Grant 2014 by European Society of Clinical Microbiology and Infectious Diseases (ESCMID) (to SS) and from PT2020 research project Infect-ERA/0001/2013 PROANTILIS. Work in the SM Laboratory is supported by a Wellcome Trust Research Career Development Fellowship (WT097411MA) and the Lister Institute of Preventive Medicine. FSM was funded through an EMBO Long-term Postdoctoral Fellowship (EMBO ALTF 864-2012) and a FCT Post-Doctoral Fellowship (SFRH/BPD/94458/2013) through FCT/MEC co-funded by QREN and POPH (Programa Operacional Potencial Humano). CB and JCP received FCT Doctoral Fellowships (SFRH/BD/112217/2015 and SFRH/BD/86871/2012, respectively). SS was supported by FCT Investigator Programme (COMPETE, POPH and FCT).
Author contributions
FSM, DC and SS conceived and designed the experiments. FSM, CB and MJMM performed the experiments. FSM, CB, MJMM, SM, DC and SS analysed the data. JCP engineered bacterial strains. SM contributed to discussions. FSM, DC and SS wrote the manuscript.
Conflict of interest
The authors declare that they have no conflict of interest. References
1. Charras G, Paluch E (2008) Blebs lead the way: how to migrate without lamellipodia. Nat Rev Mol Cell Biol 9: 730 – 736
2. Fackler OT, Grosse R (2008) Cell motility through plasma membrane blebbing. J Cell Biol 181: 879 – 884
3. Babiychuk EB, Monastyrskaya K, Potez S, Draeger A (2011) Blebbing confers resistance against cell lysis. Cell Death Differ 18: 80 – 89
4. Angus AA, Lee AA, Augustin DK, Lee EJ, Evans DJ, Fleiszig SMJ (2008) Pseudomonas aeruginosa induces membrane blebs in epithelial cells, which are utilized as a niche for intracellular replication and motility. Infect Immun 76: 1992 – 2001
5. Martin CJ, Booty MG, Rosebrock TR, Nunes-Alves C, Desjardins DM, Keren I, Fortune SM, Remold HG, Behar SM (2012) Efferocytosis is an innate antibacterial mechanism. Cell Host Microbe 12: 289 – 300
6. Czuczman MA, Fattouh R, van Rijn JM, Canadien V, Osborne S, Muise AM, Kuchroo VK, Higgins DE, Brumell JH (2014) Listeria monocytogenes exploits efferocytosis to promote cell-to-cell spread. Nature 509: 230 – 234
7. Hamon MA, Ribet D, Stavru F, Cossart P (2012) Listeriolysin O: the Swiss army knife of Listeria. Trends Microbiol 20: 360 – 368
8. Camejo A, Carvalho F, Reis O, Leitao E, Sousa S, Cabanes D (2011) The arsenal of virulence factors deployed by Listeria monocytogenes to promote its cell infection cycle. Virulence 2: 379 – 394
9. Di Paolo NC, Doronin K, Baldwin LK, Papayannopoulou T, Shayakhmetov DM (2013) The transcription factor IRF3 triggers “defensive suicide” necrosis in response to viral and bacterial pathogens. Cell Rep 3: 1840 – 1846
10. Bischof LJ, Kao CY, Los FCO, Gonzalez MR, Shen ZX, Briggs SP, van der Goot FG, Aroian RV (2008) Activation of the unfolded protein response is required for defenses against bacterial pore-forming toxin in vivo. PLoS Pathog 4: e1000176
11. Abrami L, Fivaz M, Glauser PE, Parton RG, van der Goot FG (1998) A pore-forming toxin interacts with a GPI-anchored protein and causes vacuolation of the endoplasmic reticulum. J Cell Biol 140: 525 – 540
12. Martins M, Custodio R, Camejo A, Almeida MT, Cabanes D, Sousa S (2012) Listeria monocytogenes triggers the cell surface expression of Gp96 protein and interacts with its N terminus to support cellular infection. J Biol Chem 287: 43083 – 43093
13. Rachidi S, Sun S, Wu BX, Jones E, Drake RR, Ogretmen B, Cowart LA, Clarke CJ, Hannun YA, Chiosis G et al (2015) Endoplasmic reticulum heat shock protein gp96 maintains liver homeostasis and promotes hepatocellular carcinogenesis. J Hepatol 62: 879 – 888
14. Liu B, Staron M, Hong F, Wu BX, Sun SL, Morales C, Crosson CE, Tomlinson S, Kim I, Wu DQ et al (2013) Essential roles of grp94 in gut homeostasis via chaperoning canonical Wnt pathway. Proc Natl Acad Sci USA 110: 6877 – 6882
15. Yang Y, Liu B, Dai J, Srivastava PK, Zammit DJ, Lefrangois L, Li ZH (2007) Heat shock protein gp96 is a master chaperone for toll-like receptors and is important in the innate function of macrophages. Immunity 26: 215 – 226
16. Rolhion N, Barnich N, Bringer MA, Glasser AL, Ranc J, Hebuterne X, Hofman P, Darfeuille-Michaud A (2010) Abnormally expressed ER stress response chaperone Gp96 in CD favours adherent-invasive Escherichia coli invasion. Gut 59: 1355 – 1362
17. Prasadarao NV (2002) Identification of Escherichia coli outer membrane protein A receptor on human brain microvascular endothelial cells. Infect Immun 70: 4556 – 4563
18. Cabanes D, Sousa S, Cebria A, Lecuit M, Garcia-del Portillo F, Cossart P (2005) Gp96 is a receptor for a novel Listeria monocytogenes virulence factor, Vip, a surface protein. EMBO J 24: 2827 – 2838
19. Mittal R, Prasadarao NV (2011) Gp96 expression in neutrophils is critical for the onset of Escherichia coli K1 (RS218) meningitis. Nat Commun 2: 552
20. Karassek S, Starost L, Solbach J, Greune L, Sano Y, Kanda T, Kim K, Schmidt MA (2015) Pertussis toxin exploits specific host cell signaling pathways for promoting invasion and translocation of Escherichia coli K1 RS218 in human brain-derived microvascular endothelial cells. J Biol Chem 290: 24835 – 24843
21. Sanchez-Madrid F, Serrador JM (2009) Bringing up the rear: defining the roles of the uropod. Nat Rev Mol Cell Biol 10: 353 – 359
22. Witze ES, Connacher MK, Houel S, Schwartz MP, Morphew MK, Reid L, Sacks DB, Anseth KS, Ahn NG (2013) Wnt5a directs polarized calcium gradients by recruiting cortical endoplasmic reticulum to the cell trailing edge. Dev Cell 26: 645 – 657
23. Charras GT, Hu CK, Coughlin M, Mitchison TJ (2006) Reassembly of contractile actin cortex in cell blebs. J Cell Biol 175: 477 – 490
24. Jacobs T, Darji A, Frahm N, Rohde M, Wehland J, Chakraborty T, Weiss S (1998) Listeriolysin O: cholesterol inhibits cytolysis but not binding to cellular membranes. Mol Microbiol 28: 1081 – 1089
25. Gonzalez MR, Bischofberger M, Freche B, Ho S, Parton RG, van der Goot FG (2011) Pore-forming toxins induce multiple cellular responses promoting survival. Cell Microbiol 13: 1026 – 1043
26. Straight AF, Cheung A, Limouze J, Chen I, Westwood NJ, Sellers JR, Mitchison TJ (2003) Dissecting temporal and spatial control of cytokinesis with a myosin II Inhibitor. Science 299: 1743 – 1747
27. Watanabe T, Hosoya H, Yonemura S (2007) Regulation of myosin II dynamics by phosphorylation and dephosphorylation of its light chain in epithelial cells. Mol Biol Cell 18: 605 – 616
28. Vicente-Manzanares M, Ma X, Adelstein RS, Horwitz AR (2009) Nonmuscle myosin II takes centre stage in cell adhesion and migration. Nat Rev Mol Cell Biol 10: 778 – 790
29. Sun CX, Forster C, Nakamura F, Glogauer M (2013) Filamin-A regulates neutrophil uropod retraction through RhoA during chemotaxis. PLoS One 8: e79009
30. Sumanas S, Larson JD, Miller Bever M (2003) Zebrafish chaperone protein GP96 is required for otolith formation during ear development. Dev Biol 261: 443 – 455
31. Levraud JP, Disson O, Kissa K, Bonne I, Cossart P, Herbomel P, Lecuit M (2009) Real-time observation of Listeria monocytogenes-phagocyte interactions in living zebrafish larvae. Infect Immun 77: 3651 – 3660
32. Schoenauer R, Atanassoff AP, Wolfmeier H, Pelegrin P, Babiychuk EB, Draeger A (2014) P2X7 receptors mediate resistance to toxin-induced cell lysis. Biochim Biophys Acta 1843: 915 – 922 33. Wickman GR, Julian L, Mardilovich K, Schumacher S, Munro J, Rath N, Zander SAL, Mleczak A, Sumpton D, Morrice N et al (2013) Blebs produced by actin-myosin contraction during apoptosis release damageassociated molecular pattern proteins before secondary necrosis occurs. Cell Death Differ 20: 1293 – 1305
34. Hou J, Li X, Li C, Sun L, Zhao Y, Zhao J, Meng S (2015) Plasma membrane gp96 enhances invasion and metastatic potential of liver cancer via regulation of uPAR. Mol Oncol 9: 1312 – 1323
35. Ghosh S, Shinogle HE, Galeva NA, Dobrowsky RT, Blagg BS (2016) Endoplasmic reticulum-resident heat shock protein 90 (HSP90) isoform glucose-regulated protein 94 (GRP94) regulates cell polarity and cancer cell migration by affecting intracellular transport. J Biol Chem 291: 8309 – 8323
36. Colvin RA, Means TK, Diefenbach TJ, Moita LF, Friday RP, Sever S, Campanella GSV, Abrazinski T, Manice LA, Moita C et al (2010) Synaptotagmin-mediated vesicle fusion regulates cell migration. Nat Immunol 11: 495 – 502
37. Andzelm MM, Chen X, Krzewski K, Orange JS, Strominger JL (2007) Myosin IIA is required for cytolytic granule exocytosis in human NK cells. J Exp Med 204: 2285 – 2291
38. Pertuy F, Eckly A, Weber J, Proamer F, Rinckel J-Y, Lanza F, Gachet C, Leon C (2014) Myosin IIA is critical for organelle distribution and F-actin organization in megakaryocytes and platelets. Blood 123: 1261 – 1269
39. Encarnacao M, Espada L, Escrevente C, Mateus D, Ramalho J, Michelet X, Santarino I, Hsu VW, Brenner MB, Barral D et al (2016) A Rab3a-dependent complex essential for lysosome positioning and plasma membrane repair. J Cell Biol 213: 631 – 640
40. Mittal R, Prasadarao NV (2010) Nitric oxide/cGMP signalling induces Escherichia coli K1 receptor expression and modulates the permeability in human brain endothelial cell monolayers during invasion. Cell Microbiol 12: 67 – 83
41. Alhamdi Y, Neill DR, Abrams ST, Malak HA, Yahya R, Barrett-Jolley R, Wang G, Kadioglu A, Toh CH (2015) Circulating pneumolysin is a potent inducer of cardiac injury during pneumococcal infection. PLoS Pathog 11: e1004836
42. Chen F, Kumar S, Yu Y, Aggarwal S, Gross C, Wang Y, Chakraborty T, Verin AD, Catravas JD, Lucas R et al (2014) PKC-dependent phosphorylation of eNOS at T495 regulates eNOS coupling and endothelial barrier function in response to G+ -toxins. PLoS One 9: e99823
43. Naydenov NG, Feygin A, Wang D, Kuemmerle JF, Harris G, Conti MA, Adelstein RS, Ivanov AI (2016) Nonmuscle myosin IIA regulates intestinal epithelial barrier in vivo and plays a protective role during experimental colitis. Sci Rep 6: 24161
44. Dramsi S, Cossart P (2003) Listeriolysin O-mediated calcium influx potentiates entry of Listeria monocytogenes into the human Hep-2 epithelial cell line. Infect Immun 71: 3614 – 3618
45. Almeida MT, Mesquita FS, Cruz R, Osorio H, Custodio R, Brito C, Vingadassalom D, Martins M, Leong JM, Holden DW et al (2015) Srcdependent tyrosine phosphorylation of non-muscle myosin heavy chainIIA restricts Listeria monocytogenes cellular infection. J Biol Chem 290: 8383 – 8395
46. Gonzalez-Juarbe N, Gilley RP, Hinojosa CA, Bradley KM, Kamei A, Gao G, Dube PH, Bergman MA, Orihuela CJ (2015) Pore-forming toxins induce macrophage necroptosis during acute bacterial pneumonia. PLoS Pathog 11: e1005337
47. Gurel PS, Hatch AL, Higgs HN (2014) Connecting the cytoskeleton to the endoplasmic reticulum and golgi. Curr Biol 24: R660 – R672
48. Wei QZ, Adelstein RS (2000) Conditional expression of a truncated fragment of nonmuscle myosin II-A alters cell shape but not cytokinesis in HeLa cells. Mol Biol Cell 11: 3617 – 3627 49. Glomski IJ, Gedde MM, Tsang AW, Swanson JA, Portnoy DA (2002) The Listeria monocytogenes hemolysin has an acidic pH optimum to compartmentalize activity and prevent damage to infected host cells. J Cell Biol 156: 1029 – 1038
50. Buckley JT (1990) Purification of cloned proaerolysin released by a low protease mutant of Aeromonas salmonicida. Biochem Cell Biol 68: 221 – 224
51. Idone V, Tam C, Goss JW, Toomre D, Pypaert M, Andrews NW (2008) Repair of injured plasma membrane by rapid Ca2+-dependent endocytosis. J Cell Biol 180: 905 – 914
52. Mostowy S, Boucontet L, Mazon Moya MJ, Sirianni A, Boudinot P, Hollinshead M, Cossart P, Herbomel P, Levraud J-P, Colucci-Guyon E (2013) The zebrafish as a new model for the in vivo study of Shigella flexneri interaction with phagocytes and bacterial autophagy. PLoS Pathog 9: e1003588
53. Mazon Moya MJ, Colucci-Guyon E, Mostowy S (2014) Use of Shigella flexneri to study autophagy-cytoskeleton interactions. J Vis Exp 91: e51601
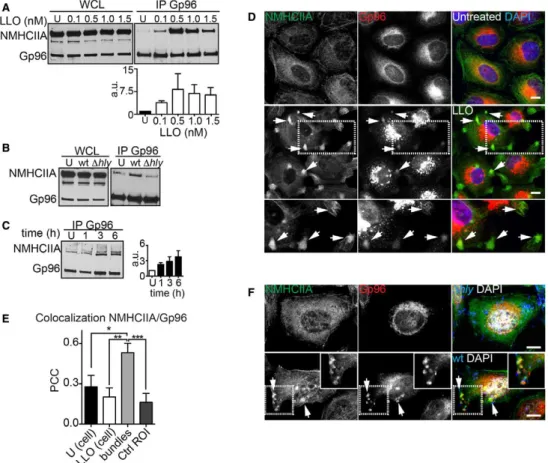
Figure 1. Listeria monocytogenes causes LLO-dependent ER and NMHCIIA redistribution and promotes the interaction between Gp96 and NMHCIIA.
A–C Immunoblots of Gp96 and NMHCIIA levels from whole-cell lysates (WCL) and Gp96 IP fractions (IP Gp96) of HeLa cells: (A) left untreated or treated with increasing concentrations of LLO for 15 min; (B) left uninfected (U) or infected with wt or ∆hly Lm for 1 h; or (C) infected with wt Lm for the indicated time points. (A, C) Quantifications of NMHCIIA in IP Gp96 are the mean ± SEM (n ≥ 3) (a.u., arbitrary units).
D Confocal microscopy images of HeLa cells left untreated or treated with LLO (0.5 nM, 15 min), immunolabelled for NMHCIIA (green) and Gp96 (red) and stained with DAPI (blue). Arrows point to various NMHCIIA–Gp96-positive cortical bundles in different cells. Insets show high-magnification image.
E Quantification of Pearson’s correlation coefficient (PCC) within uninfected cells (U), LLO-treated cells, cortical NMHCIIA bundles or equivalent-size control cellular ROI (Ctrl ROI). Data are mean ± SEM (n = 6); P-values were calculated using one-way ANOVA with Tukey’s post hoc analyses, *P < 0.05, **P < 0.01, ***P < 0.001.
F Confocal microscopy images of HeLa cells infected with wt or ∆hly Lm for 6 h, immunolabelled for NMHCIIA (green), Gp96 (red) and Lm (blue) and stained with DAPI (white). Arrows indicate NMHCIIA–Gp96-positive cortical bundles at cortical sites close to wt Lm.
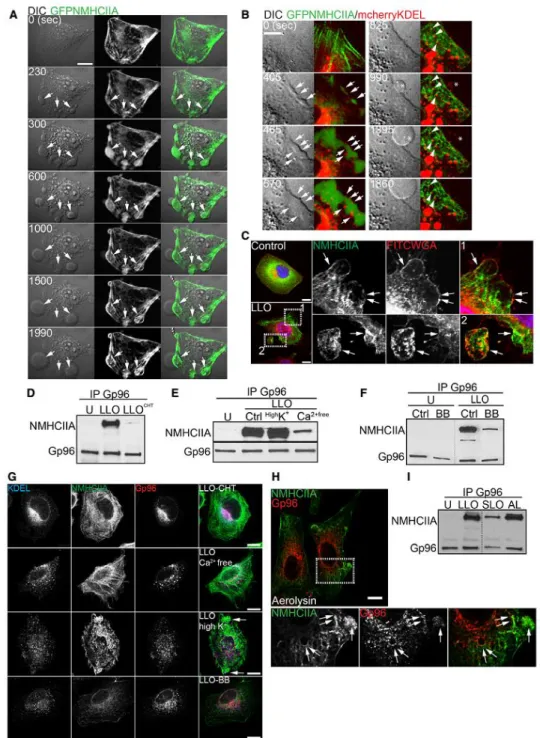
Figure 2. NMHCIIA–Gp96 bundles are hallmarks of PFT-induced PM blebbing.
A, B Sequential frames of time-lapse confocal microscopy sequence of LLO-treated HeLa cells expressing (A) GFPNMHCIIA or (B) simultaneously GFPNMHCIIA and mcherryKDEL. LLO was added to culture medium 10 s before t0. DIC, differential interference contrast. (A) Arrows indicate NMHCIIA bundles at PM blebbing sites.
(B) Highlights depicting ER structures within NMHCIIA bundles and PM blebs. Arrows indicate cortical ER surrounding NMHCIIA accumulations, arrowheads indicate contact points between ER vesicles and NMHCIIA cables, and asterisks point to ER vacuoles within PM blebs.
C Confocal microscopy images of HeLa cells left untreated (control) or treated with LLO (0.5 nM, 15 min). Cells were stained with FITCWGA (plasma membrane, PM; red) and immunolabelled for
NMHCIIA (green). Insets show PM blebs and arrows indicate recruitment of NMHCIIA bundles to PM blebs associated (1) or detached (2) from the cell body.
D–F Immunoblots of Gp96 and NMHCIIA levels from Gp96 IP of HeLa cells left untreated (U) or treated with LLO (0.5 nM, 15 min) (LLO) and (D) LLO pre-incubated with cholesterol (LLOCHT); (E) LLO in medium supplemented with 140 mM K+ (HighK+) and LLO in Ca2+-free medium (Ca2+free); (F) LLO in the presence of 25 µM blebbistatin (BB).
G Confocal microscopy images of HeLa cells treated as indicated and immunolabelled for ER-KDEL (blue), NMHCIIA (green) and Gp96 (red). Arrows indicate NMHCIIA bundles.
H Confocal microscopy images of HeLa cells treated with aerolysin and immunolabelled for NMHCIIA (green) and Gp96 (red). Insets show NMHCIIA bundles and arrows indicate association between Gp96 and NMHCIIA.
I Immunoblots of NMHCIIA and Gp96 levels from Gp96 IP of HeLa cells left untreated (U) or treated with LLO (0.5 nM, 15 min), SLO (1.5 µg/ml, 30 min) (SLO) or aerolysin (0.2 nM, 40 min) (AL). Data information: All scale bars are 10 lm. See also Appendix Fig S1.
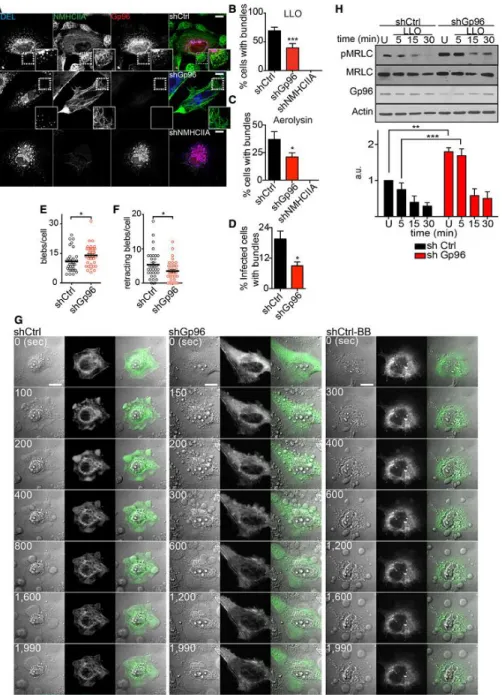
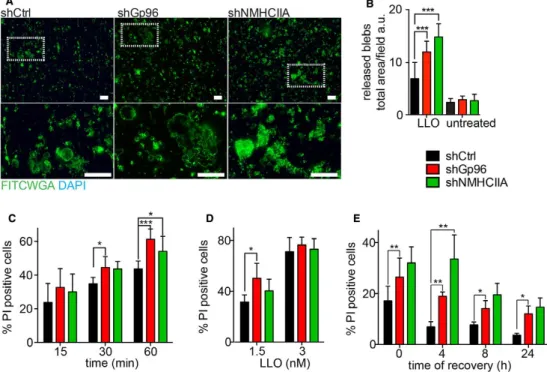
Figure 3. Gp96 controls NMHCIIA remodelling and PM blebbing in response to PFTs.
A Confocal microscopy images of shCtrl, shGp96 or shNMHCIIA HeLa cells treated with LLO (0.5 nM, 15 min) and immunolabelled for KDEL proteins (blue), NMHCIIA (green) and Gp96 (red). Insets show compact NMHCIIA bundles in shCtrl cells and dispersed NMHCIIA bundles in shGp96 cells. Scale bar, 10 µm.
B–D Quantification of the percentage of cells harbouring NMHCIIA bundles after incubation with (B) LLO (0.5 nM, 15 min), (C) aerolysin (0.2 nM, 40 min) or (D) wt Listeria monocytogenes. Values are the mean ± SEM (n ≥ 3); P-values were calculated using (B, C) one-way ANOVA with Dunnett’s post hoc analyses and (D) twotailed unpaired Student’s t-test, *P < 0.5, ***P < 0.001. For shNMHCIIA, bundles were detected following actin staining (Fig EV3C).
E, F Number of (E) blebs per cell or (F) retracting blebs per cell evaluated by time-lapse microscopy analysis of LLO-treated shCtrl or shGp96 cells. shCtrl n = 32 cells and shGp96 n = 40 cells; P-values were calculated using two-tailed unpaired Student’s t-test, *P < 0.5.
G Sequential frames of time-lapse microscopy analysis of LLO-treated HeLa cells expressing GFPNMHCIIA [shCtrl, shGp96 and shCtrl with 25 µM blebbistatin (shCtrlBB)]. LLO was added to culture medium 10 s before t0. Scale bar, 10 µm.
H Immunoblots of Ser19-phosphorylated MRLC (pMRLC), MRLC and actin levels from shCtrl or shGp96 cells left untreated (U) or treated with 0.1 nM LLO for the indicated time points. Quantification of pMRLC levels corresponds to the mean ± SEM (n ≥ 3); P-values were calculated using one-way ANOVA with Tukey’s post hoc analyses, **P < 0.01, ***P < 0.001.
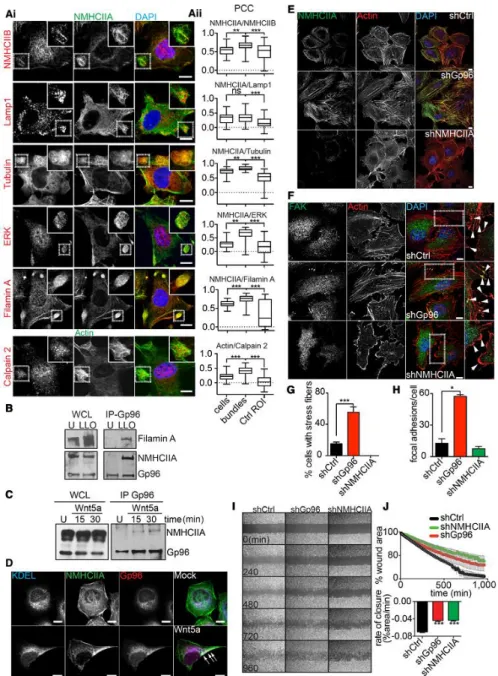
Figure 4. NMHCIIA bundles resemble tail-retraction structures and Gp96 regulates cytoskeleton remodelling.
A Confocal microscopy images (i) of LLO-treated HeLa cells immunolabelled for the indicated proteins. Insets show co-localization between NMHCIIA and WRAMPcomponents at cortical bundles. (ii) Quantification of Pearson’s correlation coefficient (PCC) between NMHCIIA and the indicated proteins within entire LLO-treated cells, cortical bundles or equivalent-size control cellular ROI (Ctrl ROI). For calpain 2, cortical bundles were defined by actin staining. Data are representative of one experiment repeated three independent times with similar results. The boxes extends from the 25th to 75th percentiles. The whiskers are min to max and the horizontal line is plotted at the median.
B Immunoblots of NMHCIIA, Gp96 and filamin A levels from WCL and Gp96 IP of HeLa cells left untreated (U) or treated with LLO (0.5 nM, 15 min) (LLO).
C Immunoblots of NMHCIIA and Gp96 levels from WCL and Gp96 IP of HeLa cells left untreated (U) or treated with 25 µg/ml of Wnt5a for the indicated time.
D Confocal microscopy images of HeLa cells untreated (Mock) or treated with 25 µg/ml of Wnt5a for 30 min. Cells were immunolabelled for ER-KDEL (blue), Gp96 (red) and NMHCIIA (green). Arrows indicate polarized localization of NMHCIIA, ER-KDEL and Gp96 in Wnt5a-treated cells.
E, F Confocal microscopy images of shCtrl, shGp96 or shNMHCIIA HeLa cells stained for actin (red) and DAPI (blue) and immunolabelled for (E) NMHCIIA (green) or (F) focal adhesion kinase (FAK) (green). Insets in (F) show sites with focal adhesion points indicated by arrows.
G, H Quantification of the percentage of cells with (G) stress fibres or (H) focal adhesion points labelled by FAK.
I, J Wound closure assay. (I) Sequential frames of time-lapse microscopy of HeLa cells grown to confluence separated by a stopper. Stopper was removed at t0 and cellular migration was imaged for the indicated times. (J) Quantification of the percentage of wound area occupied by migrating cells over time, stopper removal (upper panel), and respective rate of closure (lower panel).
Data information: Scale bars, 10 lm. Data in (G, H and J) are the mean ± SEM (n ≥ 3). P-values were calculated using one-way ANOVA with Tukey’s post hoc analyses (A) or Dunnett’s post hoc analyses (G, H and J), *P < 0.05, **P < 0.01, ***P < 0.001, ns, non-significant. See also Fig EV4.
Figure 5. Gp96 and NMHCIIA reduce release of PM blebs and protect PM integrity upon LLO. A Epifluorescence microscopy images of supernatants from LLO-treated (0.5 nM, 15 min) shCtrl, shGp96 or shNMHCIIA HeLa cells collected into poly-L-lysine-coated coverslips, fixed and stained with FITCWGA (green) and DAPI (blue). Insets show PM blebs of variable sizes and DAPI staining confirms the absence of cell nuclei. Scale bars, 10 µm.
B Quantification of released PM blebs (total FITCWGA/field). Values are the means ± SEM (n ≥ 3).
C–E Flow cytometry analysis of the percentage of PI-positive shCtrl, shGp96 or shNMHCIIA HeLa cells. Cells were treated with (C) 0.5 nM LLO for the indicated times, (D) 1.5 or 3 nM LLO for 15 min or (E) 0.1 nM LLO for 10 min followed by LLO washout and recovery for the indicated times. Levels of PI incorporation by untreated cells were subtracted from all LLO-treated samples. Values are the mean ± SEM (n ≥ 4).
Data information: P-values were calculated using one-way ANOVA with Tukey’s post hoc analyses, *P < 0.5, **P < 0.01, ***P < 0.001.
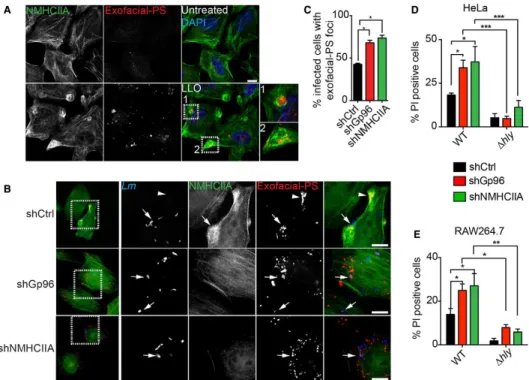
Figure 6. Gp96 and NMHCIIA preserve PM integrity during Listeria monocytogenes infection. A, B Epifluorescence microscopy images of HeLa cells (A) left untreated or treated with LLO (0.5 nM, 15 min) and (B) infected with GFP-expressing wt Lm for 6 h. Cells were incubated with exofacial-PS probe (Alexa-568 annexin A5) (red) 30 min prior to fixation, immunolabelled for NMHCIIA (green) and stained with DAPI (blue). Insets show PM damage marked by exofacial-PS sites. Arrows indicate exofacial-exofacial-PS associated with intracellular bacteria and in shCtrl cells with NMHCIIA bundles; arrowheads indicate NMHCIIA bundles associated with exofacial-PS sites without detectable bacteria. Scale bar, 10 µm.
C Quantification of the percentage of infected cells with exofacial-PS sites in HeLa cells infected with wt Lm for 6 h. Data are the mean ± SEM (n = 3), and P-values were calculated using one-way ANOVA with Tukey’s post hoc analyses, *P < 0.5.
D, E Flow cytometry analysis of the percentage of PI-positive shCtrl, shGp96 or shNMHCIIA HeLa (D) and RAW264.7 (E) cells, infected with GFP-expressing wt or ∆hly Lm for 6 h. The levels of PI incorporation by uninfected cells were subtracted from infected samples. Values are the mean ± SEM (n ≥ 4), and P-values were calculated using one-way ANOVA with Tukey’s post hoc analyses, *P < 0.5, **P < 0.01, ***P < 0.001. PM permeability was assessed in cells harbouring equivalent numbers of intracellular bacteria (Appendix Fig S3).
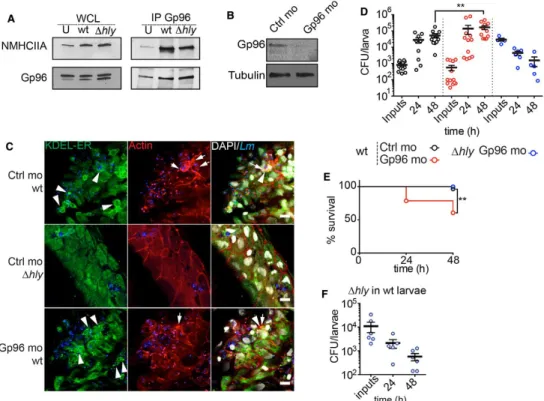
Figure 7. Gp96 interacts with NMHCIIA and promotes host survival during in vivo Listeria monocytogenes infection.
A Immunoblots of NMHCIIA and Gp96 levels from whole-cell lysates (WCL) and IP fractions (IP Gp96) of extracts of zebrafish larvae 3 dpf uninfected (U) or infected with wt or Δhly Lm (low dose, 200–1,500 CFU) for 24 h.
B Immunoblots of Gp96 and tubulin levels from zebrafish 3 dpf larvae injected with control (Ctrl mo) or Gp96 morpholino oligonucleotides (Gp96 mo).
C Confocal microscopy images of zebrafish larvae (Ctrl mo or Gp96 mo) infected (low dose) in the tail muscle with the GFP-expressing wt or Δhly Lm for 24 h, immunolabelled for KDEL proteins (green), and stained with phalloidin (actin, red) and DAPI (white). Images show actin-rich structures at the cell cortex (arrows) and ER-KDEL puncta (arrowheads) in larvae infected with wt strain. Scale bar, 10 µm.
D CFU counts per zebrafish larva (Ctrl or Gp96 mo) infected with wt (low dose) or Δhly (high dose, > 10,000 CFU) Lm and analysed at 0, 24 and 48 hpi. Results are mean ± SEM (n ≥ 3) (horizontal bars), and each circle represents one larva. P-values were calculated using one-way ANOVA with Tukey’s post hoc analyses, **P < 0.01.
E Survival curves of zebrafish larvae (Ctrl mo or Gp96 mo) infected with a wt (low dose) or Δhly (high dose, > 10,000 CFU) Lm. Results are mean ± SEM (n ≥ 3). Wt infection of Ctrl and Gp96 mo, n = 28 larvae; ∆hly infection of Gp96 mo, n = 13. P-values were calculated using log-rank test, **P < 0.01.
F CFU counts per zebrafish larva infected with a high dose of Δhly Lm at different times post-infection. Results are mean ± SEM (n ≥ 3) (horizontal bars); each point represents one larva. Data information: See also Fig EV5.