UNIVERSIDADE CATÓLICA
PORTUGUESA
|
PORTO
FACULDADE DE ECONOMIA E GESTÃO
Masters in Finance
The 2011 Tohoku earthquake: The impact on the energy sectorGuilherme Maria Ferraz de Azevedo Neto April 2013
The 2011 Tohoku earthquake: The impact on the energy sector
Guilherme Maria Ferraz de Azevedo Neto Supervisor: Professor Paulo Alves
Universidade Católica Portuguesa – Centro Regional do Porto Faculdade de Economia e Gestão
3 “As a general rule, the most successful man in life is the man who has the best information.”
4 I would like to thank my supervisor, Professor Paulo Alves, for his continual support and availability in assisting me throughout the long course of this work.
5
Abstract
The purpose of this paper is to study the impact caused by the Tohoku 2011 earthquake, within the energy sector across the World. In order to measure results, a couple of methodologies that resorted to abnormal returns were undertaken and multiple significance tests were made to verify statistical relevancy on the findings. It has been possible to observe a positive reaction on the “Nuclear Energy” companies, as well as a negative impact on the “Renewable Energy” group, with the most prominent results coming from the second methodology. However, due to the lack of statistical significance across most of the data under study, conclusions tend to be inevitably limited.
6
Index
I. Introduction ... 7
II. The Tohoku earthquake and tsunami ... 9
2.1. Understanding the trigger event ... 9
2.2. Timeline analysis ... 11
III. Data and methodology ... 15
3.1. Sample ... 15
3.2. Measuring the effects ... 17
IV. Results ... 19
4.1. Computing the market return from the sample data ... 19
4.2. Using countries stock indices as the market return ... 25
4.3. Overview Analysis ... 31
4.4. The Japanese case... 34
V. Conclusion ... 38
7
I. Introduction
The unpredictability of events that are capable of generating a huge impact in the world’s economy makes them extremely valuable to be analyzed thoroughly, especially from an academic standing point. The 2011 Tohoku earthquake that hit Japan roughly two years ago fits perfectly into the type of events worthy of being studied, as it provides a precious opportunity to observe how the stock markets react from different kind of scopes, may those be from a sectoral level or from a country-by-country perspective.
The way such a major event as a devastating natural disaster catches everyone by surprise, allows for the possibility of assuming the markets couldn’t be reflecting in any way what was about to happen, which is firmly a key point for the basis of the study being undertaken. The more unexpected the events are, the bigger the reactions in the stock markets are also expected to be, as long of course that the event itself leads to serious consequences in the way the economy operates, which has been the case of the Tohoku earthquake.
Another key point that is implicit in this work has to do with the extent to which the global awareness for a known problem can change drastically. The dangers of resorting to nuclear power are surely long known, but determining the impact that an earthquake occurred in Japan produces across borders, gives a rare opportunity to measure how the global perception on potential problematic energy sources can actually change in a short matter of time. The nuclear disaster was confined to the Japanese geographical area, but its economical and financial effects are expected to be felt worldwide due to the magnitude of the event, mostly within the energy sector.
This study aims at trying to assess if the earthquake and its whole series of events that led to the nuclear accidents in the region of Tohoku, actually ended up having any significant impact within the energy sector, not only in Japan,
8 but also in several other countries where a reasonable amount of energy companies are listed on stock markets. This will be done through the computation of multiple tests for different purposes and levels of analysis, from which the abnormal returns observations will allow the measurement of the impact, followed by their respective statistical tests, whenever it’s suitable for the case in question.
Aside of a dedicated timeline analysis, Japan will always deserve a closer look throughout this study, not only because it has literally been the epicenter of the earthquake event, but also due to the fact that its own energy market will be responding in a slightly different way from the rest of the world.
9
II. The Tohoku earthquake and tsunami
2.1. Understanding the trigger event
On March 11 of 2011, an unpredicted earthquake and tsunami struck the Japanese northeastern coast, causing massive damage and destruction, mainly at the Tohoku region. The earthquake occurred at 2:46 PM local time (GMT+9) and was measured at 9.0 on the Richter scale. The magnitude of this natural disaster has been overwhelming and besides the obvious infrastructure damages, the official death toll announced went beyond the 20,000 bodies. When such a surprising event takes place, the economical and social consequences are typically very hard to predict. Having this in mind, the precise moment when the earthquake occurred represents a good opportunity to start measuring several dimensions of the impact, particularly across the financial markets. Unlike several other similar past studies conducted on subjects related to the “information transfers” theme (Firth, 1976; Bowen, Castanias and Daley, 1983; Schipper, 1990), a trigger event coming from an unexpected earthquake and tsunami fits perfectly into the need of being sure that the markets weren’t granted with the chance to previously react and get prepared for such a catalyst event.
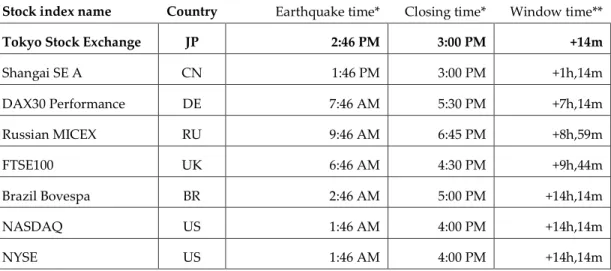
The fact that the earthquake occurred on a Friday, roughly 15 minutes before the Tokyo Stock Exchange closing time (3:00 PM), led to a very small reaction within the Japanese stock markets that day, mostly due to the small window of time. Moreover, there has never been a very accurate awareness of the consequences and dangers triggered by this Tohoku earthquake and tsunami within the first days. The timeline presented in the next chapter can actually help understanding the long sequence of events, but is also a good proof of how the information unfolded very slowly, over several days. As one can see on Table 1, several markets were still open more than 6 hours after the disaster, but
10 even in those circumstances, the effects haven’t been felt in a very visible way on that first day (Friday, 11th of March 2011).
Table 1 – Stock indexes closing time
Stock index name Country Earthquake time* Closing time* Window time** Tokyo Stock Exchange JP 2:46 PM 3:00 PM +14m
Shangai SE A CN 1:46 PM 3:00 PM +1h,14m DAX30 Performance DE 7:46 AM 5:30 PM +7h,14m Russian MICEX RU 9:46 AM 6:45 PM +8h,59m FTSE100 UK 6:46 AM 4:30 PM +9h,44m Brazil Bovespa BR 2:46 AM 5:00 PM +14h,14m NASDAQ US 1:46 AM 4:00 PM +14h,14m NYSE US 1:46 AM 4:00 PM +14h,14m *Local time
11
2.2. Timeline analysis
In order to better understand the sequence of events caused by the Tohoku earthquake that occurred on the 11th of March of 2011, the following timeline has been built on a day-by-day basis. Most of the data and economical information was gathered from a reinsurance company public report (Aon Benfield, 2011), and an online timeline construction made for the days following the event (http://gizmodo.com/5780998/the-definitive-japan-crisis-timeline), lastly updated on May 12, 2011.
Friday (11-03-2011): Roughly at 14:46 (Japanese Standard Time; GMT+9), a strong undersea earthquake hit Japan’s north-eastern coast. The quake’s magnitude was recorded at 9.0 on the Richter scale, making it the fifth largest earthquake to have ever been measured. Following the first temblor, several aftershocks took place and still with a magnitude exceeding 7.0. As an almost immediate reaction to the disaster, the Japanese authorities ordered four nuclear power stations to close down, in order to prevent more serious consequences. The Fukushima Daiichi nuclear power plant (owned by the Tokyo Electric Power Company) was by far the most affected nuclear infra-structure and later that day, all their cooling systems stopped working properly, forcing the Japanese government to issue a first emergency alert. Saturday (12-03-2011): After the growing awareness of how serious the nuclear risk actually was, the Japanese authorities decided to order the evacuation of residents near one of the Fukushima nuclear power plants and started doing examinations for contamination. During the afternoon, a first explosion occurred inside one of the reactors and reports of a radioactive leak started coming out. The United States responded quickly and started sending some help, while at the same time, the evacuation zones were extended to a larger radius.
12 Sunday (13-03-2011): A few cases of positive contamination for radiation exposure in Fukushima were confirmed. The Japanese government announced that roughly 200,000 people were evacuated from the critical area surrounding the Fukushima Daiichi nuclear power plant. With the goal of minimizing the effects of the lack of power supply, the Japanese authorities started rationing energy, in a stage where some of the most affected areas were already deprived of water and energy.
Monday (14-03-2011): The Tokyo Stock Exchange reopened with a predictable drop, ending the day with a fall of -7.49% in the shares price. A second explosion blasted at the Fukushima power plant, destroying the outer building of one of the nuclear reactors and increasing concerns for more serious consequences. Several attempts kept being made to cool down the containment vessels, including pumping sea water. In order to avoid a collapse of the financial system, Japan’s central bank injected a record 15 trillion yen into the market.
Tuesday (15-03-2011): Two more explosions occurred in the Fukushima Daiichi nuclear power plant and a fire broke out in the spent fuel pond inside one of the reactors. The IAEA (International Atomic Energy Agency) reported that the fire had released radioactivity directly into the atmosphere. In the meanwhile, radiation levels surpassed the legal limit, forcing the evacuation of a significant amount of workers. Following the previous days’ efforts to ease the economic impact of such a serious natural disaster, the Bank of Japan announced another 8 trillion yen injection to the financial system. The Tokyo Stock Exchange ended the day with another huge drop, with shares prices losing around -9.47%.
Wednesday (16-03-2011): A new fire broke loose, once again in one of the reactors from the Fukushima Daiichi nuclear power plant. As a direct result from this, white radioactive smoke rose from the nuclear complex, floating into
13 the atmosphere. For the third day in a row, the Bank of Japan pumped another 3.5 trillion yen into the financial system and the Tokyo Stock Exchange finally showed signs of an expressive rebound, ending the day with a rise of 6.64% in the shares price. On the field, fears of a nuclear vessel breached and a massive radiation release into the atmosphere extended the high level of unpredictability for the upcoming days.
Thursday (17-03-2011): The Bank of Japan injected another 6 million yen into the financial markets, as they reinforced their strategy of assuring liquidity in the Japanese short-term money market. After the European Union and the French Nuclear Agency gave voice to their concerns about the real menace coming from the high radiation levels, the US Nuclear Regulatory Commissioner, Gregory Jackzo, revealed his fears that the radiation present in the atmosphere could actually be very close to reach lethal levels.
Friday (18-03-2011): For the fifth day in a row, the Bank of Japan continued to inject funds into the financial system, this time with a 3 million yen transfer. The Tokyo Stock Exchange closed with a positive reaction, with shares prices moving up by 2.42%. In the meanwhile, one of the most troubled Fukushima nuclear reactors got connected to an external power grid, which eased the task for the cooling system and residual heat removal. Close to the end of the day, the IAEA (International Atomic Energy Agency) announced that they had raised the Tohoku nuclear event alert level to 5.
Reactions across several of the main stock indexes in the World, for the day of the event and its subsequent period, are summarized on Table 2, on a day-by-day basis.
14
Table 2 – Stock indexes reaction to the Tohoku nuclear disaster
Stock index name Country Day 0 Day 1 Day 2 Day 3 Day 4 Day 5 Brazil Bovespa BR 0.98% 0.73% -0.24% -1.50% 0.32% 1.00% Shangai SE A CN -0.79% 0.13% -1.41% 1.20% -1.14% 0.33% DAX30 Performance DE -1.16% -1.65% -3.19% -2.01% 2.20% 0.11% Tokyo Stock Exchange JP -1.65% -7.49% -9.47% 6.64% -0.84% 2.42% Russian MICEX RU -0.68% 0.40% -1.52% 0.27% 1.90% 0.56% FTSE100 UK -0.28% -0.92% -1.38% -1.70% 1.75% 0.39% NASDAQ US 0.54% -0.54% -1.25% -1.89% 0.73% 0.29% NYSE US 0.59% -0.66% -1.24% -2.00% 1.70% 0.64% S&P 500 US 0.71% -0.60% -1.12% -1.95% 1.34% 0.43%
*Day 0: 11-03-2011; Day 1: 14-03-2011; Day 2: 15-03-2011; Day 3: 16-03-2011; Day 4: 17-03-2011; Day 5: 18-03-2011
As one would expect, the Japanese Tokyo Stock Exchange was by far the most affected stock market from the list, especially in those 3 working days time span, from “Day 0” (March 11) to “Day 2” (March 15). As it had been reported previously on Table 1, the small time-window available at the Tokyo Stock Exchange on the very same day of the event (14 minutes), somehow delayed the biggest reaction for the following Monday and Tuesday, precisely the period where the stock prices started plunging dramatically.
The effects on the remaining stock indexes as a whole don’t show off any particularly striking trend for the period under study, but a closer look will be given to them further on, through a sectoral analysis.
15
III. Data and methodology
3.1. Sample
The main sample consists in a list of companies involved in the energy sector and picked from a worldwide spectrum. In order to deal with data which could be analyzed further on, all these companies were confined to a criteria that demanded for stocks to be priced in regulated markets. The sample period goes from January 2009 until September 2011 and the focus will be set in studying the stock market effects produced by what has necessarily to be seen as an always unpredictable earthquake, occurred in Tohoku (Japan), on March 11, 2011.
All the data was gathered from Datastream, which allowed to filter the initial sample by industry groups, all related to energy activities. From that point onwards, another Datastream field information concerning a specific text description of all companies’ activities was used, in order to proceed with a more accurate identification that would allow to properly fit them into the 3 main categories:
- Nuclear energy companies (direct and indirect producers) - Renewable energy companies
- Energy companies in general
Countries which had less than 10 companies have been purged from the sample, not only to allow the computed market returns to be more statistically relevant (specifically for the formula used on chapter 4.1), but also to help filtering countries that have strong regulated markets.
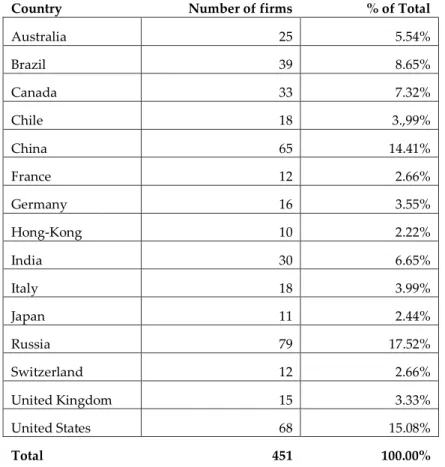
The final sample consists of 451 firms, belonging to 15 different countries and grouped by the 3 main categories that were referred above. This sample comprises 39 companies from the nuclear energy sector, 119 from the renewable
16 energy sector and 293 energy companies in general. The following tables (Tables 3 and 4) summarize how the sample is grouped by countries and categories.
Table 3 – Sample distribution by countries
Country Number of firms % of Total
Australia 25 5.54% Brazil 39 8.65% Canada 33 7.32% Chile 18 3.,99% China 65 14.41% France 12 2.66% Germany 16 3.55% Hong-Kong 10 2.22% India 30 6.65% Italy 18 3.99% Japan 11 2.44% Russia 79 17.52% Switzerland 12 2.66% United Kingdom 15 3.33% United States 68 15.08% Total 451 100.00%
Table 4 – Sample distribution by industry categories
Category/Sector Number of firms % of Total
Energy (in general) 293 64.97%
Nuclear energy 39 8.65%
Renewable energy 119 26.39%
17
3.2. Measuring the effects
With the purpose of measuring information transfers caused by the Fukushima earthquake, the methodology that has been applied consists in a computation of market-adjusted abnormal returns (Alves, Pope & Young, 2009; Alves, Pope & Young, 2010), for each one of the companies included in the sample. This metric will be used to capture the stock markets effects across the sample, in the days following the earthquake. The computation of this methodology will be presented having two variants, with the only difference between the two approaches being precisely the way how the market-return variable was constructed and calculated. As it will be possible to see further on, some slight differences will stand out from the results of these two approaches, even though there won’t be any relevant improvements from one to another, in regard to statistical significance.
The first approach (as it will be shown on chapter 4.1), makes use of Formula 1 and Formula 3, while the second one (chapter 4.2) will capture the reaction effects by computing the market returns from Formula 2 and then the abnormal returns from Formula 3.
Formula 1 (Market-return computed from the sample data):
RM = Value-weighted market return in country k R = Datastream return for firm j, on day t
18
Formula 2 (Market-return from stock indices):
RM = Market return for firm j, in country k, on day t SMIct = Stock Market Index for country c, on day t SMIct-1 = Stock Market Index for country c, on day t-1
Formula 3 (Abnormal returns):
AR = Daily abnormal return for firm i, from country k, on day t R = Datastream return for firm i, on day t
19
IV. Results
4.1. Computing the market return from the sample data
By selecting this first approach, where the market return formula construction for each country is computed directly from the sample data that has been gathered for this study, there’s a plausible possibility that some of the market returns fail at the task of mirroring the true magnitude of the impacts caused by the earthquake event, in every country being analyzed. Naturally, the risk for this to happen will be higher as the number of firms in a certain country decreases and the bigger that market ends up being.
Nonetheless, not only this has been an approach that was successfully used in prior researches (Han and Wild, 1990; Firth, 1996; Thomas and Zhang, 2006), but also and in a certain extent, it ends up granting an advantage in terms of filtering the data being analyzed, into firms that come exclusively from the relevant industry categories picked up for this study.
20
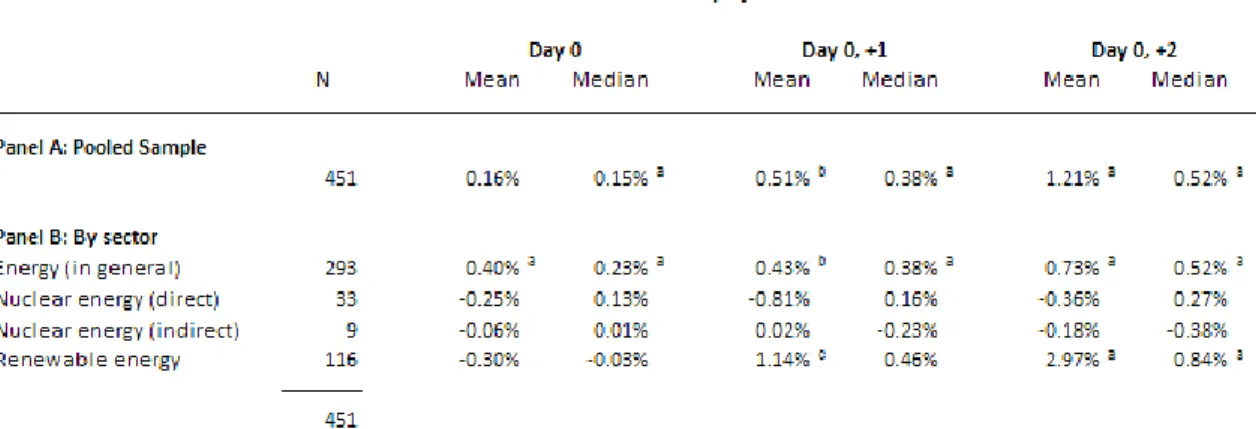
In order to verify the existence of statistical significance in the above results, we conducted one-sample t-tests (at the means) and Wilcoxon test (at the medians). Superscripts a, b and c report precisely the presence of statistical significance at 0.01, 0.05 and 0.1 levels, respectively. Both the "one sample t-tests" as well as the "Wilcoxon tests" assumed µ=0, as the population mean value. All the "one sample t-tests" report to a two-tailed analysis.
Table 5 refers to the abnormal returns reactions when resorting to the sample for computing the market-return variable. Panel A reports the whole sample analysis and it is actually one of the few items for which it is possible to verify a strong statistical significance. Findings don’t indicate any particular big reaction effect when looking into this single group, which indeed gathers the whole sample of companies collected for this study. However, it’s not like it would be expected for it to have any outstanding positive or negative impact.
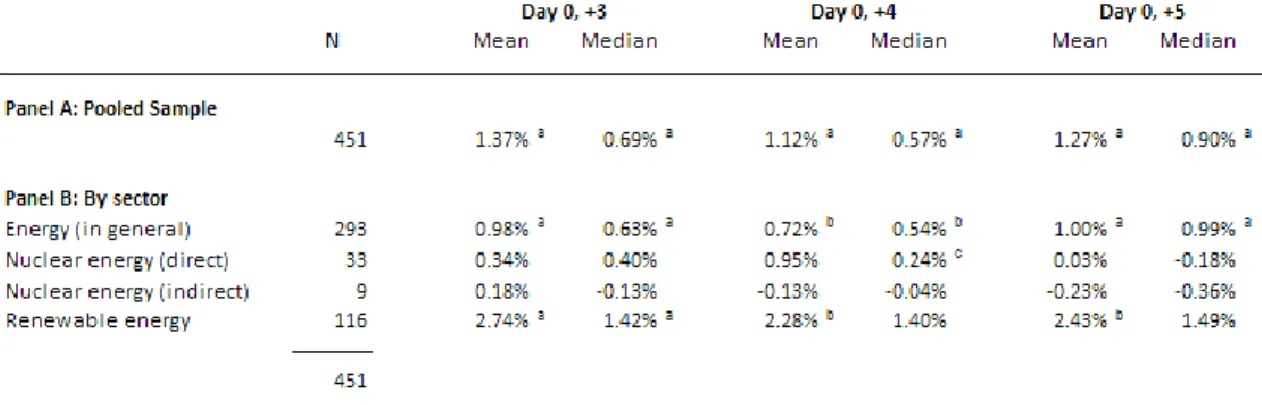
Panel B exhibits the abnormal returns results, through a breakdown view by sector. The only industry groups where data has been statistically significant were the “Energy (in general)” and “Renewable energy” sectors, even though that only happened for some of the days being analyzed. There seems to be a slight positive impact in the “Energy (in general)” sector (“Day 0 +3”, mean: 0.98%; median: 0.63%), but it’s within the “Renewable Energy” group that results appear to be more expressive, at least when looking into a couple of the statistically significant days (“Day 0 +3”, mean: 2.74%; median: 1.42%).
21
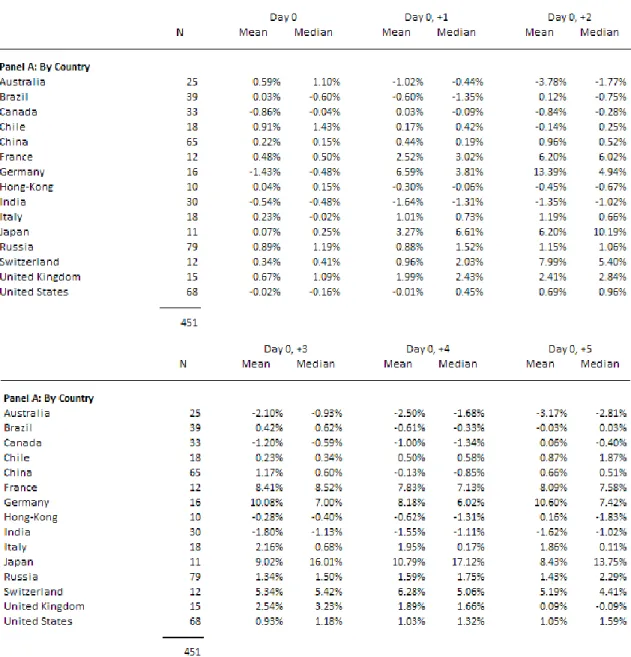
Table 6 – Abnormal returns grouped by country (MR variable computed from the sample)
Table 6 brings the scope into a country-by-country analysis. In the absence of the need for any sort of statistical tests for this table in particular, it becomes easier to outline a few cases that stand out at a first glance. In Germany for example, there’s a notorious positive impact that leads to a +10.60% mean and +7.42% median, at the end of Day 5. There is indeed a slight predominance of “Renewable Energy” companies within the Germany sample (7 out of 16), but this fact single-handedly doesn’t seem to be enough to help explaining such a high and positive effect into the abnormal returns. What seems clear though, is
22 that the German energy companies picked in this sample benefited in a large scale from the Tohoku earthquake that occurred on March 11, 2011.
Unsurprisingly, Japan is another country for which the data differs from the general pattern. This particular case will be discussed and reviewed further on, due to the specificities coming from the fact that the earthquake took place precisely in a Japanese region.
Table 7 – Abnormal returns in Japan by sector (MR variable computed from the sample)
In order to verify the existence of statistical significance in the above results, we conducted one-sample t-tests (at the means) and Wilcoxon test (at the medians). Superscripts a, b and c report precisely the presence of statistical significance at 0.01, 0.05 and 0.1 levels, respectively. Both the "one sample t-tests" as well as the "Wilcoxon tests" assumed µ=0, as the population mean value. All the "one sample t-tests" report to a two-tailed analysis.
The table above illustrates the impact on the abnormal returns in Japan, from a sectoral point of view. However, this country’s small sample led to a low statistical significance on most of the results, which don’t allow to shed much light on any assertive conclusion. As it is shown above, the only two sectors that comprise Japanese companies (“Energy in general” and “Nuclear energy”) have in fact shown signs of a big and positive reaction. Even though there are no
23 renewable energy companies listed in the Japanese sample, the overall impact has clearly been positive and it began to be felt on the first working day following the earthquake (Day 0, +1).
Apparently, there is no remarkable difference standing out from the results when looking strictly at the two sectors being affected, despite the presence of the Tokyo Electric Power company in the Nuclear energy group and its prominent negative impact during the days after the earthquake.
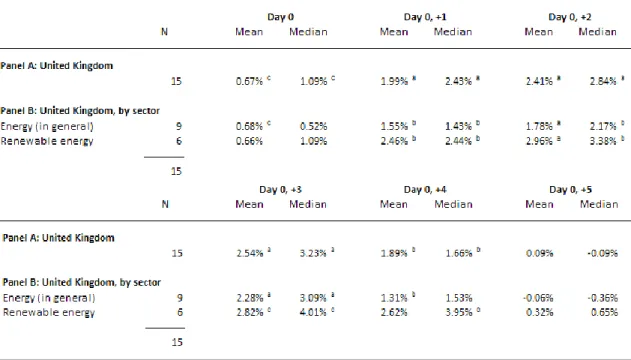
Table 8 – Abnormal returns in the U.K. by sector (MR variable computed from the sample)
In order to verify the existence of statistical significance in the above results, we conducted one-sample t-tests (at the means) and Wilcoxon test (at the medians). Superscripts a, b and c report precisely the presence of statistical significance at 0.01, 0.05 and 0.1 levels, respectively. Both the "one sample t-tests" as well as the "Wilcoxon tests" assumed µ=0, as the population mean value. All the "one sample t-tests" report to a two-tailed analysis.
It’s important to start by noting that the United Kingdom sample doesn’t contain any company belonging to the “Nuclear Energy” group. As for the statistical significance on the results obtained from Table 8, it remains difficult to draw many conclusions due to the weakness of the tests outcomes, particularly in “Day 0” and “Day 0, +5”. There are some indications of a slight
24 positive impact among companies from the “Renewable Energy” sector, even though they drop substantially at the last day of the analysis. The “Energy in general” group appears to reveal a very similar pattern, whereas the positive impact felt during the first days also ended up being offsetted on “Day 0, +5”.
Table 9 – Abnormal returns in the U.S. by sector (MR variable computed from the sample)
In order to verify the existence of statistical significance in the above results, we conducted one-sample t-tests (at the means) and Wilcoxon test (at the medians). Superscripts a, b and c report precisely the presence of statistical significance at 0.01, 0.05 and 0.1 levels, respectively. Both the "one sample t-tests" as well as the "Wilcoxon tests" assumed µ=0, as the population mean value. All the "one sample t-tests" report to a two-tailed analysis.
Table 9 reports the United States results, precisely the second country with the highest amount of companies comprised in the sample (the first one is Russia, with 79). The pooled results seen on Panel A indicate a strong statistical significance particularly for the median tests (t-tests), even though it only happens after the first Monday (Day 0, +1) that followed the earthquake event. As for Panel B, the “Energy in general” group presents a similar behavior to
25 Panel A in terms of statistical significance, with the advantage of extending it to the medians (Wilcoxon tests).
The overall impact in the United States ends up being positive, which is understandable since the “Nuclear Energy” group (direct and indirect) represents 25% of the country’s sample and it’s the only one reporting a negative reaction to the event on “Day 0, +5”. The “Renewable Energy” sector stands out with a 3.75% positive variation (median) on the last day of the analysis, but since the results only revealed statistical significance at a 10% level, any inference must be taken with increased caution.
4.2. Using countries stock indices as the market return
In an attempt of assessing the impact this earthquake has produced with a wider proxy of what the market returns really were, the second approach consists on a more direct approach. Instead of computing the “RM” variable using “Formula 1” as it has been done in the previous chapter, country stock indices were now used to provide a more realistic and broad measure of the market returns for each country (“Formula 2”).
Since this study’s sample comprises companies exclusively linked with the energy sector, by going forward with this approach the “market return” variable will actually mirror how each of these economies reacted to the Tohoku earthquake event, in a more prudent and extensive way. Therefore, the computation of the “RM” variable won’t confine merely to the energy sector, which in return provides this study with another complementary approach to analyze results from a different standpoint.
26
Table 10 – Abnormal returns grouped by sector (MR variable computed from the stock indices)
In order to verify the existence of statistical significance in the above results, we conducted one-sample t-tests (at the means) and Wilcoxon test (at the medians). Superscripts a, b and c report precisely the presence of statistical significance at 0.01, 0.05 and 0.1 levels, respectively. Both the "one sample t-tests" as well as the "Wilcoxon tests" assumed µ=0, as the population mean value. All the "one sample t-tests" report to a two-tailed analysis.
Table 10 presents results for the abnormal returns grouped into a single set (Panel A) and by sector (Panel B). There was almost no statistical significance found in Panel A, as well as in the “Energy (in general)” and “Nuclear energy (direct)” sectors. In the other hand, the “Nuclear Energy (indirect)” and “Renewable energy” groups indicate a strong statistical relevancy, especially across the last two days of the analysis. Results also denote a positive impact at the “green energy” companies (3.52% mean, at the end of “Day 0, +5”), while the “Nuclear energy (indirect)” sector got affected negatively, decreasing 2.65% over the course of the 5 days being examined.
27
Table 11 – Abnormal returns grouped by country (MR variable computed from stock indices)
Results shown on Table 11 refer to an analysis where data has been grouped on a country-by-country basis, and where there was no need to run any t-tests or Wilcoxon tests. Similarly to what had already happened when recurring to the first approach (Table 6), the positive impact within the Germany sample seems to have been the strongest across the 15 countries, with a 12.98% mean and 9.48% median at the end of “Day 5”. A possible explanation for this evidence has already been advanced when discussing the results on Table 6, since
28 Germany’s sample comprises an unusual high amount of “Renewable Energy” companies (43.75%).
In the other hand, Japan’s results exhibit a positive but significantly lower impact, when compared to Table 6. At the end of Day 5, the mean is now at 6.11% and the median at 4.31%, opposed to the respective 8.43% and 13.75% registered when applying the previous methodology. Given the fact that the Japanese economy as a whole was by far the most affected one when parsing data on a country level, it probably becomes easier to understand that when the MR variable is computed from the market stock index (as it was done on this approach), the abnormal results will also display a less prominent effect.
Table 12 – Abnormal returns in Japan by sector (MR variable computed from stock indices)
In order to verify the existence of statistical significance in the above results, we conducted one-sample t-tests (at the means) and Wilcoxon test (at the medians). Superscripts a, b and c report precisely the presence of statistical significance at 0.01, 0.05 and 0.1 levels, respectively. Both the "one sample t-tests" as well as the "Wilcoxon tests" assumed µ=0, as the population mean value. All the "one sample t-tests" report to a two-tailed analysis.
Table 12 lacks sufficient statistical significance to make any meaningful statement. The two sectors that contained any data (“Energy in general” and
29 “Nuclear energy (direct)”), seem to have reacted positively to the earthquake event, with its effects starting to be noted right on Day 0. In this particular case, having set the “MR” variable to be dependent on the whole Japanese market fluctuations, has led to a smaller impact when comparing the results with the ones drawn from Table 7.
Having in mind the big magnitude of the negative impact caused into the Tokyo Electric Power company, as well as its own weight in terms of market-value share within the 11 companies that form the Japanese sample (roughly 30% on Day 0), it becomes easier to understand that switching the “MR” variable for a wider market proxy (the whole Japanese market), somehow allows for the effect to be diluted and for the abnormal returns to denote a smaller impact.
Table 13 – Abnormal returns in the U.K. by sector (MR variable computed from stock indices)
In order to verify the existence of statistical significance in the above results, we conducted one-sample t-tests (at the means) and Wilcoxon test (at the medians). Superscripts a, b and c report precisely the presence of statistical significance at 0.01, 0.05 and 0.1 levels, respectively. Both the "one sample t-tests" as well as the "Wilcoxon tests" assumed µ=0, as the population mean value. All the "one sample t-tests" report to a two-tailed analysis.
30 From the 15 companies forming the U.K. sample detailed in Table 13, there wasn’t a single one belonging to the “Nuclear Energy” sector. There are signs of a minimal statistical significance across the 6 days of the analysis with the exception of “Day 0”, where not only the impact has been scarce but also the “t-tests” and “Wilcoxon “t-tests” showed no evidence that the results were statistically relevant. Unsurprisingly, the grouped data displayed in Panel A presents the highest records of statistical significance from this table, with significance levels always marking either 0.05 or 0.01.
The impact on both panels has been positive, even though it happened in a slightly more pronounced manner across the “Renewable Energy” sector (3.34% mean and 3.72% median at the end of “Day 5”).
Table 14 – Abnormal returns in the U.S. by sector (MR variable computed from stock indices)
In order to verify the existence of statistical significance in the above results, we conducted one-sample t-tests (at the means) and Wilcoxon test (at the medians). Superscripts a, b and c report precisely the presence of statistical significance at 0.01, 0.05 and 0.1 levels, respectively. Both the "one sample t-tests" as well as the "Wilcoxon tests" assumed µ=0, as the population mean value. All the "one sample t-tests" report to a two-tailed analysis.
31 Even though the U.S. sample is composed by a reasonably big amount of companies, it has been hard to retrieve much statistical significance once again, especially for the “Renewable Energy” sector. The Panel A exhibits the U.S. grouped data and it indicates a small negative impact at the end of “Day 5” (mean is at -1.44% and median at -0.91), a similar trend to the one also registered amongst the “Energy (in general)”, and the two Nuclear sectors. The effects have been more noticeable within the “Nuclear Energy” sectors, with a special incidence on the segment for which these companies have activities directly related with nuclear energy production. It was possible to obtain good signs of statistical significance for these two groups, especially across the two last days of the analysis, which was precisely the period where results for both sectors were more pronounced.
4.3. Overview Analysis
As it was pointed out before, two different approaches were used to measure the Tohoku earthquake impact, which resorted to abnormal returns calculations on companies involved in activities within the energy sector. It’s important to note that these approaches only differ in the way how the market-return variable has been calculated. Hence, what actually sets them apart is that the first approach consists in somehow isolating the sample and computing the market-return variable strictly from the weighted data at disposal. Results obtained from this approach are exhibited from Table 5 to Table 9.
As for the second approach, it made use of several sock indices across the world, in order to come up with representative market-return values for each of the countries under analysis. This approach brings to light a wider spectrum of the market reaction and its results are reported in Tables 10-14.
32
Table 15 – Significance tests results; break-down by tables and approaches
Approaches, Tables α = [0.01; 0.05; 0.1] α = 0.01 Approach 1 Table 5 31 14 Table 7 18 4 Table 8 25 10 Table 9 19 14 TOTAL 93 42 Approach 2 Table 11 28 16 Table 13 11 4 Table 14 25 8 Table 15 30 18 TOTAL 94 46
Table 15 summarizes how each of these approaches responded in respect to the statistical significance tests. The data reported above suggests that none of the approaches proved to be more pronouncedly favorable towards the other, at least when judging strictly from the statistical point of view (93 vs 94; 42 vs 46). The results presented in the first column (α = *0.01; 0.05; 0.1]) account for the number of occurrences where data was found to be statistical significant for at least a 10% level of statistical significance. As for the second column (α = 0.01), it reports exclusively for the stronger statistical significant cases, since it only accounts for situations where a statistical significance level of 1% (superscript “a”) was obtained.
With statistical evidence unable to give any striking advantage from one approach over the other, any inferences and conclusions drawn from the results must be taken prudently. Nevertheless, looking at Tables 5 and 10, which account for the whole pooled sample as well as for the overall results grouped
33 by sector, puts into evidence that there was a moderated impact in the main sectors under analysis.
On the last day of the period being studied (Day 0, +5), precisely the occasion where the abnormal returns are expected to have more pronounced results, it’s easily observable that there was a positive impact on the “Renewable Energy” sector, regardless of the approach undertaken. Hence, and focusing on this particular day, statistical significance was clearly stronger on Table 10, as well as the magnitude of the abnormal returns reaction in both metrics (median and mean). A similar situation happened with the “Nuclear Energy” sector, with results being more expressive when the second approach was in place (Table 10). In this group, statistical significance was only to be found within the indirect nuclear energy production subsample, and only across the results obtained in Table 10. The impact shown on Table 5 was very small, with almost no signs of any statistical significance whatsoever not only on Day 5, but also across the entire period.
The largest grouped data is by far the “Energy (in general)” subsample, which comprises 293 companies out of a total of 451 (64.97%). In this group and as it been pointed out previously, it is possible to find energy producing companies with no signs of a prominent activity in either nuclear or renewable sources. Final results (on Day 0, +5) for this group ended up differing substantially when looking at Tables 5 and 10, with a slightly positive impact on the first (1.00% mean and 0.99% median), while the second approach denoted a minor effect, but in the opposite direction (-0.22% mean and -0.39% median). Table 5 was the only one reporting evidence for the existence of statistical significance on that final day, even though its results across the six days under analysis registered always either strong or moderate statistical significance levels (α=0.05 or α=0.01).
34 Finally and without much surprise, the complete pooled sample group (Panel A) drawn from both Tables 5 and 10 indicate a very similar trend to what was already observed in the “Energy (in general)” group. Once again and focusing on the last day of the analysis, the first approach indicates a positive reaction on the mean and median metrics (1.27% and 0.90% respectively), while Table 10 results show a positive mean (0.52%) and a negative median (-0.18%). Statistical significance was also only obtained on the results from Table 5, but any possible conclusions from the effects produced at the whole sample, are naturally of less interest for this study than the ones inferred from each of the sub sample groups.
4.4. The Japanese case
There are a few interesting particularities regarding the effects produced by the 2011 Earthquake across the Japanese nuclear energy companies. As expected, the company the most affected was the Tokyo Electric Power group, owner of the problematic “Fukushima Daiichi Nuclear Power Plant”. However, and in a smaller extent, the Tohoku Electric Power company has also suffered a direct hit from this disaster, as one of its nuclear power plants got severely damaged (the “Onagawa Nuclear Power Plant”), which led to a significant decrease on the company’s capability to serve energy. Apart from these two groups, the remaining nine energy companies from the Japanese sample didn’t suffer any direct noteworthy wreckage, which means their power plants and energy sources didn’t get affected in terms of their maximum generation capacity to serve the energy demand.
That’s precisely one of the key points to understand how the Japanese energy market reacted in the days following the Earthquake event. Nowadays, available technologies to store energy still have considerable limitations,
35 especially when it comes to nuclear sources. These accounted for roughly 30% of Japan’s energy supply before the March 2011 disaster, but that was a scenario on the verge of changing considerably over the days following the earthquake. As seen previously, Table 1 highlights the window of time between the exact moment of the earthquake and the stock markets closing time, for each of the main countries belonging to this study’s sample. In the Japanese case, there were only 14 minutes setting apart the earthquake event and the Tokyo Stock Exchange closure on Friday, but even with such a narrow window of time, the index still suffered a small fall, as it dropped 1.65% at the end of that day. It would be only on Monday though, that the markets really started getting shaken from the earthquake’s massive consequences.
Heavy selling was expected in Japan in the following days to the disaster and that’s exactly what happened as the week unfolded. On Monday (Day 0, +1), roughly 4.88 billion shares were traded, a record-breaking figure at the time, only matched with the World War 2 hectic times. The energy sector has naturally been one of the main targets for investors and while both the Tohoku and Tokyo Electric Power companies saw their shares plunging abruptly, most of the remaining energy groups seem to have benefited considerably from this earthquake event. Table 16 displayed below reports to a closer look at the abnormal returns across the Japanese sample, even though it resorts exclusively to the second approach that we’ve previously presented and discussed (on chapter 4.2). This has to do with the fact that it does grant a more reliable measure for assessing the impact from a whole market-level spectrum and it’s not confined to the industry-level.
36
Table 16 – Abnormal returns in Japan, by company (MR variable computed from stock indices)
Sector 10: Nuclear energy companies Sector 8: General energy companies
On the first Monday following the disaster (Day 0, +1), there was a clear pattern standing out on Table 1, as the Tohoku and Tokyo Electric Power companies jumped into a freefall scenario (with abnormal returns at -11.29% and -49.22% respectively), while the remaining energy companies seem to have gone in a total different direction. The Tokyo Stock Exchange was heavily hit that day, falling 7.49% at the market closure, in a sort of anticipation of the turmoil that would continue devastating the stock markets over the following days.
What’s interesting to note in the Japanese market, is that regardless of the energy companies being primarily of nuclear, renewable or mixed sources, the trend of the impact appears to have been quite different from what happened in the other countries. With Japan’s energy supply capacities decreasing significantly, essentially due to the damage caused at the “Fukushima Daiichi”
37 and “Tohoku” power plants, there was a gap needing to be filled in order to respond to the expected demand for energy. With that in mind, but also knowing that most of the nuclear energy being produced in those power plants couldn’t be technically be stocked, it becomes easier to understand why all the other nine energy companies from the Japanese sample recorded positive abnormal returns during the entire period being analyzed, regardless of its energy sector. This was a pattern different from what has been observed and discussed previously when analyzing Table 10, but finds its reasoning on the fact that the non-directly affected energy companies (perceived as competitors) in Japan, ended up seizing this opportunity to gain more market share and with that, serve, distribute and sell more energy.
38
V. Conclusion
The results drawn from the multiple tables displayed in this study have unfortunately led to very weak statistical significance tests, regardless of the approaches undertaken. With that in mind, any conclusions extrapolated from the results had to be necessarily taken with extra caution and prudence.
Tables 5 and 10 report to the most relevant findings we had proposed to study in this work, since they present all the gathered data, grouped by the main energy sectors under analysis (which can be seen in both Panels B). Both tables show similar patterns, especially when the focus is set at the “Nuclear Energy” and “Renewable Energy” sectors. As expected, results appear to indicate that the Fukushima earthquake and the nuclear accidents that followed it, have indeed led to a negative impact within companies on which energy sources are primarily coming from nuclear production, and in the other hand, companies more dependent on renewable energy sources seem to have benefited marginally from this series of events triggered by the Japanese earthquake. As denoted previously, this overall impact was significantly bigger when using the second approach, which also goes in line with what was expected prior to this work. Computing the MR variable from a clearly wider market pool, as it has been done by picking major national stock indices, instead of relying strictly in our sample data to calculate weighted average returns for each country (first approach), ended up producing greater effects in the abnormal returns that were obtained across most of the tables presented in this study.
Findings coming from the two tables that were built on a country-level basis (Table 6 and Table 11) were never intended to be of extreme relevance or even to be analyzed scrupulously in this study, simply because results might be deceptive due to the offset effect coming from the nature of the energy companies gathered for each country subsample. An extreme example could
39 come from a country having 10 nuclear and 10 renewable energy companies, where the two groups would produce opposite effects and actually offset each other. Nevertheless and with a few exceptions, there seems to have been a general trend for a positive effect across the countries sample, most likely due to the fact that only 8.65% of our global sample is formed by “Nuclear energy” companies (39 out of 451), precisely the group more prone to react negatively to the events under the scope.
As for Japan, results have shown us that its energy market reacted in a very unique way, regardless of the energy source of the companies. Apart from the two nuclear energy companies that were strongly hit by the earthquake effects (the Tokyo and Tohoku electric power companies), the remaining nine recorded a positive boost in their abnormal returns results. The plausible explanation for this phenomenon is that there was a sudden demand outbreak for energy in Japan, caused by a significant decrease in the supply capabilities from the two most affected companies. This gap was immediately filled in the short term by the other Japanese energy companies.
Whether or not it might be possible to seize future opportunities to earn money in stock markets from similar situations involving a natural disaster that ends up causing serious problems within nuclear energy companies facilities and power plants, remains a dubious question. The time window to take actions might not be very large and as seen in the timeline presented in the beginning of this study, there is always a series of events from political, social and economical nature that can hugely affect the way things unfold over the following days to the disaster and that actually dictate how the markets react.
40
References
Alves, P., Pope, P., & Young, S. (2009). Cross-border information transfers: evidence from profit warnings issued by European firms. Accounting and Business Research, 39(5), 449-472.
Alves, P., Pope, P., & Young, S. (2010). Cross-border information transfers and the impact of accounting regime changes. London, U.K.: ICAEW Centre for Business Performance, ISBN 978-1-84152-817-5, pp. 30.
Aon Benfied (2011). Tohoku Earthquake & Tsunami Event Recap Report. Available in
http://thoughtleadership.aonbenfield.com/Documents/201108_ab_if_japan_eq_t sunami_event_recap.pdf (2013.03.22; 15h07m)
Bowen, R., Castanias, R. and Daley, L. (1983). Intra-industry effects of the accident at Three Mile Island. Journal of Financial and Quantitative Analysis, 18(1): 87-111.
Firth, M. (1976). The impact of earnings announcements on the share price behavior of similar type firms. Economic Journal, 86(342): 296-306.
Firth, M. (1996). The transmission of corporate financial information across national borders and equity market linkages. Review of Accounting Studies, 1(4): 309-337. Han, J. and Wild, J. (1990). Unexpected earnings and intra-industry information transfers: further evidence. Journal of Accounting Research, 28(1): 211-219.
Schipper, K. (1990). Commentary: information transfers. Accounting Horizons, 4(4): 97-107.
The Complete Japan Crisis Timeline (2011). Available in
http://gizmodo.com/5780998/the-definitive-japan-crisis-timeline (2013.03.22; 21h 32m)
Thomas, J. and Zhang, F. (2006). Overreaction to intra-industry information transfers?. Working paper, Yale University.