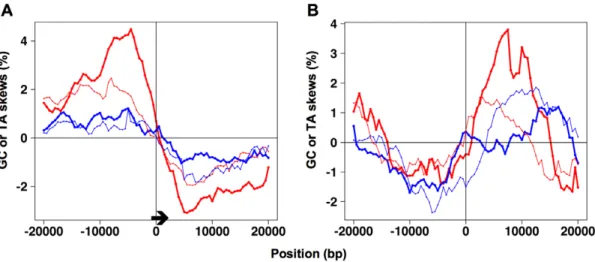
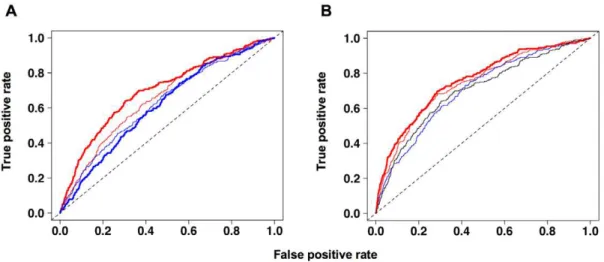
Asymmetry indices for analysis and prediction of replication origins in eukaryotic genomes.
Texto
Imagem
Documentos relacionados
The probability of attending school four our group of interest in this region increased by 6.5 percentage points after the expansion of the Bolsa Família program in 2007 and
Peça de mão de alta rotação pneumática com sistema Push Button (botão para remoção de broca), podendo apresentar passagem dupla de ar e acoplamento para engate rápido
analysis of variance and Tukey’s honestly different significance test were used to evaluate the significance of differences in the parameters of age, whole blood viscosity,
Povsem svojo ciljno skupino imajo šolske knjižnice, ki hranijo predvsem veliko slovenskega mladinskega leposlovja in nekaj učbeniškega gradiva (tudi na video kasetah in
Neste trabalho o objetivo central foi a ampliação e adequação do procedimento e programa computacional baseado no programa comercial MSC.PATRAN, para a geração automática de modelos
Ousasse apontar algumas hipóteses para a solução desse problema público a partir do exposto dos autores usados como base para fundamentação teórica, da análise dos dados
Despercebido: não visto, não notado, não observado, ignorado.. Não me passou despercebido
As orientações curriculares, vêm permitir, que a orientação e estruturação do trabalho que o educador preconiza seja, facilitador do desenvolvimento de uma prática
