Artigo
*e-mail: [email protected]
CORRELATION OF ANTI-INFLAMMATORY ACTIVITY WITH PHENOLIC CONTENT IN THE LEAVES OF Syzygium cumini (L.) SKEELS (MYRTACEAE)
Lucilene Azevedo Lima
Departamento de Produtos Naturais, Instituto de Tecnologia em Fármacos, Fundação Oswaldo Cruz, Rua Sizenando Nabuco, 100, 21041-250 Rio de Janeiro – RJ. Departamento de Química Analítica, Instituto de Química, Universidade Federal do Rio de Janeiro, Cidade Universitária, Ilha do Fundão, 21949-900 Rio de Janeiro – RJ, Brasil
Antonio Carlos Siani
Departamento de Produtos Naturais, Instituto de Tecnologia em Fármacos, Fundação Oswaldo Cruz, Rua Sizenando Nabuco, 100, 21041-250 Rio de Janeiro – RJ, Brasil
Fabíola Almeida Brito, André Luís Franco Sampaio and Maria das Graças Müller Oliveira Henriques
Departamento de Farmacologia Aplicada, Instituto de Tecnologia em Fármacos, Fundação Oswaldo Cruz, Rua Sizenando Nabuco, 100, 21041-250 Rio de Janeiro – RJ, Brasil
Carlos Alberto da Silva Riehl*
Departamento de Química Analítica, Instituto de Química, Universidade Federal do Rio de Janeiro, Cidade Universitária, Ilha do Fundão, 21949-900 Rio de Janeiro – RJ, Brasil
Recebido em 2/5/06; aceito em 6/10/06; publicado na web em 28/5/07
Phenolic contents of extracts of Syzygium cumini leaves, collected monthly over a one-year period, were quantitatively determined by the modified Folin-Ciocalteau method. Extracts and tannin-free fractions were assayed by their potential to inhibit mouse paw edema induced by C48/80. HPLC showed high molecular weight phenolic species and flavonoids in the active extracts and fractions. The highest total phenolic content corresponded to the most potent degree of inhibition and the flavonoids were supposed to be the main species responsible for the activity, given that the flavonoid-enriched ethyl-acetate fraction maintained its effect down to a dose of 0.01 µg/kg in a dose-response manner.
Keywords: Syzygium cumini; seasonal variation; anti-inflammatory.
INTRODUCTION
Syzygium cumini (L.) Skeels (syn. Eugenia jambolana Lamark, Myrtaceae) is a tropical evergreen tree, originating from India and Sri Lanka, which usually reaches a height of 7 to 10 m. It grows spontaneously in warm localities and is widespread in Brazil, where it is popularly known as “jamelão”, “jambolão” or “azeitona” because of its olive-shaped fruit. Bark, leaves and fruits of S. cumini have been used in traditional medicine since ancient times1,2. Extracts of S. cumini are well known as hypoglycemic and anti-diabetic agents, although results of pre-clinical or clinical studies have been controversial3-8, and they are also described for their diuretic9, bactericidal10,11 and anti-inflammatory12-14, and for treatment of dysentery15. The leaves are rich in tannins3,16, flavonoids17,18, and essential oils11,19. Phenolic contents of leaves, bark and fruits are correlated with antioxidant activity20,21. Anti-inflammatory and anti-ulcerogenic activities have been described for the ethanolic extract of the stem bark22. These effects, however, have not been correlated with any particular chemical constituent or class of compounds, although some isolated compounds from S. cumini have been elsewhere described as anti-inflammatory agents23. The present study analyses the content of total phenols, tannins, simple phenols, and flavonoids in the leaves of S. cumini, collected monthly over a one-year period, by the Folin-Ciocalteau method. The values are correlated with the anti-inflammatory activity of the extracts, in the mouse paw edema model induced by C48/80.
RESULTS AND DISCUSSION
The results of absorbance values for different tannic acid concentrations are summarized in Table 1. The linear correlation in the concentration range assayed for the determination of tannic acid (95% confidence interval p < 0.05, Table 2) allowed quantifying properly TP, SP and TT compounds (Figure 1). The choice of Folin-Ciocalteau’s reagent (which contains sodium molybdate and sodium tungstate solutions) for the quantification of phenolic compounds was based on the fact that it is more sensitive and more precise than other methods described16,24, especially in view of the fact that, in plants, these constituents are usually found as heteroside derivatives, soluble in water and other polar solvents. Thus, a wide range of phenolic compounds is quantified with basis on their ability to react with oxidizing agents to produce compounds that absorb at specific wavelength. After measurement of total phenolic
Table 1. Absorbance values at 725 nm for different tannic acid concentrations (Folin-Ciocalteau method)
TA (mg) Absorbance (AU) M V
0.0096 0.182 0.179 0.181 0.181 0.004
0.0192 0.307 0.303 0.305 0.305 0.005
0.0288 0.460 0.460 0.461 0.460 0.001
0.0384 0.533 0.538 0.537 0.536 0.007
0.0480 0.735 0.737 0.739 0.737 0.005
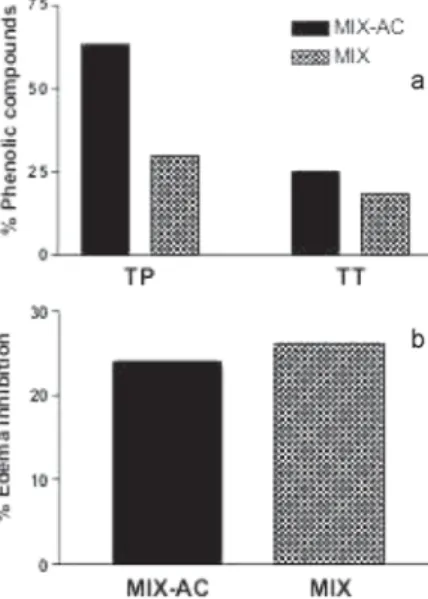
compounds at this wavelength, the ability of condensed polymeric tannins to bind to water-insoluble PVPP allows their removal and the quantification of the simple phenolics alone. The average observed values for the TP, simple phenolic SP and TT contents in theS. cumini aqueous extracts, calculated by the Folin-Ciocalteau method, are shown in Figure 2. The maximum content of phenolic compounds and tannins occurred from November to January. A progressive increase in TP from September to December-January can be clearly noticed. From February-March onwards there was a tendency for the TP to decrease progressively on average until July-August. At a less extent, the same trend in the variation of TP is also accompanied by the average of total condensed tannin (TT), but this is evidently inverted in the case of simple phenols (SP), given that their contents in the leaves complement to afford TP values. The relative variation ranges for TT and SP are narrower than those observed for TP; the largest differences again occurring just before the rainy season (from October to January) (Figure 2). As expected, the MIX extract, obtained from mixing the extracts from November, December and January collections (from a single specimen), showed average TP values of 29.8% and TT values of
18.3%. After partition with ethyl acetate, these average values rose to 63.0% and 25.1%, for TP and TT, respectively (Figure 3).
The crude aqueous extract yields were around 7.4% (w/w); the highest values being obtained for the collections from December to February. The peak distribution through the HPLC fingerprinting profile was consistent with the presence of hydrolysable tannins and flavonoids, and was highly similar for all the extracts. Basically, the peaks were grouped in three regions based on typical generic patterns of UV absorption, supporting the presence of ellagitannins (10 - 12 min) gallotannins (12 - 25 min) and flavonoids (25 - 37 min)25. The maximum content of phenolic compounds and tannins occurred from November to January, an event coincident with the period of transition from spring to summertime (beginning of the rainy season) in the southern hemisphere. As expected, the highest anti-inflammatory activity was coincident with increased levels of phenolic compounds. As in the case of the total phenolic compounds, a direct correlation was observed between the inhibitory activity and the content of total tannin. The average TT contents were also higher in the period between November and February; which also meant that the highest degree of inhibition corresponded to the lowest level of simple phenolic content. This fact reinforces the hypothesis of chemically defined compounds as responsible for the anti-inflammatory activity, which is further confirmed by the increasing inhibition observed by the ethyl acetate partitioning of the aqueous extract.
Analysis of the anti-inflammatory activity of Syzygium cumini aqueous crude extract was evaluated in a period of over one year in the C48/80 paw edema model, using a standard anti-inflammatory drug, sodium diclofenac, as the positive control. In the first month of
Table 2. Parameters from the analytical curve of tannic acid using ANOVA
Source of Variance SDQ Df Variance Test F P Fhypothetical
Between Groups 0.549 4 0.137 38896.349 6.578E-21 3.478
Within Groups 3.533E-05 10 3.533E-06
Total 0.549 14
SDQ = sum of squares, Df = degrees of freedom, P = percentage of contribution. Variance “between groups” are defined by the triplicate values obtained for the same concentration; and “within groups” by all the values obtained for all the concentrations.
Figure 1. Analytical curve of tannic acid at 725 nm (Folin-Ciocalteau method) for different weighs (calculated from the stock solutions concentrations). Absorbance in AU (absorbance unity)
Figure 2. Content of total phenolic (TP), tannins (TT) and simple phenolic (SP) compounds in Syzygium cumini aqueous leaf extract according to the period of collection plotted against the inhibition of C48/80-induced edema. Treatment (50 mg/kg) made 1 h before stimulation with C48/80 compound (100 ng/paw)
Figure 3. (a) Content in total phenolic compounds (TP) and tannins (TT) in
Syzygium cumini MIX extract and MIX-AC fraction as determined by the Folin-Ciocalteau method and (b) inhibition of C48/80-induced (100 ng/paw)
analysis (September) treatment with S. cumini aqueous crude extract led to a 38.7% average inhibition of the paw edema. In the subsequent months, the anti-inflammatory activity of the extract increased to a maximum of 56.5% average inhibition in November and 45.1% in December. The inhibitory activity of the crude extracts decreased in February, maintaining a steady level (30 – 40%) until May, and falling again in July (19.0%) and August (27.0%) (Figure 2). An odd inhibition peak was produced by the March extract, but the value (49.3%) was averaged from only two measurements in this case. The SP content was also relatively higher (37.9%) in the MIX-AC when compared to the aqueous MIX extract (11.4%). HPLC experiments showed clearly that the fraction MIX-AC is not only specially enriched in SP, but in flavonoid compounds specifically (8-10 and 26-28% of flavonoids in MIX and MIX-AC respectively; from the relative area peaks in the chromatograms obtained under identical conditions - data not shown). At the highest dose used in the experiments (50 mg/kg), the MIX extract and the enriched fraction MIX-AC exhibited the same pattern of edema inhibition despite the differences in phenolic content (Figure 3a and 3b). However, as illustrated in the dose-response experiments (Figure 4a) the treatment with MIX in higher doses (100, 10, 1 and 0.1 mg/kg) inhibited the paw edema formation triggered by C48/80, (43, 40, 32, 30% of inhibition, respectively) at similar extents to treatment with an non steroidal anti-inflammatory drug sodium diclofenac (40% of inhibition). This anti-inflammatory is widely used to relieve symptoms of inflammatory processes, due to its ability to inhibit prostaglandins and thromboxanes formed from arachidonic acid by cyclooxigenases (COXs) including the inducible isoform, COX 2 that is produced by mast cells and involved in allergic response. Reinforcing the inhibitory effect presented by MIX, the pre-treatment with MIX -AC (Figure 4b), in all doses used, was able to reduce about 35% of paw edema of inhibition, comparable to sodium diclofenac-treatment (32%). Interestingly the inhibitory effect of MIX-AC was maintained down to a 104 times lower dose (0.01 µg/ kg) than that necessary for the MIX extract. The literature reports a dose-related (100 to 1000 mg/kg) inhibitory effect (13.3 to 44.4%) for the ethanolic extract of S. cumini bark on the paw edema triggered by carrageenin, kaolin-carrageenin (up to a 24-h observation period), or formaldehyde (up to 48-h observation period); as well as in the cotton pellet granuloma test14. That is about twice the necessary dose reported in this study for the 66.2% inhibition by the leaf crude extract of the C48/80-induced edema. Oral administration of ethanolic extract of S. cumini bark also presented anti-inflammatory activity in histamine, 5-hydroxytriptamine and prostaglandin E2-induced rat paw edema15. In contrast with the bark, S. cumini leaf extract is reported to contain flavonoids17,18. The anti-inflammatory activity has been correlated with the presence of similar flavonoids in the methanolic leaf extract of the closely related species Eugenia jambos23,26. This correlation is corroborated by the inhibitory effect observed with flavonoid-rich MIX-AC, which maintained activity over the dose range from 0.01 to 100 µg/kg. This property was not observed with the MIX extract, although both extracts and a fraction exhibited very similar results at the dose of 50 mg/kg. The most potent activity shown by the ethyl acetate fraction MIX-AC reinforces the presence of a defined chemical group (flavonoids; more soluble in the ethyl acetate fraction) as responsible for the anti-inflammatory activity observed with leaf extracts of S. cumini. Some isolated flavonoids and catechins are already described as possessing anti-inflammatory27, anti-allergic28,29 and analgesic30 activities. On the other hand, the oral administration of crude extracts of S. cumini containing quantified tannins has been associated to gastroprotective and anti-ulcerogenic effects in rats22. However, few known flavonoids had been previously isolated from S. cumini leaves17,18 or flowers31.
EXPERIMENTAL
Drugs and chemicals
Induction agent C48/80, sodium diclofenac, polyvinylpyrrolidone (PVP), diphenylboryloxyethylamine and polyethyleneglicol (NP/PEG reagent) were purchased from Sigma (St. Louis, USA). Folin-Ciocalteau reagent and tannic acid were purchased from Sigma-Aldrich (Milwaukee, USA).
Plant material and extracts
Fresh leaves of Syzygium cumini were collected in the campus of the Oswaldo Cruz Foundation, Rio de Janeiro, Brazil, from three specimens, in the period from September 2002 to August 2003. The plant material was identified by Dr. G. M. Barrozo and a voucher specimen was deposited in the Herbarium of the Botanic Garden of Rio de Janeiro under No. 380789. Leaves were extracted with boiling water during 20 min at a 6% (w/v) ratio. After cooling, the solution was filtered, lyophilized (Christ Beta 1-15, Germany) and the extract was kept in a dry atmosphere. The crude extracts of the November, December and January collections (from a single specimen) were combined (MIX) and then partitioned with ethyl acetate to afford the MIX-AC fraction (15%). Before combining the extracts, their chemical similarities were qualitatively checked by HPLC.
Analytical High Performance Liquid Chromatography (HPLC)
J6-MI, CA, USA). The soluble part was applied to silica gel chromatoplates GF254 (5cm), run in BAW (n-butanol: acetic acid: water 4:1:5) and tested for the presence of flavonoids with NP/PEG reagent. HPLC data were collected and processed on a Shimadzu model CLASS-VP 6.12 (Kyoto, Japan) equipped with a diode-array detector (DAD) and a SP3 chromatographic software. The mobile phase gradient elution was programmed for solvent A (acetonitrile: water 5:95, v/v) and solvent B (acetonitrile:water 90:10, v/v). The mobile phase was adjusted to pH 4.0 with phosphoric acid. The reverse phase column (Supelcosil LC-18; 25 cm x 4.6 mm x 5 µm) was previously equilibrated with the mobile-phase for 30 min at a flow rate of 0.75 mL/min. The flow rate was maintained at 0.75 mL/min and the injection volume 20 µL. The column temperature was maintained at 25 oC during analysis. The gradient program started with 0% of solvent B and then increased linearly to 100% of solvent B in 30 min. Injections were performed in triplicate. After 44 min, the elution program was returned to the initial condition and then held for 10 min in order to recondition the column.
Analytical curve
Tannic acid was used as an analytical standard for total phenol quantification. Working solutions were prepared from the stock standard solutions (1.0 mg/mL) to contain 0.00; 0.0096; 0.0192; 0.0288; 0.0384 and 0.0480 mg/mL of tannic acid in acetone:water 7:3. Tannic acid was quantified by the Folin-Ciocalteau method, and the samples (triplicates) were analyzed in a spectrophotometer (Molecular Devices SpectraMAX190, CA, USA) at 725 nm (Fi-gure 1). Tannic acid solutions were also quantified by HPLC (UV detection)32and the results were very similar to those obtained by the Folin-Ciocalteau procedure (data not shown).
Determination of total phenolic (TP) compounds
Extract samples with weights ranging from 0.1 to 20 mg were diluted in 10.0 mL of acetone:water 7:3, cooled in an ice bath and sonicated during 20 min in a 15 mL centrifuge tube. Samples were then centrifuged for 10 min (3000 rpm at 4 oC). The soluble part was decanted, kept under refrigeration at 7 oC, and eventually diluted to fall within the optimum concentration range, represented by the analytical curve. Fifty microliters of the soluble part of each sample and 450 µL of distilled water were stirred in a test tube in triplicate. The mixtures were quantified by the Folin-Ciocalteau method and analyzed in a spectrophotometer at 725 nm. Total phenolic content (TP) was calculated based on the tannic acid analytical curve, and expressed as a percentage of the dry material weight. Averages for TP, TT (total tannins) and SP (simple phenolics) values were considered, regarding the three specimens monthly collected.
Determination of simple phenolic (SP) and total tannins (TT) content
In a test tube, 100 mg of polymer polyvinylpolypyrrolidone (PVPP), 1 mL of distilled water and 1 mL of the crude extract were stirred, cooled at 0–5 oC for 15 min, stirred once more and centrifuged for 10 min (3000 rpm at 4 oC). The suspension was decanted and the soluble part, containing only the SP compounds (tannins were adsorbed to the polymer), was analyzed. A hundred microliters of the soluble part, containing only the SP compounds of each sample and 400 µL of distilled water were stirred in a test tube in triplicate. The mixture was quantified by the Folin-Ciocalteau method and analyzed in a spectrophotometer at 725 nm. Total SP content was calculated with reference to the tannic acid
analytical curve, and expressed on the basis of the dry material. The difference between the TP and SP afforded the total high-molecular TT in the sample.
Induction of paw edema and treatment
Male Swiss mice (18–25 g; groups of 7 animals), from the Oswaldo Cruz Foundation colony were housed in a room with controlled temperature (23 + 2 °C) and lighting (lights on from 7:00 to 19:00 h), with free access to lab chow and tap water. All the experiments were carried out in total accordance with the institutional Ethical Committee guidelines (Institutional license No. 0050/00). Mouse paw edema was induced as described by Henriques et al.33 and C48/80 used as edematogenic agent according to Stochla34. Briefly, animals received a sub plantar injection of C48/80 (100 ng/ paw), the other paw received the same volume of sterile saline (50
µL). Edema was evaluated 30 min after C48/80 stimulation (100 ng/ paw) in a digital plethismometer (Ugo Basile, Italy). The edema was estimated as the difference of volumes (µL) between the stimulated and the saline-injected paw. S. cumini leaf aqueous crude extract (0.01–100 mg/kg), fraction (0.01–100 µg/kg) or the reference drug sodium diclofenac (100 mg/kg) were administered orally (200 µL) 1 h before sub-plantar stimulation with C48/80 in animals submitted to previous fast for 12 h. Animals received lab chow only 1h after the different treatments. Data were expressed as the mean ± S.E. Averages and standard deviations were calculated and the data were submitted to statistical analysis by ANOVA (analysis of variance), followed by Student’s t-test35 or Newman Keuls test, using the confidence intervals of 95% (p < 0.05).
CONCLUSIONS
Besides confirming the direct correlation between the total phenolic and flavonoid compounds in the leaf extract of S. cumini and the anti-edematogenic activity, the current study also established the best period to gather the raw material, for maximum therapeutic properties in a potential anti-inflammatory phytomedicine. The adequacy of the Folin-Ciocalteau method for the quantification of phenolic compounds is moreover demonstrated for a first chemical control of phytopharmaceuticals derived from Syzygium cumini. The maximum concentration of phenolic compounds in the leaves occurred from the end of spring to the beginning of the summer in South America (November to January), a period when the leaves reach maturity. Factors related to leaf ageing may support our findings and suggest that the decrease in leaf phenolic content in S. cumini is related to a series of genetic events that correlate to a complex aging system which regulates the nature and abundance of the metabolites. These would include internal and external stimuli such as luminosity rate, pluviometric indices, pathogenic stimuli, hormones and others36,37.
ACKNOWLEDGEMENTS
Authors would like to thank biologist S. S. Monteiro for the S. cumini collection and exsiccate preparation. This study was partially supported by grants from CNPq, Brazil.
REFERENCES
1. Corrêa P.; Dicionário das Plantas Úteis do Brasil e das Exóticas Cultivadas, 2a ed., Ed. Imprensa Nacional, Ministério da Agricultura: Rio de Janeiro; 1984, vol. 4, p. 429.
4. Teixeira, C. C.; Rava, C. A.; da Silva, P. M.; Melchior, R.; Argenta, R.; Anselmi, F.; Almeida, C. R.; Fuchs, F. D.; J. Ethnopharmacol.2000,71, 343. 5. Vikrant, V.; Grover, J. K.; Tandon, N.; Rathi, S. S.; Gupta, N.; J.
Ethnopharmacol.2001,76, 139.
6. Sharma, S. B.; Nasir, A.; Prabhu, K. M.; Murthy, P. S.; Dev, G.; J. Ethnopharmacol.2003,85, 201.
7. Grover, J. K.; Vats, V.; Rathi, S. S.; Dawar, R.; J. Ethnopharmacol.2001,
76, 233.
8. Sridhar, S. B.; Sheetal, U. D.; Shastri, M. S.; Braz. J. Med. Biol. Res. 2005,
38, 463.
9. Silva-Netto, R. C.; Lopes, R. A.; Pozetti, G. L.; Rev. Fac. Odont. Ribeirão Preto,1986,23, 213.
10. Damasceno, D. C.; Lima, P. H. O.; Galhiane, M. S.; Volpato, G. T.; Rudge, M. V.; Rev. Bras. Plantas Medicinais2002,4, 46.
11. Shafi, P. M.; Rosamma, M. K.; Jamil, K.; Reddy, P. S.; Fitoterapia2002,
73, 414.
12. Chaudhuri, A. K. N.; Pal, S.; Gomes, A.; Battacharya, S.; Phytotherapy Res.1990,4, 5.
13. Muruganandan, S.; Srinivasan, K.; Chandra, S.; Tandan, S. K.; Lal, J.; Raviprakash, V.; Fitoterapia2001,72, 369.
14. Muruganandan, S.; Pant, S.; Srinivasan, K.; Chandra, S.; Tandan, S. K.; Lal, J.; Prakash, R. V.; Indian J. Physiol. Pharmacol.2002,46, 482. 15. Glyphis, J. P.; Puttick, G. M.; Phytochemistry1998,27, 743.
16. Mukherjee, P. K.; Saha, K.; Murugesan, T.; Mandal, S. C.; Pal, M.; Saha, B. P.; J. Ethnopharmacol.1998,60, 85.
17. Mahmoud, I. I.; Marzouk, M. S.; Moharram, F. A.; El-Gindi, M. R.; Hassan, A. M.; Phytochemistry2001,58, 1239.
18. Timbola, A. K.; Szpoganicz, B.; Branco, A.; Monache, F. D.; Pizzolatti, M. G.; Fitoterapia2002,73,174.
19. Khanna, R. K.; Indian Perf.1991, 112.
20. Banerjee, A.; Dasgupta, N.; De, B.; Food Chem.2005,90, 727. 21. Bajpai, M.; Pande, A.; Tewari, S. K.; Prakash, D.; Int. J. Food Sci. Nutr.
2005,56, 287.
22. Ramirez, R. O.; Roa Jr., C. C.; Clin. Hemorheol. Microcirc.2003,29, 253. 23. Slowing, K.; Carretero, E.; Villar, A.; Phytotherapy Res.1996,10, S-126. 24. Julkunen-Tiito, R.; J. Agric. Food Chem.1985,33, 213.
25. Scott, A. I. Em International Series of Monographs on Organic Chemistry; Barton, D. H. R.; Doering, W., eds.; Pergamon Press: Oxford, 1964, vol. 7. 26. Slowing, K.; Sollhuber, M.; Carretero, E.; Villar, A.; Phytochemistry1994,
37, 255.
27. Ueda, H.; Yamazaki, C.; Yamazaki, M.; Biol. Pharm. Bull.2002,25, 1197. 28. Cheong, H.; Ryu, S. Y.; Oak, M. H.; Cheon, S. H.; Yoo, G. S.; Kim, K.
M.;Arch. Pharmacal. Res.1998,21, 478.
29. Sano, M.; Suzuki, M.; Myiase, T.; Yoshino, K.; Maeda-Yamamoto, M.; J. Agric. Food Chem.1999,471, 906.
30. Chou, T. C.; Chang, L. P.; Li, C. Y.; Wong, C. S.; Yang, S. P.; Anesth. Analg. 2003,97, 1724.
31. Subramanian, S. S.; Nair, A. G. R.; Curr. Science1972, 703. 32. Escarpa, A.; Gonzalez; M. C.; J. Chromatogr., A2000,897, 161. 33. Henriques, M. G. M. O.; Silva, P. M. R.; Martins, M. A.; Flores, C. A.;
Cunha, F. Q.; Assurey-Filho, J.; Cordeiro, R. S. B.; Braz. J. Med. Biol. Res.1987,20, 243.
34. Stochla, K.; Acta Phys. Pol.1980,31, 535.
35. Millar, J. N.; Millar, J. C.; Statistics and Chemometrics for Analytical Chemistry, 4th ed., Pearson Education: Paris, 2000.