Article
J. Braz. Chem. Soc., Vol. 26, No. 11, 2214-2223, 2015. Printed in Brazil - ©2015 Sociedade Brasileira de Química 0103 - 5053 $6.00+0.00
A
*e-mail: [email protected]
Facile Method to Tune the Particle Size and Thermal Stability of Magnetite
Nanoparticles
Loushambam H. Singh,a Sudhanshu S. Pati,a Maria J. A. Sales,b Edi M. Guimarães,c
Aderbal C. Oliveiraa and Vijayendra K. Garg*,a
aInstituto de Física, Universidade de Brasília, CP 04455, 70919-970 Brasília-DF, Brazil
bInstituto de Química, Universidade de Brasília, CP 04478, 70904-970 Brasília-DF, Brazil
cInstituto de Geociências, Universidade de Brasília, CP 04465, 70910-900 Brasília-DF, Brazil
Nucleation and growth mechanism of iron oxide nanoparticles on zeolite template and their stability dependence are reported. Hyperfine field resulting from the variation of particle size indicates the effect of zeolite on particles growth; particle size decreases at lower concentration of zeolite. At higher concentration, a fraction of nano Fe3O4 experiences hyperfine field (45 and 49 T) similar to bulk particles. Effect of incubation and digestion time on the particles growth and the binding effect with zeolite are discussed. Annealing treatments show that the binding of nanoparticles with zeolite stabilizes the nanoparticles with regard to agglomeration and structural transformation. Thermogravimetry-differential thermal analysis (TG-DTA) shows that increase in dehydration temperature from 335.1 to 351.7 K results in zeolite content increasing from 0 to 1000 mg. Weight loss of the particles prepared in incubation time of 0.5 min is 9.46% and reaches 13.9% in 240 min. The weight loss remains practically constant at ca. 9% irrespective of the digestion method.
Keywords: magnetite, zeolite, confined growth, thermal stability
Introduction
Magnetic iron oxide (Fe3O4 and γ-Fe2O3) nanoparticles
have significant importance in magnetic and catalytic industries. It is reported to have been used in miniaturization of devices, drug delivery, hyperthermia, heavy ion separations and batteries, etc.1-4 Various methods such
as co-precipitation, sol gel and solvothermal, etc., have been adopted to synthesize magnetic nanoparticles.5-7
Large particle size distribution and low magnetism of nanoparticles are of concern for applications. In parallel to the functionality of the iron oxide nanoparticles, stability is an important issue. Agglomeration hinders the functionality of the nanoparticles.8 Thermal treatment of
the nanoparticles results in the magnetic and structural transformation. This restricts their application at elevated temperature ambience. To improve the desired properties, nanoparticles were synthesized on a template, which possesses uniform and monodisperse fine pores.9 Various
templates exist for synthesis of nanoparticles. In the present
study, zeolite 13x has been used as it has uniform pores with specific charge affinity sites, which act as nucleating centers of the nanoparticles.10 Tetrahedral groups of SiO
4
and AlO4 are the basic units with Si and Al at the center
of the tetrahedron. Each AlO4 tetrahedral group has an
uncompensated charge and therefore a positive ion such as Na+, Ca2+, etc., occupies site near AlO
4 in the course of
formation. The stoichiometric formula for zeolite 13x10 is
Na86[(AlO2)86(SiO2)106].264H2O. It consists of two major
cages known as β-cages and α-cages. These cages act as the host for the external agents like H2O, transition ions
and nanoparticles.
Zeolite, being a nontoxic material, is often used as carrier of drugs, e.g., doxorubicin.11 It has been a
promising candidate for bioengineering and catalysis technology.12-14 Zeolites doped with magnetic elements/
compounds have also been an important species for various technological applications.15-17 Therefore, the iron oxide/
vaporization and physical methods.18-21 The metals or oxides
grown in zeolite using wet chemical methods occupy the pores.22 Zeolite can uptake up to 2 wt.% of the transition
metal inside the network without significant modification of the structure.22 Numerous studies have been reported
on zeolite incorporated with Fe atoms, but studies on the growth of iron oxide on zeolite and the functionality of the composites could not be found. The thermal stability of the iron oxide on the phase transformation has been of scientific interest.23-25 Stability has been improved by doping
of transition metals and capping with organic and ceramic materials.26 Capping prevents the surface interaction with
targets leading to reduction in the catalytic properties. Bare and stable nanoparticles with tuned particle size are necessary for wide range of applications.
In the present study, composites of iron oxides and zeolites have been synthesized using wet chemical method. The structural, thermal and magnetic properties have been studied by Mössbauer spectroscopy, X-ray diffraction, thermo gravimetry-calorimetry, and transmission electron microscopy.
Experimental
Material synthesis
The synthesis of nanocomposites of magnetic iron oxide and zeolite 13x were carried out through a modified wet chemical method. An aliquot of 20 mL of FeSO4.7H2O
(0.2 mol L-1) and 20 mL of FeCl
3.6H2O (0.4 mol L-1)
were mixed under vigorous stirring at 90 oC followed by
addition of NaOH (2 mol L-1) solution for precipitation
of Fe3O4 nanoparticles. The pH of the solution was
maintained higher than 10 with rapid addition of NaOH so as to decrease the possibility of hydroxide formation.27
The precipitated magnetic iron oxide nanoparticles were separated using a permanent magnet and washed several times with water and acetone for removal of inorganic and organic impurities, respectively. The composites were prepared in three different ways by varying (i) the concentration of zeolite 13x, (ii) the incubation time of zeolite in the precursor solution before precipitation of iron oxide and (iii) controlling the effective digestion time of nucleated iron oxide by tuning the addition time of zeolite after precipitation. Each of these methods is described in detail below.
(i) Variation of zeolite 13x concentration
In order to observe the effectiveness of zeolite concentration on the size and magnetic properties of iron oxide nanoparticles, different concentrations of dehydrated
zeolite 13x (annealed at 523 K for 2 h) were mixed in the precursor solution at 320 rpm for 15 min. These samples are denoted as MxZ (where x represents the amount of zeolite 13x added in mg).
(ii) Variation of incubation time
Incubation time is one of the key parameters to control the particle size and morphology. The incubation time of zeolite in precursor solution was varied as 0.5, 60 and 240 min before addition of NaOH to precipitate Fe3O4
nanoparticles. The concentration of zeolite 13x was maintained at 150 mg of zeolite and the digestion time after precipitation was maintained at 30 min. The samples prepared in this process were denoted as Ix (x: time in min).
(iii) Variation of digestion time
Controlling the growth of nanoparticles by addition of capping agent is a standard process.28 Zeolite, being
a cationic affinity material, has a tendency to restrict the growth of freshly nucleated Fe3O4 nanoparticles. In this
process, the zeolite 13x was added to the precipitated solution after 0.5, 5 and 30 min of NaOH addition. The concentration of zeolite was fixed at 150 mg. The samples prepared in this process are denoted as Dx (x: time in min).
Characterization techniques
X-Ray diffraction (XRD) was performed using RIGAKU Ultima IV diffractometer with Cu-Kα as radiation source and Ni-filtered with cross beam optics (CBO) monochromator; operating voltage 45 kV at 15 mA. The measurements were performed in steps of 0.05 and the scan rate of 2o min-1. Transmission
electron microscopy (TEM) images were obtained using a microscope (JEOL, model 1011) to determine the morphology, the mean particle size and the size distribution. The Mössbauer spectra were recorded with a constant acceleration transducer coupled to 57Co in Rh
matrix source with an initial activity of 25 mCi in the standard transmission geometry. The velocity calibration per channel was done with a 1.9 mg per 57Fe cm2 iron foil.
Thermogravimetry (TG)/derivative thermogravimetry (DTG) and differential thermal analysis (DTA) experiments were performed in a thermo-balance Shimadzu DTG-60H. TG/DTG curves of samples were carried out under oxidant atmosphere (30 mL min-1) using a Pt pan. For all samples,
the mass used was approximately 7 mg, and a heating rate of 10 K min-1 was employed between 298-1073 K.
Results and Discussion
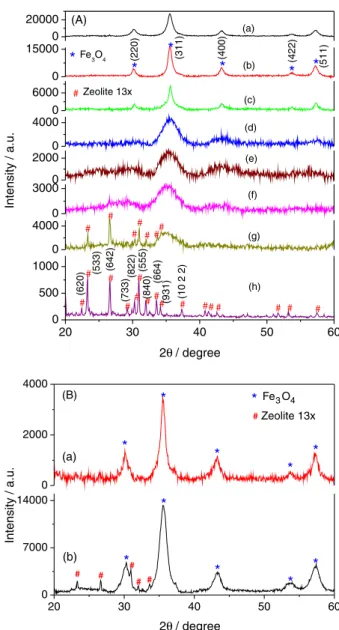
XRD patterns (Figure 1) confirm the nanoparticles to be cubic iron oxide (Fe3O4/γ-Fe2O3). The average
particles size of M0Z (pure Fe3O4) was calculated to
be 9 nm using Scherer formula. At lower concentration of zeolite 13x, a decrease in the Fe3O4 particle size
(M25Z: 6 nm, M50Z: 6.5 nm and M75Z: 6 nm) is observed which increases to 10.6 nm in the presence of 100 mg of zeolite. On further increasing the zeolite concentration to 180 (M180Z) and 200 mg (M200Z), the particle size decreases to 8.5 and 3 nm, respectively. Due to sharp decrease in particle size, the peaks corresponding to the diffraction pattern from crystal planes get broader with increase in zeolite concentration. The lattice parameter of the pure Fe3O4 is 0.836 nm in agreement with the reported
value of Fe3O4 (0.838 nm).25 Zeolite phase was observed
along with iron oxide only for sample M1000Z (1000 mg of zeolite). Low intensity diffraction peak from the (642) crystal plane of zeolite was observed in sample M500Z which sharply increases for sample M1000Z and dominates over the (533) peak which happens to be most intense peak of pure zeolite. It has been attributed to the incorporation of iron oxide nanoparticles which affects the crystal structure of zeolite. The XRD peaks of Fe3O4 after addition of zeolite
is due to superposition of small size nanoparticle nucleated in the pores and the bigger particles residing on the surface, resulting into broad basal and sharp peaks.
Figure 1B shows the XRD pattern of the samples nucleated after 0.5 min of incubation (I0.5) and samples synthesized with 30 min of digestion time (D30). The diffraction pattern confirms presence of pure spinel iron oxides. Sample I0.5 shows the presence of weak and broad features of zeolite whereas sample D30 shows presence of sharp crystalline peaks of zeolite. This can be attributed to the amorphization of zeolite due to nucleation of the nanoparticles from the uncompensated cationic affinity sites of the zeolite.29 However, the crystal structure of
zeolite remains unaffected when the nanoparticles were nucleated and adsorbed on the zeolite surface. The amorphization of the zeolite is attributed to the strain developed during nucleation of nanoparticles.
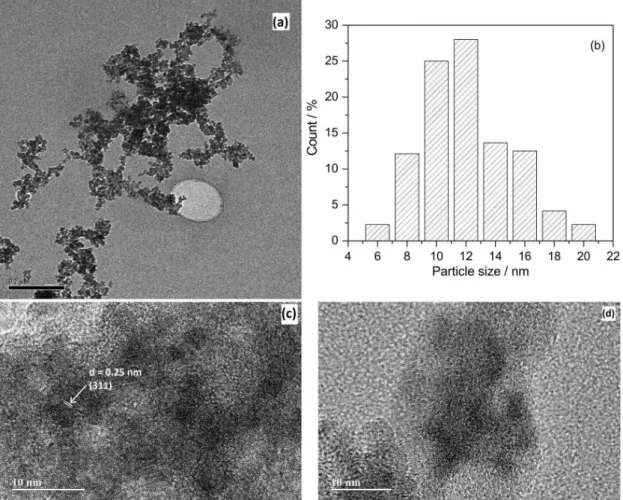
Figure 2a shows the TEM image of the sample M0Z confirming the near to spherical shape of the nanoparticles with high monodispersity. Particle size distributions obtained from the TEM image analysis of M0Z shows particles are 14% of 4-8 nm, 54% of 8-12 nm and 32% of 12-20 nm. Figures 2c and 2d represent the high resolution (HR) TEM of M250Z and M1000Z, respectively.
Regular atomic patterns with interplanar spacing 0.25 nm representing the (311) plane of Fe3O4 and diameter
of 3 to 7 nm were observed. These regular interplanar spacing were absent in M1000Z. This is due to the reduction of Fe3O4 particles on the surface of zeolite. The XRD pattern
observed in M1000Z is understood from the particles inside the pores.
Figure 3 shows the Mössbauer spectra of sample M0Z least square fitted to four sextets and a doublet, and Table 1 depicts the least square fitted Mössbauer parameters. The doublet represents the superparamagnetic particles (4 to 8 nm) which is 7% of the total area. The sextets (hyperfine field of 14.3 and 34.8 T) with area 61% can be assigned to the particles in the range of 8 to 12 nm. The remaining two
0 20000 (a) 0 15000 * * * * * * # # # (3 1 1 ) (4 0 0 ) (4 2 2 ) (5 1 1 ) (g) (f) (e) (d) (c) (b) (2 2 0 )
Fe3O4
0
6000 #Zeolite 13x
0 4000 0 2000 0 3000 0 4000 # ###
20 30 40 50 60
0 500 1000 # # # # # # # # # # # # # # # # (1 0 2 2 ) (9 3 1 ) (6 6 4 ) (8 4 0 ) (5 5 5 ) (8 2 2 ) (7 3 3 ) (6 4 2 ) (6 2 0
) (53
3 ) (h) (A) 0 2000 4000 (B) Zeolite 13x # * * * * * *
Fe3O4
(a)
20 30 40 50 60
0 7000 14000 (b) # # # # * * * * * I I n n t t e e n n s s i i t t y y / / a a . . u u . . 2 2 θ θ / degree / degree #
Figure 1. (A) X-ray diffractographs of (a) pure Fe3O4 (M0Z);
(b) 100 mg (M100Z); (c) 180 mg (M180Z); (d) 200 mg (M200Z); (e) 250 mg (M250Z); (f) 500 mg (M500Z); (g) 1000 mg (M1000Z) of zeolite 13x with Fe3O4 and (h) zeolite 13x. (B) XRD pattern of the
nanoparticles grown in the presence of 150 mg of dehydrated zeolite 13x with (a) incubation time of zeolite with solution of 0.5 min (I0.5); and (b) the 30 min digestion time of the iron oxide precipitate before adding zeolite (D30). 0 20000 (a) 0 15000 * * * * * * # # # (3 1 1 ) (4 0 0 ) (4 2 2 ) (5 1 1 ) (g) (f) (e) (d) (c) (b) (2 2 0 )
Fe3O4
0
6000 #Zeolite 13x
0 4000 0 2000 0 3000 0 4000 # ###
20 30 40 50 60
0 500 1000 # # # # # # # # # # # # # # # # (1 0 2 2 ) (9 3 1 ) (6 6 4 ) (8 4 0 ) (5 5 5 ) (8 2 2 ) (7 3 3 ) (6 4 2 ) (6 2 0
) (53
3 ) (h) (A) 0 2000 4000 (B) Zeolite 13x # * * * * * *
Fe3O4
(a)
20 30 40 50 60
sextet subspectra with internal magnetic fields of 45.6 and 41.1 T represent the Fe atoms of tetrahedral and octahedral sites of spinel Fe3O4 in the size range of 12 to 20 nm. The
percentages of area fraction of different particle size from Mössbauer analyses (Table 1) are in good agreement with TEM analysis.
It is reported that zeolite possesses selective adsorption due to its unique porous structure and presence of uncompensated charge (AlO4 units).30 Dissolution of
zeolite in the precursor solution results in adsorption of Fe2+/Fe3+ into the α and β cages with the excess
Fe2+/Fe3+ ions remaining freely in the solution. The growth
of the nanoparticles nucleated from the Fe2+/Fe3+ ions
adsorbed inside the pores were restricted to the size of cage (maximum pore size in zeolite 13x is 13 Å) which results in the superparamagnetic doublet in Mössbauer spectra. The Fe3O4 nanoparticles nucleated from the freely remaining
Fe2+/Fe3+ ions in solution undergo agglomeration which is
reflected from sextet components.
The superparamagnetic doublet increases with the increase of zeolite which is attributed to the higher adsorption of Fe2+/Fe3+ ions into the pores (α and β cages) of zeolite. The Mössbauer spectra of samples Figure 2. TEM image of (a) M0Z, (b) particles size distribution, (c) HRTEM of M250Z and (d) M1000Z.
0.99 1.00
(b) (a)
0.96 1.00
0.91 0.98
Velocity / (mm s )-1
(e) (d) (c)
Relativ
e transmission
0.95 1.00
0.90 0.96
0.9 1.0
(f)
-8 -4 0 4 8
0.9 1.0
(g)
Figure 3. Room temperature Mössbauer spectra of (a) pure Fe3O4 (M0Z);
composites of Fe3O4 and (b) 100 mg (M100Z); (c) 150 mg (M180Z);
(d) 200 mg (M200Z); (e) 250 mg (M250Z); (f) 500 mg (M500Z) and (g) 1000 mg (M1000Z) of zeolite 13x.
0.99 1.00
(b) (a)
0.96 1.00
0.91 0.98
Velocity / (mm s )-1
(e) (d) (c)
Relativ
e transmission
0.95 1.00
0.90 0.96
0.9 1.0
(f)
-8 -4 0 4 8
0.9 1.0
M180Z and M200Z show presence of 75 and 100% superparamagnetic nanoparticles, respectively (Table 1). Above this concentration of zeolite, the particle size was found to remain almost constant (2-3 nm) indicating saturation of adsorption.
Mössbauer parameters as a function of zeolite concentration (Figure 4) have been categorized into four different zones. In zone I the superparamagnetic component increases from 7 to 20% with introduction of 25 mg of zeolite and the net area of the tetrahedral and octahedral sites reduces to 8% along with decrease in the mean hyperfine field. These variations of the above parameters clearly indicate decrease in the net particle size distribution. In zone II the mean hyperfine field (<Bhf>) remains
constant. Reported neutron scattering31 on the different
particle size of Fe3O4 shows that the magnetic moment at
the octahedral site is more affected than tetrahedral site with decrease in particle size. Therefore, the octahedral components of M25Z, M50Z and M75Z samples were possibly overlapped with surface component spectrum due to smaller particle sizes as the octahedral component may not have been resolved. The hyperfine field of octahedral sites is assumed to be 0 T for illustration. However, the area of superparamagnetic doublet increases with zeolite
concentration. Zone III shows slight increase in the area of superparamagnetic, tetrahedral and octahedral components. The <Bhf> values remain constant but the
internal magnetic field of tetrahedral and octahedral sites increases monotonically. In Zone IV the superparamagnetic component increases with compensation to the decrease Table 1. Least square fitted Mössbauer parameters of samples M0Z, M100Z, M180Z, M200Z, M250Z, M500Z and M1000Z
Sample Particle size / nm IS (Fe) / (mm s-1) QS / (mm s-1) B
hf / T Area / % Phasea
M0Z 9.0 0.36(3) 1.30(0) – 07(1) FeSPM
0.27(3) 0.04(4) 14.3(3) 12(2) FeSurf
0.34(2) 0.05(3) 34.8(5) 49(4) FeSurf
0.36(1) 0.01(2) 41.1(3) 15(4) FeOct
0.34(1) 0.04(2) 45.6(2) 17(2) FeTet
M100Z 10.6 0.23(0) 0.77(1) – 13(0) FeSPM
0.28(1) 1.54(0) – 23(0) FeSPM
0.33(0) 0.09(0) 22.0(3) 19(0) FeSurf
0.41(3) 0.00(4) 37.2(5) 17(2) FeSurf
0.38(1) 0.04(2) 42.8(1) 14(2) FeOct
0.24(7) 0.00(1) 46.1(0) 14(1) FeTet
M180Z 8.7 0.33(0) 0.76(0) – 75(0) FeSPM
0.45(5) 0.03(0) 39.0(0) 08(1) FeSurf
0.40(2) 0.03(4) 45.3(3) 10(2) FeOct
0.34(1) 0.03(3) 47.9(1) 07(1) FeTet
M200Z 3.1 0.33(0) 0.72(0) – 100(0) FeSPM
M250Z 2.7 0.30(0) 072(0) – 100(0) FeSPM
M500Z 2.5 0.34(0) 0.77(0) – 100(0) FeSPM
M1000Z 2.7 0.35(0) 0.84(0) – 100(0) FeSPM
aFe
SPM: superparamagnetic Fe atoms of Fe3O4; FeSurf: disordered surface components of Fe3O4; FeOct: Fe atoms at octahedral sites of Fe3O4; FeTet: tetrahedral
Fe atoms; IS: isomer shift; QS: quadrupole splitting; Bhf: magnetic hyperfine field.
0 60 120
A(T
e
t+
O
c
t)
/
%
A(S
P
M
)
/
%
20
40 (b)
0 30
(a)
(c) (IV)
(III) (II)
<
Bh
f
>
/
T
(I)
42 49
Bh
fT
e
t
/
T
Zeolite content / mg
(d)
0 30 60 90 120 150 180
0 30
Bh
fOct
/
T
Figure 4. (a) Superparamagnetic area (A(SPM)); (b) area of tetrahedral and
octahedral (A(Tet+Oct)); (c) mean hyperfine field (<Bhf>) and (d) hyperfine
field of tetrahedral (BhfTet) and octahedral (BhfOct) of the sample mentioned
in the x axis. 0 60 120
A(T
e
t+
O
c
t)
/
%
A(S
P
M
)
/
%
20
40 (b)
0 30
(a)
(c) (IV)
(III) (II)
<
Bh
f
>
/
T
(I)
42 49
Bh
fT
e
t
/
T
Zeolite content / mg
(d)
0 30 60 90 120 150 180
0 30
Bh
fOct
/
in octahedral and tetrahedral component. But the internal magnetic field experienced by the tetrahedral and octahedral Fe is larger than the pure Fe3O4. Variation of all
these parameters can be attributed to the decrease of area which corresponds to the larger Fe3O4 particles.
It is reported that zeolite attracts the ions and charged surface nanoparticles with electrostatic field from specific cationic sites.32 In low concentration, i.e., 25-75 mg of
zeolite, only limited Fe ions are exchanged and small amounts of Fe3O4 are nucleated at the pores. In the
precipitated solution nearly 20% of the precipitated iron oxide nucleated in the pores of zeolite. This reduces the concentration of free Fe3O4 and hence the probability of
interaction reduces, which results in lower particle size from 9 to ca. 6 nm. The electrostatic field intensity emitted from the zeolite is lower than the threshold force to attract the free iron oxide nucleated in the solution.
This prevents the agglomeration of the free Fe3O4 on
the surface of the zeolite. At higher concentrations of zeolite (100-180 mg), intense electrostatic field attracts the free Fe3O4 nanoparticles dispersed in the solution.
These nanoparticles are attached to the surface of zeolite then agglomerates giving larger particles (low fraction) experiencing higher internal magnetic field than the pure Fe3O4 nanoparticles. On further increase in the zeolite
concentration to 200 mg, the amount of zeolite becomes sufficient to nucleate all the Fe ions to Fe3O4 at the pores
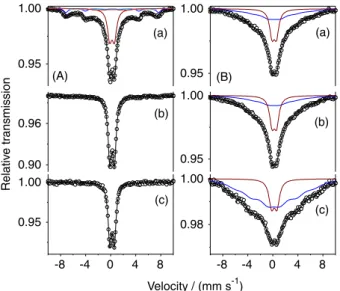
of the zeolite leading to sharp decrease in particle size to 3 nm. The Mössbauer spectra (Figure 5A) of the sample I0.5 consist of 51% superparamagnetic doublet contributed by the nanoparticles of less than 10 nm nucleated from the pores. The remaining 49% exhibiting sextets are from the particles of larger size nucleated on the surface.
Samples I60 and I240 show presence of 76 and 100% superparamagnetic particles, respectively. It is reported that Na+ ions present in zeolite can be exchanged by transition
metallic cations such as Mn2+, Cu2+, Co2+ and Zn2+, etc.33
As the incubation time increases, the Fe2+ or Fe3+ ions get
exchanged with Na+ ions residing even at the hexagonal
connection of the tetrahedral units of AlO4 and SiO4.
Zeolite 13x has uniform pores with maximum diameter of 1.3 nm, with a window size of 0.8 nm (α-cage).10 Other
pores that exist of 0.6 nm diameters with window size 0.22 nm are known as sodalite unit (β-cage). β-Cage is more difficult to access than α-cage and hence increasing the incubation time will provide sufficient time for the Fe2+
or Fe3+ ions to diffuse through the β-cage. Therefore, in the
low incubation time (30 s), the Fe2+/Fe3+ions exchange with
the Na+ ions is significantly less resulting in the formation of
nearly 51% of the superparamagnetic Fe3O4. The remaining
Fe3O4 nanoparticles agglomerate and are adsorbed on the
surface of zeolite. Increase in incubations leads to diffusion of more Fe2+/Fe3+ ions into the pores of the zeolite leading
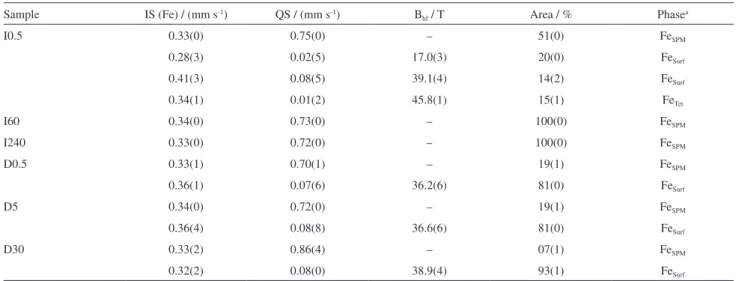
to higher fraction of superparamagnetic nanoparticles. Figure 5B shows Mössbauer spectra of the samples D0.5, D5 and D30. The fitted parameters are shown in Table 2. The particles nucleated and attached to zeolite after 0.5 (D0.5) and 5 (D5) min of digestion time show similar superparamagnetic area (19%) and hyperfine field (ca. 36 T). This indicates that the nanoparticles are of similar particle size. Further increasing the digestion time to 30 min (D30) leads to higher mean field (38.9 T) and lower superparamagnetic doublet (7%) which is coarsening of the nanoparticles.
Zeolite 13x has maximum pore size of 1.3 nm and the iron oxide nanoparticles precipitated before addition of zeolite are larger in size than the pores of the zeolite (α-cage). Therefore, the precipitated Fe3O4 nanoparticles
get adsorbed on the surface of the zeolite. Addition of zeolite slows down the Oswald ripening process leading to formation of larger particles. Saturation of Oswald ripening beyond the digestion time of 5 min in the chemical synthesis of Fe3O4 is reported.31 In the present case, it has been
observed that beyond 5 min Oswald ripening continues leading to further agglomeration.
High temperature thermal stability of Fe3O4
nanoparticles has been studied in recent years for high temperature applications. Pure Fe3O4 nanoparticles undergo
phase transition from γ-Fe2O3 to α-Fe2O3 around 773 K.26
To observe the effect of incubation time and digestion time, I0.5 and D0.5 samples were annealed at various temperatures for 2 h and the corresponding Mössbauer
0.95 1.00
0.95 1.00
(B) (A)
0.90 0.96
Relativ
e transmission
(c) (b) (a)
Velocity / (mm s )-1
0.95 1.00
-8 -4 0 4 8
0.95 1.00
(b)
(c) (a)
-8 -4 0 4 8
0.98 1.00
Figure 5. (A) Mössbauer spectra of Fe3O4 synthesized in the presence
of 150 mg of zeolite with incubation time of zeolite with Fe solution of (a) 0.5 min (I0.5); (b) 60 min (I60) and (c) 240 min (I240). (B) Mössbauer spectra of the Fe3O4 nucleated at surface of zeolite after (a) 0.5 min (D0.5);
(b) 5 min (D5) and (c) 30 min (D30) of reaction digestion time.
0.95 1.00
0.95 1.00
(B) (A)
0.90 0.96
Relativ
e transmission
(c) (b) (a)
Velocity / (mm s )-1 0.95 1.00
-8 -4 0 4 8
0.95 1.00
(b)
(c) (a)
-8 -4 0 4 8
spectra are shown in Figure 6. Mössbauer spectra of sample D0.5 annealed at 823 K shows conversion of only 3% of Fe3O4 to α-Fe2O3. This annealing temperature is 50 K higher
than the complete structural transformation temperature in pure Fe3O4 (773 K).26
In the sample I0.5, no structural transformation was observed till 873 K. The onset of structural phase transformation was observed at 923 K, where only 8% of
α-Fe2O3 was found (Table 3). The difference in the Fe3O4 to α-Fe2O3 transition temperature and the agglomeration of the
nanoparticles reflected in the area of the sextet signifies that the binding energy of Fe3O4 nanoparticles on the surface
is comparatively low.
Figure 7 shows the thermal stability of the nanoparticles. Evolution of two endothermic peaks at 343 and 418 K is due to two different binding energies of H2O as shown in
Figure 7A. As the Fe3O4 nanoparticles were loaded, the
second peak contributed from the dehydration of the pores disappeared as the Fe3O4 occupies the pores of zeolite.
Figure 7B shows the increase in the endothermic peaks as zeolite concentration increases. The endothermic peak or binding energy of surface H2O in pure Fe3O4 is less than the
zeolite. Therefore the increase in the peak position is due to the partial binding of H2O with zeolite surface which was
masked by Fe3O4 that segregates outside the pore. The free
surface of zeolite increases as the concentration of zeolite Table 2. Least square fitting Mössbauer parameters of the spectra of the samples I0.5, I60, I240, D0.5, D5 and D30
Sample IS (Fe) / (mm s-1) QS / (mm s-1) B
hf / T Area / % Phasea
I0.5 0.33(0) 0.75(0) – 51(0) FeSPM
0.28(3) 0.02(5) 17.0(3) 20(0) FeSurf
0.41(3) 0.08(5) 39.1(4) 14(2) FeSurf
0.34(1) 0.01(2) 45.8(1) 15(1) FeTet
I60 0.34(0) 0.73(0) – 100(0) FeSPM
I240 0.33(0) 0.72(0) – 100(0) FeSPM
D0.5 0.33(1) 0.70(1) – 19(1) FeSPM
0.36(1) 0.07(6) 36.2(6) 81(0) FeSurf
D5 0.34(0) 0.72(0) – 19(1) FeSPM
0.36(4) 0.08(8) 36.6(6) 81(0) FeSurf
D30 0.33(2) 0.86(4) – 07(1) FeSPM
0.32(2) 0.08(0) 38.9(4) 93(1) FeSurf
aFe
SPM: superparamagnetic Fe atoms of Fe3O4; FeSurf: disordered surface components of Fe3O4; FeTet: tetrahedral Fe atoms; FeOct: Fe atoms at octahedral
sites of Fe3O4; IS: isomer shift; QS: quadrupole splitting; Bhf: magnetic hyperfine field.
0.98 1.00
823 K (a)
0.96 0.99
(b)
873 K
-8 -4 0 4 8
0.95 1.00
873 K
Relativ
e transmission
Velocity / (mm s )-1
-8 -4 0 4 8
0.99 1.00
923 K
Figure 6. Mössbauer spectra of (a) D0.5 thermally treated at 823 and 873 K and (b) I0.5 thermally treated at 873 and 923 K.
0.98 1.00
823 K (a)
0.96 0.99
(b)
873 K
-8 -4 0 4 8
0.95 1.00
873 K
Relativ
e transmission
Velocity / (mm s )-1
-8 -4 0 4 8
0.99 1.00
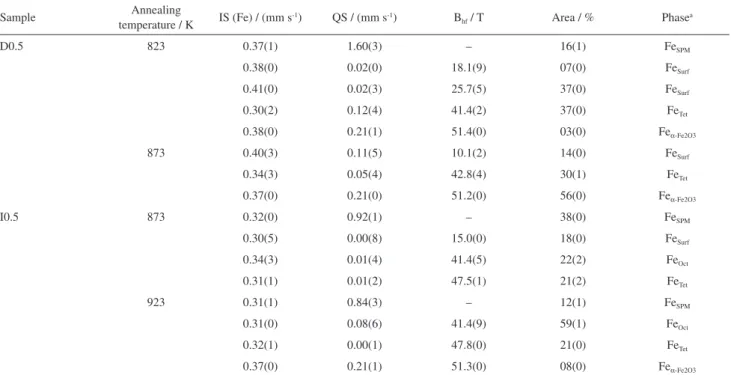
Table 3. Least square fitting Mossbauer parameters of annealed samples D0.5 and I.05
Sample temperature / KAnnealing IS (Fe) / (mm s-1) QS / (mm s-1) B
hf / T Area / % Phasea
D0.5 823 0.37(1) 1.60(3) – 16(1) FeSPM
0.38(0) 0.02(0) 18.1(9) 07(0) FeSurf
0.41(0) 0.02(3) 25.7(5) 37(0) FeSurf
0.30(2) 0.12(4) 41.4(2) 37(0) FeTet
0.38(0) 0.21(1) 51.4(0) 03(0) Feα-Fe2O3
873 0.40(3) 0.11(5) 10.1(2) 14(0) FeSurf
0.34(3) 0.05(4) 42.8(4) 30(1) FeTet
0.37(0) 0.21(0) 51.2(0) 56(0) Feα-Fe2O3
I0.5 873 0.32(0) 0.92(1) – 38(0) FeSPM
0.30(5) 0.00(8) 15.0(0) 18(0) FeSurf
0.34(3) 0.01(4) 41.4(5) 22(2) FeOct
0.31(1) 0.01(2) 47.5(1) 21(2) FeTet
923 0.31(1) 0.84(3) – 12(1) FeSPM
0.31(0) 0.08(6) 41.4(9) 59(1) FeOct
0.32(1) 0.00(1) 47.8(0) 21(0) FeTet
0.37(0) 0.21(1) 51.3(0) 08(0) Feα-Fe2O3
aFe
SPM: superparamagnetic Fe atoms of Fe3O4; FeSurf: disordered surface components of Fe3O4; FeTet: tetrahedral Fe atoms; Feα-Fe2O3: Fe atoms associated
with α-Fe2O3; FeOct: Fe atoms at octahedral sites of Fe3O4; IS: isomer shift; QS: quadrupole splitting; Bhf: magnetic hyperfine field.
300 400 500 600 700 800 900 1000
-18 -9 0
(b) (A)
Temperature / K
Heat
flo
w / mW (a)
(c) (d)
(e) (f)
(g)
(h)
-50 0 50 100 150 200 250
10 20
P
eak position / K
(B)
W
eight loss / %
Z13x Zeolite content / mg
330 340 350
Figure 7. (A) DTA curve of the (a) M0Z, (b) M25Z, (c) M75Z, (d) M100Z, (e) M150Z, (f) M200Z, (g) M250Z and (h) zeolite 13x; (B) endothermic peaks for desorption of H2O and total weight loss with zeolite content.
increases leading to the increase in the binding energy. In sample M250Z, the endothermic peak is greater than the first endothermic peak of pure zeolite. This is attributed to the hybridization of the binding center providing a higher energy but the pore is partially occupied providing space for the H2O to reside in the entrance of the pore.
Figure 8a shows the variation of weight due to dehydration as a function of digestion time. The weight of the sample decreases as the digestion time increases along with shift of the endothermic peak position of dehydration towards lower temperature. This can be attributed to the
fact that nanoparticles obtained with lower digestion time enter the pores leaving the free zeolite surface for H2O to get
attached with a stronger bond. Figure 8b shows the change in weight and endothermic peak position as a function of incubation time. The mechanism of nanoparticles growth on the surface and pores of zeolite is in agreement with the TG-DTA results of the samples synthesized with different incubation times. At low incubation time (0.5 min), nearly 49% of the nanoparticles remain on the surface of the zeolite (as observed in Mössbauer spectra) which reduces the number of H2O molecules attached to the composites
300 400 500 600 700 800 900 1000 -18
-9 0
(b) (A)
Temperature / K
Heat
flo
w / mW (a)
(c) (d)
(e) (f)
(g)
(h)
-50 0 50 100 150 200 250 10
20
P
eak position / K
(B)
W
eight loss / %
Z13x Zeolite content / mg
0 15 30 8.6
8.8 9.0 9.2
0 80 160 240
10 12 14
16 (b)
(a)
time / min
W
e
ig
h
t
lo
s
s
/
% 336
342
P
e
a
k
p
o
s
it
io
n
/
K
340 360
Figure 8. (a) Weight loss () and dehydration exothermic peak position () of the composites synthesized with 0.5 (D0.5), 5 (D5) and 30 (D30) min of digestion time; (b) weight loss () and dehydration exothermic peak position () of the composites synthesized with 0.5 (I0.5), 15 (I15), 60 (I60) and 240 (I240) min of incubation time.
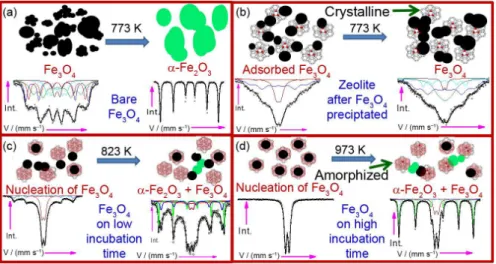
Figure 9. Schematics of the growth of nanoparticles and the thermal treatment effect on (a) pure Fe3O4; (b) Fe3O4 adsorbed on zeolite 13x after precipitation;
(c) nucleation of Fe3O4 on zeolite for low incubation time and (d) nucleation of Fe3O4 on higher incubation of zeolite. Heat treatments were carried out
in air for 2 h.
which is reflected in the weight loss and endothermic peak. As the incubation time increases the quantity of nanoparticles in the pores increases providing more zeolite surface to interact with H2O. Therefore, the weight loss
increases from 9.4 to 13.9% as the incubation time increases from 0.5 to 240 min.
Figure 9 shows the schematic of the nucleation, growth and adsorption of Fe3O4 nanoparticles in the presence
and absence of zeolite. Figure 9a shows that pure Fe3O4
seeds undergo agglomeration during synthesis resulting in larger particle size and high dipole-dipole interaction. The nanoparticle further nucleates along with structural phase transformation showing bulk hyperfine properties for annealing above 773 K. Figure 9b shows the surface-surface interaction of Fe3O4 nanoparticles with zeolite and depicts
the nanoparticles attached to zeolite as a result of coulombic interaction in the digestion method.34,35 Figures 9c and 9d
show the effect of incubation time on thermal stability of Fe3O4 nanoparticles. Incubation provides larger fraction of
nanoparticles in the pores of zeolite resulting in the increase in the superparamagnetic doublet.
The electrostatic interaction between the nanoparticles and the zeolite enhances the thermal stability. In this case a higher thermal treatment (above 773 K) is required to agglomerate the nanoparticles as well as higher activation energy for structural transformation to α-Fe2O3. Surface
adsorbed nanoparticles improve the thermal and chemical stability. Stability can further be increased by increasing the binding energy of the nanoparticles with zeolite. This higher binding energy can be achieved only by growing the nanoparticles from the pores of the zeolite. When the zeolite is dispersed in the precursor solution, the Na+ ions
get replaced by Fe2+/Fe3+ ions and nucleation takes place
from the pores. In this case the nanoparticles get untrapped from the pores and grow only above 923 K.
Conclusions
Superparamagnetic iron oxides were synthesized in the presence of zeolite. Particle size decreases at lower concentration (25-75 mg) of zeolite. With further increase in the zeolite concentration (100-180 mg), Fe3O4 particles
on the surface exhibits bulk magnetic properties. Nucleation on the surface in the case of digestion method maintains the crystal structure of the zeolite 13x. Amorphization takes place as the magnetite nanoparticles nucleates from the pores (incubation method). A binding energy exists within the nanoparticles and zeolite which stabilized the nanoparticles as compared to pure magnetite nanoparticles. Nanoparticles grown on the surface have lower thermal stability compared to the nanoparticles grown in the pores.
0 15 30
8.6 8.8 9.0 9.2
0 80 160 240
10 12 14 16 (b)
(a)
time / min
W
e
ig
h
t
lo
s
s
/
% 336
342
P
e
a
k
p
o
s
it
io
n
/
K
340 360
Acknowledgements
The authors express their thanks to Coordenação de Aperfeiçoamento de Pessoal de Nível Superior (CAPES) - the Brazilian Ministry of Education (MEC) - in the program “Science Without Borders” for the financial support for the project “Study of mechanism of drug delivery” (No. A127/2013) H. S. L. and S. S. P. also thank CAPES for the post-doctoral fellowship. We also acknowledge L. León-Félix for TEM measurements, Subrata Ghosh for providing the template, M. A. R. Martinez and Marcelo M. Parise for assisting in thermal treatment and synthesis, and Leona J. Felicia for reading the manuscript.
References
1. Candiani, A.; Konstantaki, M.; Margulis, W.; Pissadakis, S.;
Opt. Express 2010, 18, 24654.
2. Zhang, J.; Zhao, S.; Zhu, M.; Zhu, Y.; Zhang, Y.; Liud, Z.; Zhang, C.; J. Mater. Chem. B 2014, 2, 7583.
3. Dib, S.; Boufatit, M.; Chelouaou, S.; Sadi-Hassaine, F.; Croissant, J.; Long, J.; Raehm, L.; Charnay, C.; Durand, J. O.;
RSC Adv. 2014, 4, 24838.
4. Jia, S.; Song, T.; Zhao, B.; Zhai, Q.; Gao, Y.; J. Alloys Compd.
2014, 617, 787.
5. Zhang, J.-M.; Zhai, S.-R.; Zhai, B.; An, Q.-D.; Tian, G.; J. Sol-Gel Sci. Technol. 2012, 64, 347.
6. Hu, J.; Hu, X.; Chen, A.; Zhao, S.; J. Alloys Compd. 2014, 603,
1.
7. Jayanthi, S. A.; David, T. M.; Jayashainy, J.; Nathan, D. M. G. T.; Sagayaraj, P.; J. Alloys Compd. 2014, 606, 254. 8. Horn, Y. S.; Sheng, W. C.; Chen, S.; Ferreira, P. J.; Holby, E. F.;
Morgan, D.; Top. Catal. 2007, 46, 285.
9. Alam, S.; Anand, C.; Ariga, K.; Mori, T.; Vinu, A.; Angew. Chem. 2009, 121, 7494.
10. Habrowska, A. M.; Popiel, E. S.; J. Appl. Phys. 1987, 62, 2419.
11. Arruebo, M.; Pacheco, R. F.; Irusta, S.; Arbiol, J.; Ibarra, M. R.; Santamaria, J.; Nanotechnology 2006, 17, 4057.
12. Ichiura, H.; Kitaoka, T.; Tanaka, H.; J. Mater. Sci. 2002, 37, 2937.
13. Soldatkin, O. O.; Kucherenko, I. S.; Shelyakina, M. K.; Soy, E.; Kirdeciler, K.; Ozturk, S.; Renault, N. J.; Akata, B.; Dzyadevych, S. V.; Soldatkina, A. P.; Electroanalysis 2013, 25, 468.
14. Zhang, Y.; Wang, X.; Shan, W.; Wu, B.; Fan, H.; Yu, X.; Tang, Y.; Yang, P.; Angew. Chem., Int. Ed. 2005, 44, 615.
15. Li, Y.; Zhang, X.; Deng, C.; Chem. Soc. Rev. 2013, 42, 8517. 16. Corma, A.; Fornes, V.; Rey, F.; Adv. Mater. 2002, 14, 71.
17. Zhao, W.; Gu, J.; Zhang, L.; Chen, H.; Shi, J.; J. Am. Chem. Soc. 2005, 127, 8916.
18. Roduner, E.; Jensen, C.; Slageren, J. V.; Rakoczy, R. A.; Larlus, O.; Hunger, M.; Angew. Chem., Int. Ed. 2014, 53, 4318.
19. Aydin, C.; Lu, J.; Liang, A. J.; Chen, C.-Y.; Browning, N. D.; Gates, B. C.; Nano Lett. 2011, 11, 5537.
20. Guo, W.; Wang, D.; Hu, J.; Tang, Z. K.; Du, S.; Appl. Phys. Lett. 2011, 98, 043105.
21. Herojit Singh, L. H.; Pati, S. S.; Oliveira, A. C.; Garg, V. K.;
Hyperfine Interact. 2015, 232, 79.
22. El-Din, T. A. S.; Elzatahry, A. A.; Aldhayan, D. M.; Al-Enizi, A. M.; Al-Deyab, S. S.; Int. J. Electrochem. Sci. 2011, 6, 6177.
23. Deboer, F. E.; Selwood, P. W.; J. Am. Chem. Soc. 1954, 76, 3365.
24. Vichery, C.; Maurin, I.; Bonville, P.; Boilot, J.-P.; Gacoin, T.;
J. Phys. Chem. C2012,116, 16311.
25. Jiao, F.; Jumas, J.-C.; Womes, M.; Chadwick, A. V.; Harrison, A.; Bruce, P. G.; J. Am. Chem. Soc. 2006, 128, 12905.
26. Pati, S. S.; Singh, L. H.; Ochoa, J. C. M.; Guimarães, E. M.; Sales, M. J. A.; Coaquira, J. A. H.; Oliveira, A. C.; Garg, V. K.;
Mater. Res. Express2015, 2, 045003.
27. Gnanaprakash, G.; Mahadevan, S.; Jayakumar, T.; Kalyanasundaram, P.; Philip, J.; Baldev, R.; Mater. Chem. Phys. 2007, 103, 168.
28. Gnanaprakash, G.; Philip, J.; Jayakumar, T.; Raj, B.; J. Phys. Chem. B2007, 111, 7978.
29. Peral, I.; Iniguez, J.; Phys. Rev. Lett. 2006, 97, 225502. 30. Kuznicki, S. M.; Bell, V. A.; Nair, S.; Hillhouse, H. W.;
Jacubinas, R. M.; Braunbarth, C. M.; Toby, B. H.; Tsapatsis, M.;
Nature2001, 412, 720.
31. Somogyvari, Z.; Svab, E.; Meszaros, G.; Krezhov, K.; Konstantinov, P.; Ungar, T.; Gubicza, J.; Mater. Sci. Forum
2001, 378-381, 771.
32. Hass, K. C.; Schneider, W. F.; J. Phys. Chem.1996, 100, 9292.
33. Erdem, E.; Karapinar, N.; Donat, R.; J. Colloid Interface Sci. 2004, 280, 309.
34. Zhang, Y.; Zhu, K.; Duan, X.; Zhou, X.; Yuan, W.; J. Mater. Chem. A2014, 2, 18666.
35. Porcher, F. F.; Souhassouab, M.; Lecomte, C. E. P.; Phys. Chem. Chem. Phys. 2014, 16, 12228.