Translation, cross-cultural adaptation and analysis of
the psychometric properties of the lower extremity
functional scale (LEFS): LEFS- BRAZIL
Ligia M. Pereira1, Josilainne M. Dias1, Bruno F. Mazuquin2,
Luiza G. Castanhas3, Maryela O. Menacho4, Jefferson R. Cardoso5
ABSTRACT | Background: There is a lack of questionnaires in Brazilian Portuguese to evaluate patient-reported lower limb function. Objective: To translate, cross-culturally adapt to the Brazilian population, and evaluate the psychometric properties of the Lower Extremity Functional Scale (LEFS). Method: The LEFS was translated by two independent assessors and back-translated to English. Then, the LEFS-Brazil was tested on 20 patients who answered the questionnaire in the cross-cultural adaptation phase. For the evaluation of the psychometric properties, 100 patients answered the questionnaire. The reliability was tested by two independent assessors. The Medical Outcomes Study 36-item from Health Survey (SF-36) was used as the criterion method for construct validity. The sensitivity to change was tested for four consecutive weeks. Results: The internal consistency was α = 0.96. The intra-observer reliability was CCI
(intraclass correlation coeficient) = 0.96 and CCI interobserver = 0.98; the Bland and Altman mean difference (d)
intra-observer = –1.52 and d interobserver = 0.46. The correlation between the LEFS and SF-36 in the irst week was
the following: physical function r=0.82, physical role r=0.57, emotional role r=0.43 and mental health r=0.33. The
LEFS was responsive when comparing the mean of the irst week to the second, third and fourth weeks and comparing
the second to the fourth week. The cut-off point was 11, and the area under the receiving operator curve was 0.96 95%
CI [0.88;0.99], with sensitivity = 0.96, 1-speciicity = 0 and standard error = 0.02. Conclusion:The LEFS-Brazil is reliable, valid and responsive.
Keywords: questionnaires; physical therapy; rehabilitation; validity; reliability; responsiveness.
HOW TO CITE THIS ARTICLE
PereiraLM, DiasJM, MazuquinBF, CastanhasLG, MenachoMO, CardosoJR. Translation, cross-cultural adaptation and analysis
of the psychometric properties of the lower extremity functional scale (LEFS): LEFS- BRAZIL. Braz J Phys Ther. 2013 May-June; 17(3):272-280. http://dx.doi.org/10.1590/S1413-35552012005000091
1 Program in Physical Education, Universidade Estadual de Londrina (UEL), Londrina, PR, Brazil 2 Program in Rehabilitation, UEL, Londrina, PR, Brazil
3 Physical Therapist, Manhattan, KS, USA
4 Faculdades Integradas Aparício Carvalho (FIMCA), Porto Velho, RO, Brazil
5 Laboratory of Biomechanics and Clinical Epidemiology (PAIFIT), , Universidade Estadual de Londrina (UEL), Londrina, PR, Brazil
Received: 11/07/2012 Revised: 14/11/2012 Accepted: 11/01/2013
a r t i c l e
Introduction
The outcome measure in physical therapy can be assessed with functional tests and patient-reported outcomes1. Most questionnaires have been developed
in the English language. Cross-cultural adaptation and psychometric tests of existing instruments would enable comparisons of different populations and permit the exchange of information across cultural and linguistic barriers. One important reason to adapt an existing questionnaire is that it is more eficient than the development of a new questionnaire, and another reason is the substantial work involved in developing and validating a new questionnaire2.
In Brazilian Portuguese, there are specific instruments cross-culturally adapted to evaluate the
lower limb extremities, such as the Lysholm Knee Scoring Scale3 and Western Ontario and McMaster
Universities (WOMAC)4. There is a lack of a generic
questionnaires to evaluate the functional status of the lower limbs of patients.
In 1999, Binkley et al.5 developed the Lower
Italian6, Canadian French7,8 and Dutch9 populations.
Therefore, the aims of this study were to translate the LEFS questionnaire into the Portuguese language, cross-culturally adapt it to the Brazilian population, and evaluate its psychometric properties.
Method
Translation and Back-Translation
The LEFS author was contacted, and he provided authorization to conduct this study. The guidelines developed by Beaton et al.10 were used for the
translation and cross-cultural adaptation of the Brazilian Portuguese version of the LEFS. The English version of the original instrument was translated into Portuguese by two native independent translators (one of whom had experience in the health sciences). The two translations were examined by the research committee, composed of physical therapists and an orthopedic surgeon, to ensure that the translations took into consideration Brazilian cultural characteristics and discrepancies that may relect ambiguities. Then, the two versions were synthesized, and one consensual version was created (1st version). The 1st version was translated back to
English by another two translators whose native language was English and who had not seen the original questionnaire (2nd version). The two 2nd
versions were compared with the original instrument by the research committee, and one equivalent version in Brazilian Portuguese was obtained (3rd version)
after methodological and grammatical analyses.
Cross-cultural adaptation
Version 3 was tested on 20 patients (8 females and 12 males) with lower extremity dysfunctions. The objective of this pilot test was to determine the comprehension of the questions. After the subjects answered the LEFS, they were asked about doubts and suggestions to ensure the understanding of the questionnaire. All the reports were noted and analyzed by the research committee. Then, changes in the instrument were made concerning the units of distance (miles for kilometers), and one question was modified. Thus, a final Portuguese version was obtained (LEFS-Brazil), and its psychometric properties were tested.
Psychometric properties
To evaluate the psychometric properties, 100 patients were necessary according to the sample
size calculation, which considered the expected prevalence of 93% of lower limb musculoskeletal injuries in orthopedic outpatient clinics11 and a 95%
conidence interval (Zα/2 = 1.96); n total = (Zα/2)2 x
p(1-p)/e2), where p = prevalence and e = error (5%)12.
Subjects with a medical diagnosis of orthopedic lower extremity injury and aged between 18 and 60 years old were included, and those who did not understand the questions were excluded. All subjects who agreed to participate in the study were required to give informed written consent (approved by the Universidade Estadual de Londrina (UEL) Ethical Committee, Londrina, PR, Brazil; #241/06) prior to participation in the study.
Reliability
The LEFS-Brazil was applied three times by two different assessors (A and B). On the first day of the physical therapy treatment, assessor A invited the subjects to participate in the study and collected demographic data, such as age, height, weight, information about the lesion, surgery (if it was necessary) and treatment frequency. Then, the subjects answered the LEFS-Brazil for the irst time. After 1 hour, assessor B applied the LEFS to analyze the inter-rater reliability. Then, 24-48 hours after the initial physical therapy session, assessor A re-applied the LEFS-Brazil to test the intra-rater reliability.
Construct validity
On the irst day of physical therapy, after assessor A applied the LEFS-Brazil, the Medical Outcomes Study 36-Item from Health Survey (SF-36)13 was
administered to the patients. The SF-36 is a general health status questionnaire and consists of eight health subscales (physical function, physical role, bodily pain, general health, vitality, social function, emotional role and mental health). Each subscale score ranges from 0 to 100, with higher scores representing more desirable health states.
Responsiveness
The LEFS-Brazil scores in the four weeks obtained by assessor A were analyzed to verify whether there were differences over time. Then, a prognosis rating scale5 was applied by two physical therapists who
did not participate in the study and who answered two questions: “How much change would you expect in this patient at one week following the initial
assessment?” and “How much change would you
expect in this patient at 3 weeks following the initial
assessment?” The therapists needed to choose one of
the following items in response to the two questions: much worse, worse, no change, slight improvement, moderate improvement, large improvement or very large improvement. The therapists based their answers on the patient’s diagnosis, age, frequency of treatment, surgery (if necessary), and time of injury (acute or chronic). The answers were dichotomized into “improvement” or “no improvement”. This measure of change was used because there is no gold standard to measure the responsiveness14.
Statistical analysis
The variables were tested for normal distribution with the Shapiro-Wilk test.The internal consistency was calculated with Cronbach´s alpha and 95% CI using the data from the baseline questionnaire. To evaluate the intra- and inter-rater reliability, the intraclass correlation coefficient (ICC [1-way random])15 and the analysis of agreement
proposed by Bland and Altman16 were used. The
construct validity was determined by the Spearman rank correlation coeficient, with a 95% CI, between the score of the LEFS-Brazil and the SF-36 subscales of physical function, physical role, emotional role and mental health. The sensitivity to change was examined by the repeated measures (ANOVA) analysis. These data were assessed for sphericity using Mauchly’s W test, and whenever the test was violated, necessary technical corrections through the Greenhouse-Geisser test were performed. If the F test was signiicant, the Bonferroni multiple comparison test was used to identify the differences. The receiver operating characteristic curve analysis (ROC curve) was conducted using the values of the LEFS in the fourth week, and the prognosis rating scale was dichotomized by plotting the sensitivity values on the y-axis and 1 minus the speciicity values on the x-axis for different values of the change score. It was calculated using the questionnaire change score and the prognosis rating scale. The loor and ceiling effects were determined by calculating the number of individuals who obtained the lowest (0)
or highest (80) scores and were considered to be present if more than 15% of respondents achieved the lowest or highest possible score, respectively17. The
statistical signiicance adopted for all tests was 5%. The Statistical Package for Social Sciences (SPSS) version 15.0 and MedCalc 10.0.1.0. were used for the statistical analysis.
Results
Cross-cultural adaptation
For the cross-cultural adaptation, 20 patients (8 females and 12 males) with a mean age of 33.5 years (10.8) answered the questionnaire, 16 of whom were in post-surgery. No dificulties were found in translating the instrument to Brazilian Portuguese. A change in the metric system was necessary due to the original version using miles. Some subjects related doubts as to how to answer an item when the medical or physical therapy did not recommend performing the activity that was being questioned. The patients were instructed to mark
“extremely difficult or unable to perform activity”
in this item. When the patient inished answering the questionnaire, the evaluator asked if they had any suggestions to improve the comprehension of the questionnaire. One subject suggested excluding the term bounce in the item jump/bounce. The suggestion was accepted to avoid doubts in the interpretation of the item because some people might understand that jumping is performed with two legs and bouncing is performed with just one leg and because in cases with one side lesion, bouncing would be easier than jumping. The evaluators were instructed to determine whether the patients answered all the items to ensure that there were no missing items. The median time to answer the instrument was 166.5 seconds ([25-75%] 111-217.5). The diagnoses of these patients were the following: 12 with a fracture, 2 with a meniscal injury, 3 with a tendon rupture, 1 with a ligament rupture and 1 with tendinitis. The inal LEFS-Brazil version is given in Appendix 1.
Psychometric properties
Reliability
The intra- and inter-rater reliability results are shown in Table 2. The results indicated high reliability18 (ICC = 0.96 and 0.98) and a good Bland and Altman agreement16 (difference between the
average close to zero). The internal consistency was
α=0.96.
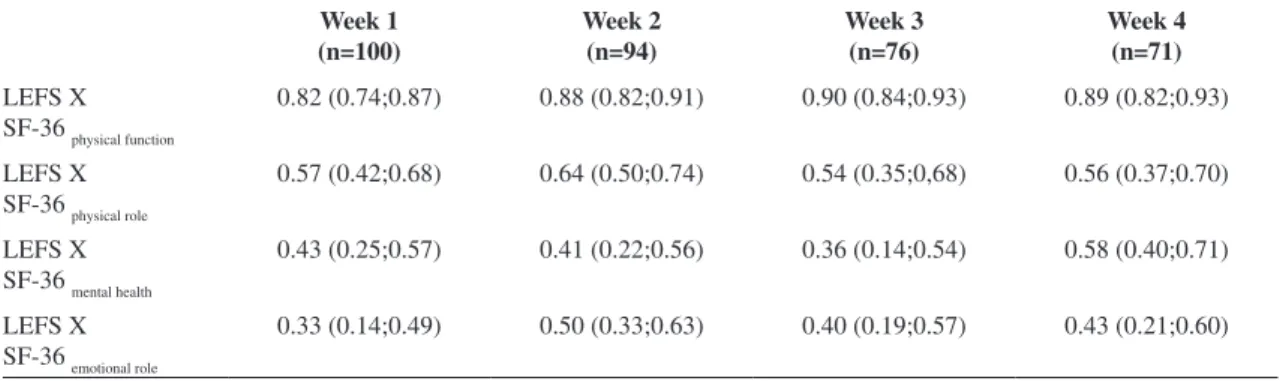
Construct validity
The correlation between the LEFS and SF-36 subscales of physical function and physical role was greater than 0.54, and that between the emotional role and mental health was less than 0.5019, as shown
in Table 3.
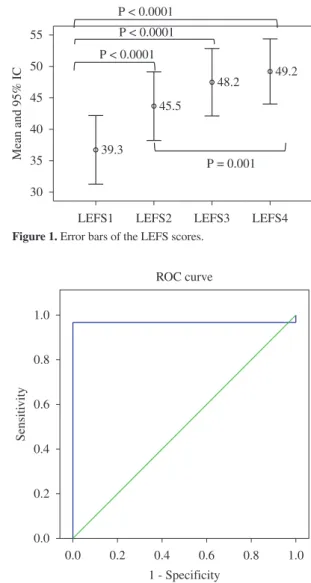
Responsiveness
The questionnaire was responsive when comparing the irst week with the second, third and fourth weeks and also when comparing the second week with the fourth week of treatment (Figure 1). The ROC curve analysis (Figure 2) revealed that the cut-off point was 11 and the area under the curve (AUC) was 0.96 [0.88;0.99] with P<0.0001. The standard error value was 0.02. The sensitivity and 1-speciicity were 0.96 and 0, respectively. The frequency of the LEFS-Brazil
scores varied from 3 to 4.9% (ceiling effect) and 5 to 11.7% (loor effect).
Discussion
The results of this study showed that the LEFS-Brazil had good psychometric properties and can be used in the Brazilian population for clinical and research purposes. The LEFS was translated into and tested in other languages, such as Italian6,
Canadian French7,8 and Dutch9. The Italian version6
was translated to be applied in an interviewer format, and the authors changed the measurement units to kilometers. In the Canadian French version7,8,
the authors maintained the self-reported format of the original version, and the authors presented two measurement systems. The Dutch9 version
also maintained the self-reported format of the
Table 1. Diagnoses of the patients in the psychometric properties test (n=100).
Diagnostic n
Patellofemoral Pain 17
Anterior Cruciate Ligament Sprain 23
Posterior Cruciate Ligament Sprain 1
Patella Fracture 1
Femur Fracture 2
Tibia Fracture 10
Ankle Fracture 4
Fibula Fracture 4
Calcaneus Fracture 1
Achilles Tendon Rupture 3
Achilles Tendon Tendinitis 1
Plantar Fasciitis 3
Ankle Sprain 8
Chondral Lesion 2
Meniscal Injury 18
Calcaneal Spur 2
Total 100
Figure 1. Error bars of the LEFS scores.
original version and changed the measurement units to kilometers. For the sake of the clarity of the questionnaire to the Brazilian Population, the measurement units were also changed to kilometers.
Metsavaht et al.20 published a Portuguese version
of the LEFS. The instrument was tested only on knee injuries, and it is important to note that the LEFS was created to evaluate functionality in all lower limb injuries. The test of the psychometric properties was incomplete. Only the reliability and validity was tested. The responsiveness was not tested, and the authors highlighted that omission as a study limitation. The reliability was tested by the CCI and Pearson´s correlation. Pearson´s correlation is not an appropriate test to evaluate reliability because it only assesses the linear association and not the reliability between measures15. For these reasons, another study
was needed to ensure that the instrument would be available for use in Brazil.
There was no consensus of how to evaluate the psychometric properties.
Terwee et al.21 afirmed that there are a variety of
statistical methods to calculate the responsiveness. Husted et al.22 published a critical review to assess
responsiveness, and their recommendations were the same methods used in this study to calculate the responsiveness of the LEFS-Brazil.
The reliability of the original5, Italian6 and
Canadian French7,8 versions was calculated using
the CCI. In the Dutch9 and Brazilian versions, the
reliability was calculated using the CCI and Bland-Altman test because the evaluation of the information using CCI alone is not adequate for measures such as the inluence of the between-subjects magnitude nor for indicating the value or variations of the measurements and respective errors and the associated impossibility of clinical interpretions15. The Italian
version6 presented an internal consistency α = 0.94.
The test-retest reliability was high for both intra-rater and interrater being ICC = 0.91 95% CI [0.86;0.93] and 0.89 95% CI [0.83;0.91], respectively. The test-retest-reliability, internal consistency and construct validity of the Canadian French was tested by René et al.8 The patients answered the questionnaire for
the second time within 72 hours to evaluate the test-retest reliability. The results were ICC = 0.92 95% CI [0.88;0.96] and an internal consistency α = 0.95 95% CI [0.91;0.99]. The Dutch version9 of the LEFS presented an internal consistency of α = 0.96 and the reliability was ICC=0.86. The mean difference between two applications of the LEFS was 1.87 points CI 95% [0.22;3.52] and the limits of agreement ranged from -11.56 to 15.30 points. These values are similar to the LEFS-Brazil.
The construct validity of the original version was tested by correlating the LEFS with the SF-36. This measure showed high correlations with the SF-36 subscales of physical function (r=0.80) and
Table 2. Intra- and interrater reliability results (n=100).
ICC (1-way random) Bland and Altman
ICC (95% IC) d 95% CI for d SE of d LA 95%
Intra-rater 0.96 (0.94;0.97) –1.52 –2.64;-0.39 5.64 –12.59;11.47
Interrater 0.98 (0.97;0.99) 0.46 –0.23;1.15 3.5 –6.42;8.54
ICC = intraclass correlation coeficient; 95% IC = 95% conidence interval; d = mean difference; SE of d = standard error of the mean
difference; 95% CI for d = conidence interval for the mean difference; LA = limits of agreement.
Table 3. Spearman correlation (95% CI) results between the LEFS and SF-36.
Week 1 (n=100)
Week 2 (n=94)
Week 3 (n=76)
Week 4 (n=71)
LEFS X SF-36 physical function
0.82 (0.74;0.87) 0.88 (0.82;0.91) 0.90 (0.84;0.93) 0.89 (0.82;0.93)
LEFS X SF-36 physical role
0.57 (0.42;0.68) 0.64 (0.50;0.74) 0.54 (0.35;0,68) 0.56 (0.37;0.70)
LEFS X SF-36 mental health
0.43 (0.25;0.57) 0.41 (0.22;0.56) 0.36 (0.14;0.54) 0.58 (0.40;0.71)
LEFS X SF-36 emotional role
physical role (r=0.64) and low correlations with mental health (r=0.23) and emotional role (r=0.32). In the Italian version, the LEFS showed a correlation with the SF-36 physical component summary score of r=0.61 and with mental health of r=0.26 at the initial assessment and r=0.72 and r=0.22, respectively, at the inal assessment. The Canadian French version8 examined the construct validity by
a factorial analysis that showed that all the elements of the questionnaire were from the same principal dimension. The Dutch version9 tested the construct
validity with 16 hypotheses (8 for knee osteoarthritis and 8 for hip osteoarthritis) about the expected magnitude and direction of the relationship between the LEFS and other speciic questionnaires. If 75% or more of the arbitrarily set number of 16 hypotheses agreed, the construct validity was good. The authors found 81%, conirming the validity of the construct. Discriminant validity was measured by correlating the LEFS and physical function subscale of the HOOS and KOOS and contrasting its correlation with the physical function of SF-36 with the pain subscale of SF-36. The correlation found was 0.78 CI 95% [0.69;0.84] between LEFS and HOOS and 0.78 CI 95% [0.73;0.83] between LEFS and KOOS. The correlation between LEFS and SF-36 was 0.51 CI 95% [0.35;0.64] in pain subscale and 0.82 CI 95% [0.75;0.88] for functioning subscale in the hip group and 0.66 CI 95% [0.59; 0.72] for pain and 0.81 CI 95% [0.77;0.85] for function in the knee group.
In the original version5 the minimal detectable
change (MDC) was 9 points. In The Italian version6
the ROC curve analysis revealed an AUC of 0.97 and the sensitivity and speciicity associated with this value were 0.96 and 0.80 respectively. The Dutch version9 of the LEFS presented a standard
error of measurement of 4.4 points and the MDC was 12 points. The AUC of 0.76 and the sensitivity and speciicity associated with this value were not reported. In the Brazilian version the ROC curve analysis revealed that the cut-off point was 11 and the AUC was 0.96 [0.88;0.99] and P < 0.0001. The standard error value was 0.02. The sensitivity and 1-speciicity are 0.96 and 0 respectively.
Originally the LEFS was designed for outpatients. In 2009, Yeung et al.23tested this instrument on
142 inpatients. The instrument revealed a reliability of 0.88 95% CI [0.74;0.95], a MDC of 8.2 points and a standard error of 5.8 points. The construct validity was partially assumed for low correlations between the LEFS and the tests. The authors concluded that the LEFS could be used to evaluate patient progression from inpatient to outpatient rehabilitation.
Watson et al.24 tested the reliability and
responsiveness of the LEFS in 30 patients with anterior knee pain. The participants answered two instruments: the Anterior Knee Pain Scale (AKPS) and the LEFS. The authors reported a test-retest reliability of 0.95 for the AKPS and 0.98 for the LEFS. The AUC was 0.77 CI 95% [0.57;0.97] for the LEFS and 0.69 CI 95% [0.47;0.91] for the AKPS.
Stratford et al.25 validated the LEFS for patients
with total hip or knee arthroplasty. The LEFS presented an internal consistency of 0.93, reliability of 0.95 and minimal detectable change of 9 points. The results of the study contributed to improving the evidence of the capacity of the LEFS to assess lower extremity physical function. The authors concluded that the LEFS is reliable and valid when applied to these patients. Then, Stratford et al.26 veriied
whether the sensitivity to change of the WOMAC was signiicantly superior to that of the LEFS by evaluating 102 patients with hip arthroplasty using the two subscales on the 16th and 20th days after
surgery. The mean of the WOMAC physical function subscales’ standardized responses for this assessment did not favor the WOMAC –0.20 CI 95% [-0.40;0.01], and the mean of the LEFS standardized responses was -0.68 CI 95% [-0.91;-0.48]. The authors concluded that the WOMAC physical function subscale was not superior to the LEFS to detect changes in these patients.
Pua et al.27 tested the 1 week test-retest reliability
of the LEFS and WOMAC in 100 patients with hip osteoarthritis. These patients were evaluated with the questionnaires and physical performance measures. The CCI values were 0.92 CI 95% [0.85;0.96] for the LEFS and 0.90 CI 95% [0.81;0.94] for the WOMAC. The standard error of measurement was 4.5% upper CI 95% [5.8%] for the LEFS and 4.8% upper CI 95% [6.2%] for the WOMAC. The minimal detectable change was 9.9 upper CI 95% [12.5] for the LEFS and 9.1 upper CI 95% [11.6] for the WOMAC.
Lin et al.28 analyzed the clinimetric properties
of the LEFS in individuals with ankle fractures (n=306) and found an internal consistency of α=0.92 at baseline and α=0.90 in the medium-term follow up (more than 12 weeks). The variance in activity limitation explained by the items was 98.3%. Each item had a positive correlation with the overall scale and supported the unidimensionality of the scale. No loor and ceiling effects were found. The authors concluded that the LEFS is useful to measure activity limitation in individuals with ankle fractures.
Beaton10, the cross-cultural adaptation test requires
at least 30 patients. In the Brazilian version, only 20 patients were evaluated. This number was determined by convenience. According to the sample size calculation, 100 patients were necessary for the psychometric analysis. The loss of patients in the fourth week was 25%, which could have altered the responsiveness analysis. This loss could be an explanation for the different cut-off points in the original and Italian version. It is important to note that in the original version, 107 subjects answered the instrument in the irst week, but only 35 answered the instrument in the fourth week. Future research should compare the LEFS-Brazil with speciic instruments and tests in inpatients and athletes.
Conclusion
The Brazilian version of the LEFS-Brazil can be answered in less than three minutes, and the psychometric analysis showed that it is reliable, valid and responsive.
Acknowledgments
The UEL (EDITAL FAEPE/Nº 02/2011) for supporting the scientific dissemination, all the physical therapy students involved in the study and Luana Blanco, Rodolfo Parreira, Lucas Rabello, Elaine Yonemura, Jonas Blanco and César Martins for all their help and support during the development of the study.
References
1. Thonnard JL, Penta M. Functional assessment
in physiotherapy. A literature review. Eura Medicophys. 2007;43:525-41. PMid:18084177.
2. Maher CG, Latimer J, Costa LOP. The relevance of cross-cultural adaptation and clinimetrics for physical therapy
instruments. Rev Bras Fisioter. 2007;11:245-52. http:// dx.doi.org/10.1590/S1413-35552007000400002
3. Peccin MS, Ciconelli RM, Cohen M. Questionário específico para sintomas do joelho “Lysholm Knee Scoring Scale” - tradução e validação para a língua
portuguesa. Acta Ortop Bras. 2006;14:268-72. http:// dx.doi.org/10.1590/S1413-78522006000500008
4. Fernandes MI, Ferraz MB, Ciconelli RM. Tradução e
validação do questionário de qualidade de vida especíico para osteoartrose (WOMAC) para a língua portuguesa. Rev Paulista Reumatol. 2003;10:25.
5. Binkley JM, Stratford PW, Lott SA, Riddle DL. The Lower
Extremity Functional Scale (LEFS): scale development, measurement properties, and clinical application. Phys
Ther. 1999;79:371-83. PMid:10201543.
6. Cacchio A, De Blasis E, Necozione S, Rosa F, Riddle DL,
Di Orio F, et al. The Italian version of the lower extremity functional scale was reliable, valid, and responsive. J Clin
Epidemiol. 2010;5:550-7. PMid:19913388. http://dx.doi. org/10.1016/j.jclinepi.2009.08.001
7. Réné F, Casimiro L, Tremblay M, Brosseau L, Lefebvre A,
Beaudouin M, et al. Une versionne canadienne française du Lower Extremity Functional Scale (LEFS): l’Echelle fonctionnelle des membres inférieurs (ÉFMI), partie
I. Physiother Can. 2011;63:242-248. PMid:22379265
PMCid:3076903. http://dx.doi.org/10.3138/ptc.2010-11F 8. René F, Casimiro L, Tremblay M, Brosseau L, Chea P,
Létourneau L, et al. Fiabilité test retest et validité de construit de la version française de L’Échelle fonctionnelle des membres inférieurs (ÉFMI), partie II. Physiother
Can. 2011;63:249-255. PMid:22379266 PMCid:3076912. http://dx.doi.org/10.3138/ptc.2010-12F
9. Hoogeboom TJ, De Bie RA, Den Broeder AA, Van
den Ende CH. The Dutch Lower Extremity Functional Scale was highly reliable, valid and responsive in
individuals with hip/knee osteoarthritis: a validation study. BMC Musculoskelet Disord. 2012;13:117. PMid:22748143 PMCid:3406936. http://dx.doi. org/10.1186/1471-2474-13-117
10. Beaton DE, Bombardier C, Guillemin F, Ferraz MB. Guidelines for the process of cross-cultural adaptation of self-report measures. Spine (Phila Pa
1976). 2000;25:3186-91. PMid:11124735. http://dx.doi. org/10.1097/00007632-200012150-00014
11. Leadbetter WB. Mechanisms, Prevention and Treatment. In: Fu F, Stone D, editors. Soft tissue athletic injury. Sports
injuries. Baltimore: Williams & Wilkins; 1994.
12. Rosner B. Fundamentals of biostatistics. Paciic Grove: Duxbury Thomson Learning; 2000.
13. Ciconelli RM, Ferraz MB, Santos W, Meinão I, Quaresma
MR. Brazilian-Portuguese version of the SF-36. A reliable
and valid quality of life outcome measure. Rev Bras
Reumatol. 1999;39:143-50.
14. Stratford PW, Binkley FM, Riddle DL. Health status measures: strategies and analytic methods for
assessing change scores. Phys Ther. 1996;76:1109-23. PMid:8863764.
15. Rankin G, Stokes M. Reliability of assessment tools in rehabilitation: an illustration of appropriate statistical
analyzes. Clin Rehabil. 1998;12:187-99. http://dx.doi. org/10.1191/026921598672178340
16. Bland JM, Altman DG. Statistical methods for assessing
agreement between two methods of clinical measurement.
Lancet. 1986;1:307-10. http://dx.doi.org/10.1016/ S0140-6736(86)90837-8
17. Terwee CB, Bot SD, De Boer MR, Van der Windt DA,
Knol DL, Dekker J, et al. Quality criteria were proposed for measurement properties of health status questionnaires.
Clin Epidemiol. 2007;60:34-42. PMid:17161752. http:// dx.doi.org/10.1016/j.jclinepi.2006.03.012
18. Shrout PE, Fleiss JL. Intraclass Correlations: Uses in
19. Gerstman RB. Stat Primer. Correlation [cited 2012
Sept 10]. Available from: http://www.sjsu.edu/faculty/ gerstman/StatPrimer/correlation.pdf.
20. Metsavaht L, Leporace G, Riberto M, Sposito MM, Del
Castillo LN, Oliveira LP, et al. Translation and Cross-cultural Adaptation of the Lower Extremity Functional
Scale Into a Brazilian Portuguese Version and Validation on Patients With Knee Injuries. J Orthop Sports Phys
Ther. 2012;42:932-9. PMid:23047028.
21. Terwee CB, Dekker FW, Wiersinga WM, Prummel MF, Bossuyt PM. On assessing responsiveness of health-related quality of life instruments: guidelines for instrument
evaluation. Qual Life Res. 2003;12:349-62. PMid:12797708. http://dx.doi.org/10.1023/A:1023499322593
22. Husted JA, Cook RJ, Farewell VT, Gladman DD. Methods
for assessing responsiveness: a critical review and
recommendations. J Clin Epidemiol. 2000;53:459-68. http://dx.doi.org/10.1016/S0895-4356(99)00206-1
23. Yeung TS, Wessel J, Stratford P, MacDermid J. Reliability, validity, and responsiveness of the lower extremity functional scale for inpatients of an orthopaedic rehabilitation ward. J Orthop Sports Phys
Ther. 2009;39:468-77. PMid:19487822.
24. Watson CJ, Propps M, Ratner J, Zeigler DL, Horton P,
Smith SS. Reliability and responsiveness of the lower extremity functional scale and the anterior knee pain scale in patients with anterior knee pain. J Orthop Sports Phys
Ther. 2005;35:136-46. PMid:15839307.
25. Stratford PW, Binkley JM, Watson J, Heath-Jones T. Validation of the LEFS on patients with total joint
arthroplasty. Physiother Can. 2000;52:97-105.
26. Stratford PW, Kennedy DM, Hanna SE. Condition-specific Western Ontario McMaster Osteoarthritis index was not superior to region-specific Lower Extremity Functional Scale at detecting change. J Clin
Epidemiol. 2004;57:1025-32. PMid:15528053. http:// dx.doi.org/10.1016/j.jclinepi.2004.03.008
27. Pua YH, Cowan SM, Wrigley TV, Bennell KL. The lower extremity functional scale could be an alternative to the Western Ontario and McMaster Universities osteoarthritis index physical functional scale. J Clin
Epidemiol. 2009;10:1103-11. PMid:19282145. http:// dx.doi.org/10.1016/j.jclinepi.2008.11.011
28. Lin CW, Moseley AM, Refshauge KM, Bundy AC. The lower extremity functional scale has good
clinimetric properties in people with ankle fracture. Phys
Ther. 2009;89:580-8. PMid:19423644. http://dx.doi. org/10.2522/ptj.20080290
Correspondence
Jefferson Rosa Cardoso
Av. Robert Koch, 60
CEP 86038-440, Londrina, PR, Brazil
Appendix 1
Lower Extremity Functional Scale (LEFS)-Brasil
Estamos interessados em saber se você tem tido alguma diiculdade para realizar as atividades listadas abaixo, devido aos problemas com os seus membros inferiores. Por favor, marque uma resposta para cada atividade.
Hoje, você tem ou teria alguma dificuldade com:
Atividade
Extrema dificuldade ou incapacidade de realizar a atividade
Bastante dificuldade
Moderada dificuldade
Pouca dificuldade
Nenhuma dificuldade
Qualquer uma do seu trabalho normal, tarefas domésticas ou nas atividades escolares
Seu passatempo predileto, atividades recreacionais ou esportivas
Entrar ou sair do banho
Caminhar entre os quartos
Calçar seus sapatos ou meias
Agachar-se
Levantar um objeto, como uma sacola de compra do chão
Realizar atividades domésticas leves
Realizar atividades domésticas pesadas
Entrar ou sair do carro
Andar dois quarteirões
Andar aproximadamente 1,5 Km
Subir ou descer 10 degraus
(aproximadamente um lance de escadas)
Ficar em pé durante uma hora
Ficar sentado durante uma hora
Correr em terreno plano
Correr em terreno irregular
Mudar de direção enquanto corre rapidamente
Pular
Rolar na cama
Pontuação:_____________