Printed in Brazil - ©2007 Sociedade Brasileira de Química 0103 - 5053 $6.00+0.00
Short ReportShort ReportShort ReportShort ReportShort Report
*e-mail: [email protected]
Determination of Rhodium and Platinum by Electrothermal Atomic Absorption
Spectrometry after Preconcentration with a Chelating Resin
F. Sánchez Rojas,* C. Bosch Ojeda and J.M. Cano Pavón
Department of Analytical Chemistry, Faculty of Sciences, University of Málaga, E-29071 Málaga, Spain
Este trabalho descreve um procedimento de separação/pré-concentração para a subseqüente análise de traços de ródio e platina em amostras ambientais. Uma resina de troca iônica quelante foi empregada com este objetivo e um sistema em fluxo associado a espectrômetro de absorção atômica com atomização eletrotérmica (FI-ET-AAS) foi usado para a determinação de quantidades traço de Rh e Pt em diferentes materiais. As soluções são tratadas simultaneamente e os íons determinados seqüencialmente. Os limites de detecção de ródio e platina são 0,8 e 1,0
ng mL-1, respectivamente. Linearidade foi obtida no intervalo 0-50 ng mL-1 para ródio e 0-100
ng mL-1 para platina. Os desvios padrão relativos foram 1,8% para 10 ng mL-1 de Rh e 1,6%
para 10 ng mL-1 de Pt. Os fatores de enriquecimento foram de 20 para Rh e 14 para Pt.
The present publication describes a separation/preconcentration procedure for the subsequent trace analysis of rhodium and platinum in environmental samples. A chelating ion-exchange resin was employed for this purpose and an automatic on-line flow injection electrothermal atomic absorption spectrometry (FI-ET-AAS) method was used for the determination of trace amounts of Rh and Pt in different materials. The solutions are simultaneously treated and the ions determined
sequentially. Detection limits of rhodium and platinum are 0.8 and 1.0 ng mL-1, respectively.
Linearity was obtained in the range 0-50 ng mL-1 for rhodium and 0-100 ng mL-1 for platinum. The
relative standard deviations were 1.8% for 10 ng mL-1 of Rh and 1.6% for 10 ng mL-1 of Pt.
Enrichment factors were 20 for Rh and 14 for Pt.
Keywords: rhodium, platinum, electrothermal atomic absorption spectrometry,
preconcentration, flow injection
Introduction
The increasing use of the automobile catalyst leads to the emission of the rhodium and platinum into the environment. During combustion the catalyst is chemically and physically stressed by fast changing oxidative/ reductive conditions, high temperatures and mechanic abrasion, thus creating the emission of these elements and also, palladium, into the environment; they have been deposited along roadways, on vegetation and soil surfaces adjacent to roadways, and in streams, rivers and waterways either directly or as runoff, and can possibly enter the
food chain.1-3
Rhodium, platinum and their complex salts, such as Rh-and Pt-chlorides, have been reported as potential health risks to humans, causing asthma, allergy,
rhino-conjunctivitis and other serious health problems.4
The most common detection techniques for these elements are electrothermal atomic absorption spectrometry (ET-AAS), inductively coupled plasma mass spectrometry (ICP-MS) and inductively coupled atomic emission spectrometry (ICP-AES), adsorptive cathodic stripping voltammetry (ACSV) and neutron activation analysis (NAA). The concentration of these elements is still relatively low in environmental compartments. For this reason, a preconcentration procedure is often needed to increase concentration levels in analysed solutions and also remove
matrix interference.5 A number of methods for separation
and preconcentration of platinum group metals have been
developed: sorption on metal hydroxides,6-8 chemically
modified silica9-15 and also on many types of polymeric
sorbents.16-26
system for palladium, platinum and rhodium for ET-AAS and ICP-AES; the investigated metals were preconcentrated as their bis(carboxylmethyl)dithiocarbamate (CMDTC) chelates on a microcolumn packed with XAD-4 after the off-line addition of solid CMDTC to the sample solution
containing SnCl2, and hydrochloric acid.19 The development
of a new selective system for on-line solid phase extraction of Rh, Pt and Pd and the design of an FIA–FAAS system have been proposed for the determination of these elements in solutions obtained by the decomposition of geological
and technological samples.27
The purpose of the present work was the application of an automatic on-line FI-ET-AAS method previously
developed28,29 for the simultaneous determination of trace
amounts of platinum and rhodium.
Experimental
Reagents
Analytical reagent grade chemicals were used throughout. PSTH-Dowex was synthesized as described
elsewhere.30 A standard 1000 µg mL-1 Pt(IV) and
rhodium(III) solutions (CertiPUR, Merck) were used. A pH 9.2 buffer was prepared by mixing 25 mL of 0.2 mol
L-1 glycine with 8.4 mL of 0.2 mol L-1 sodium hydroxide
and diluting to 100 mL with deionized water. HNO3
(Merck) 2 mol L-1 was used as eluent.
Apparatus
A Perkin-Elmer Zeeman/4100 ZL atomic absorption spectrometer equipped with an AS-70 furnace autosampler was used throughout. Pyrolitic graphite coated tubes with pyrolitic graphite platforms were used in all experiments; the graphite tube lifetime is long, about 100 injections. The primary radiation sources were a platinum hollow cathode lamp operated at 15 mA; the selected wavelength was 265.9 nm with a spectral slit width of 0.7 nm, and a rhodium hollow cathode lamp operated at 15 mA; the selected wavelength was 343.5 nm with a spectral slit width of 0.2 nm. Absorbance
signals were measured in peak area with Zeeman effect background correction.
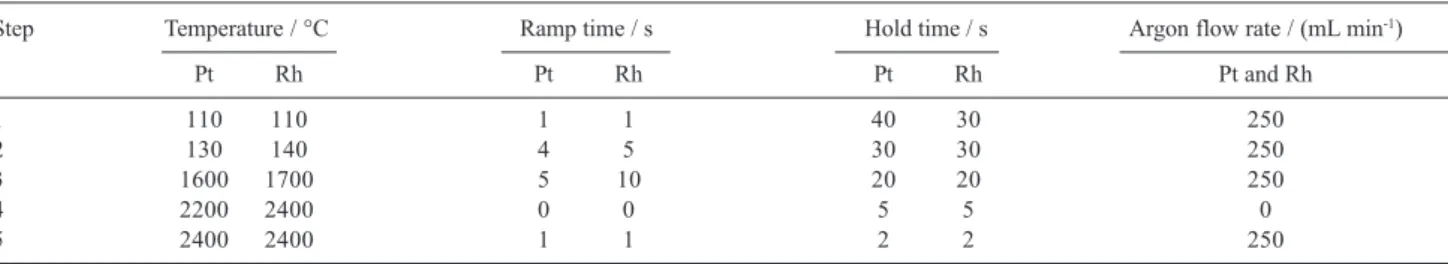
The graphite furnace temperature programs for the determination of platinum and rhodium are shown in Table 1.28,29
The microcolumn containing the PSTH-Dowex was a
glass tube (3 cm × 3 mm id) packed to a height of 0.2 cm;
at both ends of the microcolumn, polyethylene frits were fixed to prevent material losses. On the end of this column was placed a piece of sample capillary of the sampler arm, in imitation of the sample tip of the sampler arm. Thus, the sample tip of the sampler arm was replaced with this microcolumn, permitting normal working of the sampler.
A peristaltic pump, P (Gilson Minipuls 3), fitted with a vinyl pump tube (1.65 mm id), was used for loading of the sample. A Rheodyne Type 50 six-port rotary valve was used as a switching valve. Transport lines were made using 0.8 mm id PTFE tubing. The peristaltic pump and the selection valve were readily controlled electronically via two switches on the autosampler that were actuated when the autosampler arm was down. The process was thus fully automated without altering the software of the AA spectrometer. For sample digestion, a focused-microwave oven, Microdigest 301 controlled by Prolabo TX-32, was used and the cavity of it is for one sample. All glassware used was washed with 10% nitric acid for 24 h and rinsed with deionised water immediately before use.
Procedure
The schematic diagram of FI-ET-AAS was shown
previously.28,29 During the 1 min sample loading period, a
3.5 mL min-1 flow of sample (standard or blank) at pH
9.2, buffered with glycine-sodium hydroxide, is pumped through the microcolumn (located in the sampler arm); the metal ions platinum and rhodium were adsorbed on the sorbent microcolumn and the sample matrix is sent to waste; then, the switching valve is actuated and the pumps of the AS-70 furnace autosampler are connected, permitting the operation of the autosampler in the normal
Table 1. Graphite furnace temperature programs
Step Temperature / °C Ramp time / s Hold time / s Argon flow rate / (mL min-1)
Pt Rh Pt Rh Pt Rh Pt and Rh
1 110 110 1 1 40 30 250
2 130 140 4 5 30 30 250
3 1600 1700 5 10 20 20 250
4 2200 2400 0 0 5 5 0
mode; a wash step takes place with de-ionised water and, immediately after, the sampler arm lowers the sample capillary into an autosampler cup (filled with eluent)
aspirating 40 µL of 2 mol L-1 HNO3; then, the sampler
arm swings over to the graphite furnace and the tip of the sampler capillary is inserted into the dosing hole of the graphite tube where the eluted Rh(III) and Pt(IV) were deposited as a drop; the sampler arm then returns to its initial position and the cycle of the furnace operation commences; while the temperature programme is running, the switching valve is again turned to start a new loading of the sample (standard or blank); thus, when the spectrometer gives the measurement, the microcolumn is ready for a new injection of eluent.
Preparation of samples
The certified reference material (CRM) analysed to determine the accuracy of the proposed procedure was National Institute of Standard and Technology (NIST), Standard Reference Material (SRM) 2557 catalyst. The sample was first prepared in accordance with the instruction of the analysis certificate, after which an accurately weighed amount of 0.1 g was subjected to microwave digestion. The working condition of the microwave oven is listed in Table 2. After digestion, the sample was diluted to 100 mL with de-ionised water in a calibrated flask.
As far as we know, CRM platinum and rhodium in all the explored matrices is not available. In view of the application of the method to the determination of platinum and rhodium in vegetation and food samples, the ability to recover platinum and rhodium from different samples spiked with platinum and rhodium was investigated. For this purpose, standard solutions containing platinum and rhodium were added to 0.2-0.7 g of different solid samples and the resulting material was prepared by microwave digestion as are listed in Table 2. Tap water was collected immediately prior to the analysis.
Results and Discussion
Experimental parameters
Optimum chemical parameters including sample acidity, ionic strength, FI variables (loading time, sample flow rate) and ET-AAS parameters have been separately obtained in
previous works28,29 for platinum and rhodium, respectively.
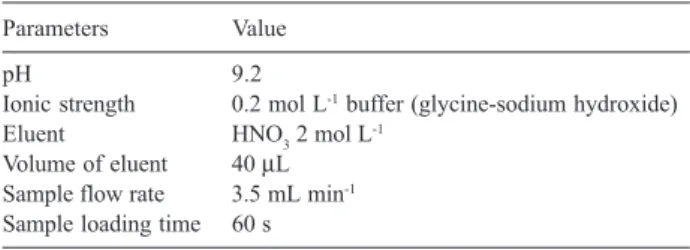
In this study, with the aim of investigating the possibility of determining Pt(IV) and Rh(III) in mixtures, the optimum working conditions were studied under the conditions previously established for each metal ion. The results obtained for these parameters are listed in Table 3.
Performance of the method
The characteristic performance data of the FI-ET-AAS system for rhodium and platinum determination are summarized in Table 4.
The effect of diverse ions on the determination of rhodium and platinum are examined under the optimum condition of the procedure. The tolerance limit was taken as that concentration which does not cause more than a 5% change in the atomic absorption. For these studies different amounts of ionic species were added to a solution
of 10 ng mL-1 of rhodium and platinum. The interference
effects are given in Table 5.
Analysis of synthetic mixtures
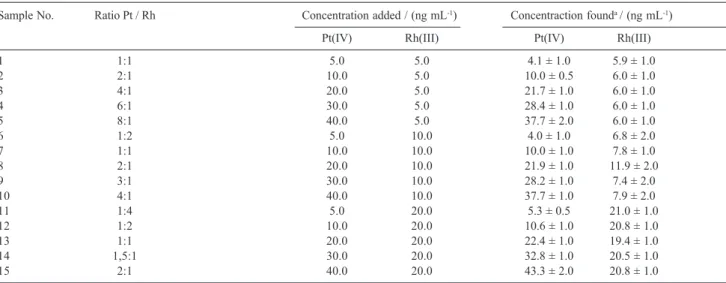
In order to check for potential synergistic effects of the mixtures of two ions, various synthetic mixtures were readily resolved by using pertinent calibration graphs. The analytical results are listed in Table 6. As it can be seen, mixtures of the two ions can be resolved with satisfactory results.
Analytical applications
In order to test the accuracy and applicability of the proposed method for the analysis of real samples, one
Table 3. Collection of the optimised parameters for the separation and preconcentration of platinum and rhodium with PSTH-Dowex
Parameters Value
pH 9.2
Ionic strength 0.2 mol L-1 buffer (glycine-sodium hydroxide) Eluent HNO3 2 mol L-1
Volume of eluent 40 µL Sample flow rate 3.5 mL min-1 Sample loading time 60 s
Table 2. Working conditions for microwave oven
Sample Step Reagent Volume / mL Power / % time / min
A* 1 HNO
3 10 15 10
2 H2O2 5 15 14
B* 1 HNO
3 10 15 10
2 HNO3 10 30 22
3 H2O2 5 30 5
C* 1 HCl 15 50 5
HNO3 5 30
2 — — 10
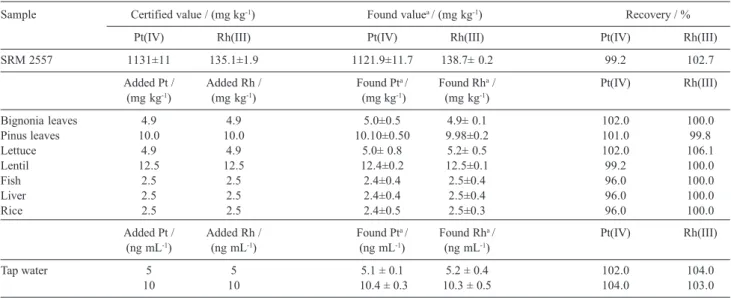
reference material was analysed. The result, as the average of the four separate determinations, is shown in Table 7. As it can be seen, the platinum and rhodium concentrations determined by the proposed method are in close agreement with the certified values.
It has been shown that Pt in road dusts has increased after the introduction of vehicle catalyst. Metallic Pt is considered non allergenic and since the emitted Pt is probably in the metallic or oxide form, the sensitising
potential is probably low. Platinum from road dusts, however, can be solubilised, and enter waters,
sediments, soils and the food chain.31 The fact that
platinum might have entered the food chain was the reason for the rapid and detailed evaluation of the platinum content in various environmental samples. On the other hand, also, the environmental concentration of rhodium is slowly increasing as result of using PGE in automobile catalytic converters. Since finely dispersed rhodium particles from exhaust converters become bio-available by some alimentary chain or metabolic pathway, toxic effects are expected. The main pathways by which rhodium can enter the food chain have to be taken into account: aerosol deposition caused by Rh emission from motor vehicles and industrial sources. The primary sources from which rhodium can be incorporated into the human body are therefore plants or agricultural products. This explains the increasing interest in quantifying rhodium in real matrices of alimentary concern. In view of the application of the method to the determination of
Table 5. Tolerance of foreign ions in the determination of 10 ng mL-1 of rhodium and 10 ng mL-1 of platinum
Ion or species Tolerance ratio
Mg2+, Ni2+, SO 4
2–, Br–, ClO 4
–, PO 4
3–, F–, EDTA >4000 Pb2+, Mn2+, Al3+, Ba2+ 2000
Cr3+ 1000
aCa2+, Cd2+, SCN– 500
Cu2+, Zn2+, aFe2+, aFe3+ 250
aCo2+ 100
aSn2+ 50
Pd2+ 10
aWith EDTA as masking agent (40 mg mL-1).
Table 4. Performance of the FI-ET-AAS system for Rh and Pt determination
Analytical parameters Rhodium Platinum
Working concentration range / (ng mL-1) 0-50 0-100
Calibration function / (ng mL-1) A= 0.028C + 0.009 A=0.006C+0.045
Correlation coefficient 0.995 0.996
Detection limit / (ng mL-1) 0.8 1.0
Quantification limit / (ng mL-1) 2.0 4.0
Precision (% RSD), n=10, C=10 ng mL-1 1.8 1.6
Sampling frequency / h-1 30 29
Enrichment factor 20 14
Concentration efficiency / min-1 10 7
Consumptive index / mL 0.12 0.18
Table 6. Resolution of synthetic Pt(IV)-Rh(III) mixtures by use of the proposed method
Sample No. Ratio Pt / Rh Concentration added / (ng mL-1) Concentraction founda / (ng mL-1)
Pt(IV) Rh(III) Pt(IV) Rh(III)
1 1:1 5.0 5.0 4.1 ± 1.0 5.9 ± 1.0
2 2:1 10.0 5.0 10.0 ± 0.5 6.0 ± 1.0
3 4:1 20.0 5.0 21.7 ± 1.0 6.0 ± 1.0
4 6:1 30.0 5.0 28.4 ± 1.0 6.0 ± 1.0
5 8:1 40.0 5.0 37.7 ± 2.0 6.0 ± 1.0
6 1:2 5.0 10.0 4.0 ± 1.0 6.8 ± 2.0
7 1:1 10.0 10.0 10.0 ± 1.0 7.8 ± 1.0
8 2:1 20.0 10.0 21.9 ± 1.0 11.9 ± 2.0
9 3:1 30.0 10.0 28.2 ± 1.0 7.4 ± 2.0
10 4:1 40.0 10.0 37.7 ± 1.0 7.9 ± 2.0
11 1:4 5.0 20.0 5.3 ± 0.5 21.0 ± 1.0
12 1:2 10.0 20.0 10.6 ± 1.0 20.8 ± 1.0
13 1:1 20.0 20.0 22.4 ± 1.0 19.4 ± 1.0
14 1,5:1 30.0 20.0 32.8 ± 1.0 20.5 ± 1.0
15 2:1 40.0 20.0 43.3 ± 2.0 20.8 ± 1.0
platinum and rhodium in soil, food and beverage samples, the ability to recover platinum and rhodium from different samples spiked with platinum and rhodium was investigated. For this purpose, standard solutions containing platinum and rhodium were added to samples and the resulting material was prepared as described under Experimental. Standard additions method was used in all instances and the results were obtained by extrapolation. The results of these analyses are summarised in Table 5 and indicated excellent recoveries.
Conclusions
Sensitive methods frequently in connection with prior preconcentration are required for the determination of rhodium and platinum in the environment. There are only a few methods enabling their quantitation at extremely low levels, these are ASV, NAA, ET-AAS and ICP-MS. AAS have been used extensively in many laboratories, but detection limits of direct determination, including by ET-AAS are thus unsatisfactory. Suitable preconcentration techniques prior to the determination by ET-AAS are solvent extraction, sorption and ion exchange.
Conventional off-line procedures for separation and preconcentration, although effective, are usually time-consuming and tedious, and are vulnerable to contamination and analyte loss. FI-on line column preconcentration-ET-AAS has revolutionised trace element analysis in samples with complicated matrices. The separation and preconcentration system for platinum and rhodium described in this work shows a considerable
Table 7. Determination of platinum and rhodium in certified and spiked tap water, vegetation and foods
Sample Certified value / (mg kg-1) Found valuea / (mg kg-1) Recovery / %
Pt(IV) Rh(III) Pt(IV) Rh(III) Pt(IV) Rh(III)
SRM 2557 1131±11 135.1±1.9 1121.9±11.7 138.7± 0.2 99.2 102.7
Added Pt / Added Rh / Found Pta / Found Rha / Pt(IV) Rh(III)
(mg kg-1) (mg kg-1) (mg kg-1) (mg kg-1)
Bignonia leaves 4.9 4.9 5.0±0.5 4.9± 0.1 102.0 100.0
Pinus leaves 10.0 10.0 10.10±0.50 9.98±0.2 101.0 99.8
Lettuce 4.9 4.9 5.0± 0.8 5.2± 0.5 102.0 106.1
Lentil 12.5 12.5 12.4±0.2 12.5±0.1 99.2 100.0
Fish 2.5 2.5 2.4±0.4 2.5±0.4 96.0 100.0
Liver 2.5 2.5 2.4±0.4 2.5±0.4 96.0 100.0
Rice 2.5 2.5 2.4±0.5 2.5±0.3 96.0 100.0
Added Pt / Added Rh / Found Pta / Found Rha / Pt(IV) Rh(III)
(ng mL-1) (ng mL-1) (ng mL-1) (ng mL-1)
Tap water 5 5 5.1 ± 0.1 5.2 ± 0.4 102.0 104.0
10 10 10.4 ± 0.3 10.3 ± 0.5 104.0 103.0
amean ± standard deviation (n=4).
chemical selectivity and allows high sensitivity enhancements even from small sample volumes. It should therefore be practicable for platinum and rhodium trace analysis in a variety of matrices. This system also has the advantage being able to be fully automated without complicated hardware and software; in fact modification of the software of the spectrometer and the use of additional computers were not necessary.
In this research we have developed the determination of platinum and rhodium in mixtures by using a new optimum pH of 9.2 as compromising for simultaneous determination of platinum and rhodium in different samples (although the instrument measurements are sequentially). The main new advancements resulting from this study are that permit the determination of platinum and rhodium in the same samples (or standards) which allows to significantly time reduction in the sample preparations and in the total time analysis.
Acknowledgments
The authors thank to the Ministerio de Educación y Ciencia for supporting this study (Project CTQ-2006-00735) and also to the Junta de Andalucía.
References
2. Gómez, B.; Palacios, M. A.; Gómez, M.; Sánchez, J.L.; Morrison, G.; Rauch, S.; McLeod, C.; Ma, R.; Caroli, S.; Alimonti, A.; Petrucci, F.; Bocca, B.; Schramel, P.; Zischka, M.; Petterson, C.; Wass,U.; Sci. Total Environ. 2002,299, 1. 3. Ravindra, K.; Bencs, L.; Van Grieten, R.; Sci. Total Environ.
2004,318, 1.
4. Merget, R.; Rosner, G.; Sci. Total Environ. 2001,270, 165. 5. Bencs, L.; Ravindra, K.; Van Grieten, R.; Spectrochim. Acta,
Part B2003, 58, 1723.
6. Manziek, L.; Precious Metals Recovery and Refining, Historical Publications, IPMI: Texas, U.S.A, 1990.
7. Cantarero, A.; Gómez, M. M.; Cámara, C.; Palacios, M.A.; Anal. Chim. Acta 1994,296, 205.
8. Singh, D. K.; Mehrotra, P.; Chromatographia 1987, 23, 747. 9. Van Staden, J. F.; Rademeyer, C.J.; Linsky, S.M.; S. Afr. J. Chem.
1997,50, 115.
10. Townshend, A.; Habib, K.A.J.; Microchem. J. 1992,45, 210. 11. Grote, M.; Kettrup, A.; Anal. Chim. Acta 1985, 172, 223. 12. Seshadri, T.; Kettrup, A.; Fresenius Z. Anal. Chem.1982, 310,
1.
13. Terada, K.; Matsumoto, K.; Taniguchi,Y.; Anal. Chim. Acta
1983, 147,411.
14. Samara, C.; Kouimtzis, T. A.; Fresenius Z. Anal. Chem1987, 327, 509.
15. Ivanov, V. M.; Gorbunova, G. N.; Kudryavtsev, G. V.; Lisichkin, G. V.; Shurupova, T.I.; Zh. Anal. Khim.1984,39, 504. 16. Plantz, M. R.; Fritz, J. S.; Smith, F. G.; Houk, R. S.; Anal. Chem.
1989,61,149.
17. Kritsotakis, K.; Tobschall, H.J.; Fresenius Z. Anal. Chem. 1985, 320,152.
18. Myasoedova, G. V.; Antokol´skaya, I. I.; Kubrakova, I. V.; Zh. Anal. Khim. 1986, 41, 1816.
19. Lee, M. L.; Tölg, G.; Beinrohr, E.; Tshopel, P.; Anal. Chim. Acta1993,272, 193.
20. Rocklin, R. D.; Anal. Chem. 1984, 56, 1959.
21. Cocherie, A.; Volfinger, M.; Meyer, G.; J. Radioanal. Nucl. Chem. 1987, 113, 133.
22. Grote, M.; Wigge, P.; Kettrup, A.; Fresenius Z. Anal. Chem.
1982, 310, 369.
23. Grote, M.; Kettrup, A.; Fresenius Z. Anal. Chem. 1987, 327, 11.
24. Chang, X.; Li, Y.; Luo, X.; Zhang, G.; Su, Z.; Gao, J.; Anal. Chim. Acta1991,245, 13.
25. Konor, B.; Basu, S.; Das, H.R.; Indian J. Chem.1992,31A, 735.
26. Coedo, A. G.; Dorado, M. T.; Padilla, I.; Alguacil, F.; Anal. Chim. Acta1997, 340, 31.
27. Kovalev, I.A.; Bogacheva, L. V.; Tsysin, G. I.; Formanovsky, A. A.; Molotov, Y.A.; Talanta 2000, 52,39.
28. González, M. M.; Sánchez, F.; Bosch, C.; García, A., Cano, J. M.; Anal. Bioanal. Chem. 2003,375, 1229.
29. Sánchez, F.; Bosch, C.; Cano, J. M.; Talanta2004,64,230. 30. Cañada, P.; Garcia, A.; Cano, J.M.; Sanchez, F.; Talanta1998,
46, 1095.
31. Hees, T.; Wenclawiak, B.; Lustig, S.; Scramel, P.; Schwarzer, M.; Schuster, M.; Verstraete, D.; Dams, R.; Helmers, E.; Environ. Sci. Pollut. Res. Int. 1998,5,105.