A
rti
g
o
*e-mail: [email protected]
DETERMINATION OF Cd AND Pb IN FUEL ETHANOL BY FILTER FURNACE ELECTROTHERMAL ATOMIC ABSORPTION SPECTROMETRY
Tatiana D. Saint’Pierre, Tatiane de A. Maranhão, Vera L. Frescura and Adilson J. Curtius
Departamento de Química, Universidade Federal de Santa Catarina, 88040-900 Florianópolis - SC, Brasil
Ricardo Q. Aucélio*
Departamento de Química, Pontifícia Universidade Católica do Rio de Janeiro, 22253-900 Rio de Janeiro - RJ, Brasil
Recebido em 29/6/07; aceito em 4/4/08; publicado na web em 22/9/08
DETERMINATION OF Cd AND Pb IN FUEL ETHANOL BY FILTER FURNACE ELECTROTHERMAL ATOMIC ABSORPTION SPECTROMETRY. A method was developed for quantification of Cd and Pb in ethanol fuel by filter furnace atomic absorption spectrometry. Filter furnace was used to eliminate the need for chemical modification, to stabilize volatile analytes and to allow the application of short pyrolysis step. The determinations in samples were carried out against calibration solutions prepared in ethanol. Recovery tests were made in seven commercial ethanol fuel samples with values between 90 and 120%. Limits of detection were 0.1 µg L-1 for Cd and 0.3 µg L-1 for Pb. Certified water samples (APS 1071, APS 1033, NIST 1643d, NIST 1640) were also used to evaluate accuracy and recoveries from 86.8% to115% were obtained.
Keywords: filter furnace atomic absorption spectrometry; fuel ethanol; cadmium.
INTRODUCTION
Ethanol from sugarcane has been used in Brazil as an alternative automotive fuel and as an oxygenated addictive for gasoline and biodiesel. The use of ethanol has been stimulated by private and government programs in order to reduce dependence from petroleum derivatives and to use a more environment-friendly energy source.1,2 Ethanol fuel is classified as anhydrous or hydrated. While the hydrated ethanol has been used directly as a fuel, anhydrous ethanol has been mixed (in proportions varying from 20 to 26%) with gasoline (gasol) to act as an oxygenated additive. This procedure has been able to decrease CO and NOx emissions without significant decreasing of engine performance.3,4
In Brazil, where an extensive ethanol fuel program have been established, legislation has stipulated concentration limits for Cu, Fe and Na in alcohol which vary from the ng g-1 to the µg g-1 level according to the analyte and type of the fuel (anhydrous or hydrated).5 The combustion of ethanol may also contribute significantly to the emissions of metals of environmental concern, therefore, a quality control is necessary because of the extensive use of this fuel. Ele-ments such as Cd, and Pb are normally absent or present in very low concentrations in this kind of sample, unless in case of contamina-tions. For this reason, sensitive analytical techniques are required for their determination aiming the quality control of fuels. There are probably many ways of how these chemical species are introduced into the alcohol fuel, however, the two most probable routes are the contamination during fuel processing and the incorporation of these metals during sugar cane growth.
In the literature, a small number of articles describe analytical methodologies for trace elemental determination in alcoholic ma-trices. Most of them are dedicated to beverages.6 For alcohol fuel, literature indicates capillary electrophoresis to separate and quantify inorganic ions, among them five cations (Na+, K+, Li+, Ca2+, Mg2+) using conductivity detector.7 However, flame atomic absorption spectrometry (FAAS) is the most used technique.8,9 In general, a
previous separation of metals from the matrix to perform analyte pre-concentration is carried out, in order to circumvent the relatively low sensitivity of FAAS.10 Since electrothermal atomic absorption spectrometry (ET AAS) is appropriate to eliminate organic matrix previous to analyte atomization, this technique could be indicated for alcohol samples.11 A recent method based on ET AAS has been developed for the quantification of As, Cu, Fe, Pb, Sb and Sn in alcohol fuel using STPF (stabilized temperature platform furnace) conditions. The high sensitivity of the technique ensured the quan-tification of low concentrations of the analytes without the need for pre-concentration. Different approaches for chemical modification were tested for As, Pb, Sb and Sn.12
close to the tolerance limit of the FF.
Lead and cadmium, two elements from the first group described above, are ideal elements to be determined in complex samples using FF without the use of chemical modifiers. Lead has been determined directly in whole blood using laser enhanced atomic fluorescence and FF atomization.16 In this case, the selective nature of the fluorescence allowed determination without significant background using a longi-tudinally heated furnace. More recently, FF AAS, using a transversely heated furnace, have been successfully used for the determination of Cd and Pb in biological fluids and other organic samples without the use of chemical modification.17-19 The transversely heated furnace allows a smaller temperature gradient improving the efficiency of the analyte vapor diffusion through the filter and therefore minimizing background interference. These successful applications of FF in complex organic matrices indicated the potential of the technique for the development of a simple and sensitive method for determination of Cd and Pb in alcohol automotive fuel samples. Since alcohol is a sample containing a relatively smaller organic load, when compared to biological fluids, a simple longitudinally heated furnace is expected to be adequate for this application.
The goal of this paper is to develop simple and fast ET AAS method for the determination of two volatile elements (Cd and Pb) in automotive alcohol samples. A graphite filter placed inside a longitudinally heated graphite tube was used for sample atomization. Using this approach, chemical modification is avoided, eliminating the potential introduction of Cd and Pb, present as contaminants in the commercial chemical modifier solutions, into the furnace. Calibration strategies specific for alcohol samples are indicated. In addition, a faster heating cycle could be employed, increasing sample throughput.
EXPERIMENTAL
Apparatus
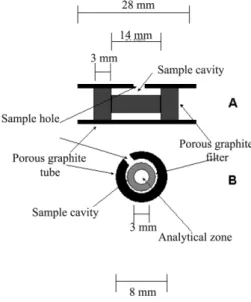
The measurements were carried out with an AAnalyst 100 atomic absorption spectrometer from Perkin-Elmer (Norwalk, CT, USA) interfaced with a PC. The instrument was equipped with a HGA 800 longitudinally heated graphite furnace and an AS-72 autosampler also from Perkin-Elmer. Unspecific light absorption was corrected by con-tinuum light source (deuterium lamp) background correction. Argon 99.996% was used as purge gas. Hollow cathode lamps (Perkin-Elmer, USA) were used as the radiation source of the 283.3 nm lead line and 228.8 nm cadmium line. Operational conditions (current lamp and spectral bandpass) were chosen according to the recommendations from the instrument fabricant. Pyrolytic graphite coated tubes (Perkin-Elmer) were used as sample atomization reservoir. For filter furnace technique, a spool shaped graphite filter made in the laboratory with porous spectroscopy grade graphite (Carbone of America, Palo Alto, CA, USA) was used.16 The graphite filter was introduced inside the pyrotically coated graphite tube (Figure 1). The most important criterion for the choice of graphite was its permeability. Graphite from National Carbon (Cleveland, OH), found to have large porosity allowing a fast release of atomic vapors of relatively volatile elements, was used in this work. A piece of carbon rod was machined with the dimensions shown in Figure 1. The most critical parameter was the thickness of the wall that separates the sample cavity and the analytical zone. A thickness of 0.6 mm was chosen to allow excellent diffusion of atomic vapor and still be strong enough to permit the manipulation of the filter without breaking. For platform atomization technique, a L’vov type platforms (Perkin-Elmer) made of pyrolytic graphite were used. Although sample volumes as large as 60 mL can be used in the filter furnace technique,13 a 10 µL volume of sample was introduced into the atomizer. For platform technique, 10 µL volumes of the (NH4) H2PO4 chemical modifier solution was used.
Reagents
All chemical reagents were of analytical grade. The water (resistivity of 18.2 MΩcm) used was de-ionized in a Milli-Q sys-tem (Bedford, MA, USA). Nitric acid (Carlo Erba, Milan, Italy) and analytical grade ethanol (Merck, Brazil) were further purified by subboiling distillation in a quartz still. Ethanol was used for matrix matching calibration. Lead and cadmium 1000 mg L -1 atomic absorption aqueous standard were from Spex (Edison, NJ, USA). (NH4)H2PO4 used as chemical modifier (1.2 mg L -1) was from Merck (Darmstadt, Germany). Standard reference materials from the National Institute of Standards and Technology (NIST, Gaithersburg, MD, USA) were used to evaluate the performance of the filter furnace. NIST SRM 1640 (Natural Water), NIST SRM 1643d (Trace Elements in Water) were chosen. Other two standards from Alpha Resources Inc (Stevensville. MI, USA) were employed: APS 1071 (Drinking Water Standard Solution) and APS 1033 (QCS # 3 standard).
Procedures
All aqueous standards were prepared by sequential dilution of the 1000 mg L -1 Cd or Pb standard. Calibration solutions (0.2 to 2.0 µg L-1 for Cd and 0.5 to 2.5 µg L-1 for Pb) were prepared in 90% v/v ethanol and 10% v/v of a 4 mol L-1 HNO
3. The use of nitric acid was found to be important for the preparation of samples since it was ob-served a continuous decreasing of signal in alcoholic medium without acidification. The acid treatment is also important for isoformation of chemical species. Fuel ethanol samples were also prepared using the same procedure.
A 10 µL volume of sample was introduced either for the filter furnace technique or platform technique. When required, 10 µL vo-lume of chemical modifier solution was used. Ethanol or automotive alcohol samples were spiked with appropriate volumes of an aqueous standard of the analyte of interest.
The spool shaped graphite filter used for filter furnace technique needed to be conditioned in order to reduce the background levels emitted by impurities in the graphite. The temperature program for conditioning is shown in Table 1 and it was employed at least three times before it was used for analytical determinations.
Figure 1. Graphite filter adapted to the longitudinally heated graphite tube.
RESULTS AND DISCUSSION
Heating profiles and integrated absorbance for Cd and Pb using FF and STPF
In order to perform trace determinations of volatile elements in complex samples by ET AAS, the use of chemical modifiers is crucial. For Cd and Pb, the traditional approach is the introduction of solutions of the chemical modifiers along each sampling. Pd/ Mg(NO3)2 (“universal chemical modifier”) is one of the most efficient chemical modifiers for the thermal stabilization of Cd and Pb.20,21 However, the ammonium phosphate chemical modifier (NH4H2PO4) enables thermal stabilization as good as the one observed with the universal chemical modifier with the advantage of not introducing analyte impurities (in special Pb) when applied into the furnace. The contamination observed by the introduction of Pd/Mg(NO3)2 has been described elsewhere indicating the increasing of background signals.12
Permanent modification using noble metals has also been used for Cd and Pb. In this case, the platform is coated by the thermal re-duction of the noble metal at 400 to 800 oC. Among other advantages, permanent coating eliminates the need for introduction of chemical modifier solutions each time the sample is inserted to perform the analysis and allow insitu purification of the chemical modifier, de-creasing blank signals for elements such as Pb.22
Alternatively, the FF technique may eliminate the use of chemical modification by minimizing the presence of matrix vapor into the analytical zone during the probing of the analyte vapor and by thermal stabilizing the analyte during its diffusion into the porous graphite. The presence of the graphite filter may alter thermal conditions inside the tube and reduces its internal cavity, which increases analyte vapor density in the observation zone. The graphite filter may produce a more favorable environment to stabilize volatile chemical species implicating in lower pre-atomization times, which increases sample throughput and reduces the analysis time. The application of lower temperatures to the outer pyrolytic graphite tube, during atomization step, increases lifetime of the tube.
The effectiveness of the thermal stabilization of the analyte is strongly dependent upon the sample matrix composition, therefore, the absorption signal profile of Cd and Pb in function of the pre-atomization and pre-atomization temperature were studied in order to compare the efficiency of the FF against the platform technique and
to identify differences between signals from the alcohol and from the aqueous matrices, which can indicate the best calibration strategy to be applied. For platform atomization, the (NH4)H2PO4 chemical modifier was used since it allows lower blank signals for Pb, when compared to Pd/Mg(NO3)2, and thermal stabilization comparable to the one achieved with permanent modifiers based, for instance, on the deposition of Ru.12
For aqueous solutions, it can be observed in Figure 2 that better thermal stabilization is achieved by the use of FF technique with maximum applied pyrolysis temperatures of 1300 oC and 1600 oC respectively for Cd and Pb. These pyrolysis temperatures are higher than the ones observed using the pyrolytic platform and chemical modification (800 oC for Cd and 900 oC for Pb). Atomi-zation curves were then constructed in function of the maximum pyrolysis temperatures. The best atomization temperatures are also dependent upon the technique employed. For FF technique best atomization temperatures are observed at 1800 oC for Cd and 2000 oC for Pb, which are considerable higher than the optimum ones
observed using the STPF conditions. The mentioned temperatures are those applied in the temperature program and the real tempera-tures in the filter furnace, especially in the wall were the sample is deposited, may be different (probably lower), considering that the temperature calibration is made for a conventional graphite tube. On the other hand, in terms of integrated absorbance, better results (up to 40% higher) are achieved by using the STPF conditions. Although the analyte signal is less intense using the FF technique,
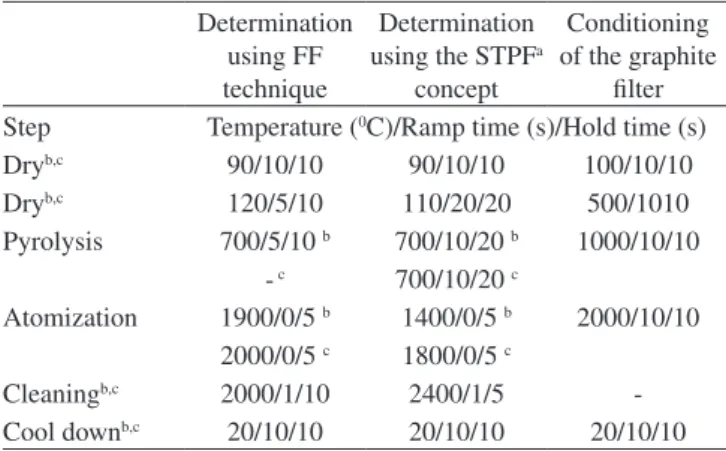
Table 1. Furnace heating programs employed
Determination using FF technique
Determination using the STPFa
concept
Conditioning of the graphite
filter Step Temperature (0C)/Ramp time (s)/Hold time (s)
Dryb,c 90/10/10 90/10/10 100/10/10
Dryb,c 120/5/10 110/20/20 500/1010
Pyrolysis 700/5/10 b 700/10/20 b 1000/10/10
- c 700/10/20 c
Atomization 1900/0/5 b 1400/0/5 b 2000/10/10
2000/0/5 c 1800/0/5 c
Cleaningb,c 2000/1/10 2400/1/5
-Cool downb,c 20/10/10 20/10/10 20/10/10
a(NH
4)H2PO4 chemical modifier.
bTemperature (0C)/Ramp time (s)/ Hold time (s) for Cd. cTemperature (0C)/Ramp time (s)/Hold time (s) for Pb. Argon flow: 250 mL min-1, except during the atomization step (stop flow).
Figure 2. Atomization and pyrolysis curves for 10 pg Cd or 50 pg Pb in ()
it is interesting to notice that such comparison was made using the same sample volume (10 µL). The FF technique allows the use of up to 60 µL of sample,23 which can easily compensate such difference in signal.
When FF technique is applied for both alcohol and aqueous matri-ces, the same profiles for the pyrolysis and for the atomization curves are observed and higher thermal stabilities for both analytes were achie-ved, compared to the platform tube with modifier. However, there was a significant difference between analyte signal intensities from these two matrices. For Cd, integrate absorbance from ethanol was about 20% higher than the one observed from water. It could be explained by the different surface tension of the two media (H2O: 71.99 mN m-1; ethanol: 21.97 mN m-1)24 that could be responsible for a higher per-meation of ethanolic solutions into the graphite, compared to aqueous solutions. Surprisingly, the inverse situation was observed for Pb, where integrated absorbance of the analyte measured from water was higher than the one from ethanol. This suggests that the interactions between the analyte and the graphite present higher influence than the media on the diffusion of the analyte through the filter. These results indicated that a matrix matching, by the preparation of calibration standards in analytical grade ethanol, is required to construct the analytical curve used for quantification of Cd and Pb.
Optimization of the method and figures of merit
Analysis of certified water samples
The performance of the filter furnace was evaluated by the analy-sis of four water samples certified for Cd and Pb. Analyte aqueous standards were used to construct analytical curves. The calibration curves concentrations were between 0.6 and 3.0 µg L -1 for Cd and 5 and 25 µg L -1 for Pb. Samples were diluted and acidified with 1% nitric acid for final concentrations in the calibration curves ranges. In this case, a 700 oC pyrolysis temperature was employed for both analytes. For comparison purposes these determinations were also performed according to the STPF concept, using (NH4)H2PO4 che-mical modifier and the heating program shown in Table 1. Recovery results (Table 2) indicated that a satisfactory accuracy was achieved by using the optimized FF conditions in the analysis of water sam-ples (recoveries between 86.8 and 115% for Cd and between 91.9 and 103.2% for Pb). When the proposed method and the traditional STPF based method were compared, the determination results were very similar for three of the four samples.
Analysis of fuel ethanol samples
Since ethanol is a relatively simple matrix, an effort has been made aiming the minimization or even elimination the pyrolysis step of the heating program using FF technique. For Cd, the background over
this wavelength was very high and not corrected without pyrolysis temperature. This means that concomitant components of the matrix can also diffuse through the graphite filter. Applying a relatively low pyrolysis temperature (700 oC), the background was reduced and effectively corrected, leading to accurate recovery results. In the case of Pb, although some background signal (BG) was observed without pyrolysis temperature, it was separate in time from the analyte signal (AA) and could be eliminated by applying a read delay, making pos-sible the suppression of the pyrolysis step. The absorbance pulses can be observed in Figure 3 and Figure 4 respectively for Cd and for Pb. In Table 1, the optimized heating programs are indicated.
Analytical curves of Cd and Pb were prepared directly in acidified ethanol solutions (90% v/v ethanol + 10% v/v nitric acid solution (4 mol L-1)). For the fuel ethanol samples analysis, the analytical curves from the limit of quantification up to 2.0 µg L-1 for Cd and 2.5 µg L-1 for Pb were employed (correlation coefficients of 0.9975 for Cd and 0.9996 for Pb). Limits of detection (LOD = 3 sdblank (n=10) / slope of the calibration curve) and quantification (3.3 x LOD) were estimated to be respectively 0.1 and 0.3 µg L-1 for Cd and 0.3 and 0.9 µg L-1 for Pb. Repeatability studies at the 1 µg L-1 concentration level have indicated a relative standard deviation (5 consecutive measurements) of around 3% for both analytes.
Determination of Cd and Pb in ethanol fuel
Since there is no ethanol samples certified for Cd and Pb, the method was evaluated by recovery tests using nine commercial alcohol fuel samples: seven common fuel ethanol (C1 to C7), one
Figure 3. Signals of 10 pg Cd in ethanol without the pyrolysis step (A) and
with 700 oC pyrolysis temperature (B), by filter furnace atomic absorption spectrometry
Figure 4. Signals of 50 pg Pb in ethanol without the pyrolysis step (A) and
with 700 oC pyrolysis temperature (B), by filter furnace atomic absorption spectrometry
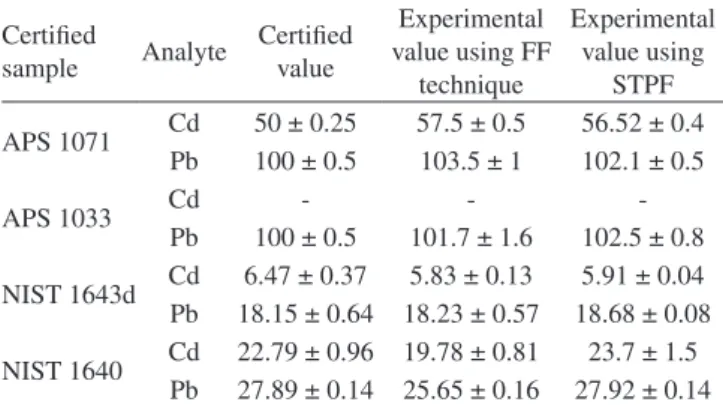
Table 2. Accuracy tests using certified samples. Concentrations in mg L-1 for the APS samples and in µg L-1 for the NIST samples. n = 3
Certified
sample Analyte
Certified value
Experimental value using FF
technique
Experimental value using
STPF
APS 1071 Cd 50 ± 0.25 57.5 ± 0.5 56.52 ± 0.4
Pb 100 ± 0.5 103.5 ± 1 102.1 ± 0.5
APS 1033 Cd - -
-Pb 100 ± 0.5 101.7 ± 1.6 102.5 ± 0.8
NIST 1643d Cd 6.47 ± 0.37 5.83 ± 0.13 5.91 ± 0.04 Pb 18.15 ± 0.64 18.23 ± 0.57 18.68 ± 0.08
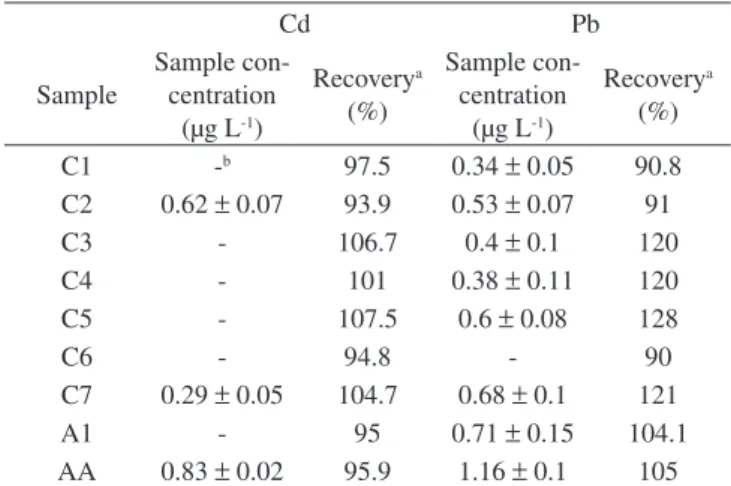
fuel ethanol with addictive (A1) and one anhydrous fuel ethanol (AA). All samples were spiked with standard solutions of Cd and Pb in order to obtain a 1 µg L-1 final analyte concentration. Uns-piked aliquots of these alcohol samples were used as blanks. The recovery results, Table 3, indicated the good performance of the method especially for Cd (recoveries between 93.9 and 106.7%). For Pb, a higher dispersion from the reference value was observed (recoveries between 90 and 128%), however, these results can still be considered satisfactory taking into consideration the low concentration level measured and variations in Pb signals observed from the unspiked samples.
CONCLUSIONS
An FF AAS method for the determination of Cd and Pb in alcohol fuel samples was developed. The use of the FF technique allowed thermal stabilization of the analytes without the need for chemical modification, which implied in the simplification of the procedure and the minimization of contamination of the furnace with analytes from chemical modifier solutions and minimization of costs associated to the analysis. The addition of nitric acid was the only procedure for preparation of fuel samples. A matrix matching was necessary in order to use calibration procedure, and therefore, calibration standards were prepared in ethanol solutions. Sensitivity and repeatability of the results were found to be appropriate. The accuracy of the method was checked by using of standard reference samples. Recovery tests in analyte spiked commercial alcohol samples were made and satis-factory results were obtained. This approach provides a sensitive and simple way to determine Cd and Pb in alcohol samples without the need for pre-concentration and elaborate sample preparation.
ACKNOWLEDGEMENTS
The authors thank Conselho Nacional de Desenvolvimento Cientifico e Tecnologico (CNPq, Brazil) for financial support and scholarships. R.Q. Aucélio thanks FAPERJ and FINEP for scientific support.
REFERENCES
1. Bashir, S.; Lee, S.; Fuel Sci. Techn. Int. 1994, 12, 1427.
2. Wheals, A. E.; Basso, L. C.; Alves, D. M. G.; Amorim, H. V.; Trends Biotechnol. 1999, 17, 482.
3. Rosillo-Calle, F.; Cortez, L. A. B.; Biomass. Bioenerg. 1998, 14, 77. 4. Oliveira, M. E. D.; Vaughan, B. E.; Rykiel Jr. E. J.; BioScience2005, 55,
593.
5. Agência Nacional do Petróleo, Technical Report2000, 1, 45. 6. Kildahl, B. T.; Lund, W.; Fresenius J. Anal. Chem. 1996, 345, 93. 7. Munoz, R. A. A.; Richter, E. M.; de Jesus, D. P.; do Lago, J. C.; Angnes,
L.; J. Braz. Chem. Soc.1998, 9, 494.
8. Gomes, L. A. M.; Padilha, P. M.; Moreira, J. C.; Dias-Filho, N. L.; Gushiken, Y.; J. Braz. Chem. Soc.2004, 15, 523.
9. Padilha, P. M.; Padilha, C. C. F.; Rocha, J. C.; Quim. Anal.1999, 18, 299.
10. da Silva, E. L.; Budziak, D.; Carasek, E.; Anal. Lett. 2004, 37, 1909. 11. Oliveira, A. P.; Moraes, M.; Gomes Neto, J. A.; Lima, E. C.; At.
Spectrosc. 2002, 23, 39.
12. Saint’Pierre, T. D.; Aucélio, R. Q.; Curtius, A. J.; Microchem J.2003, 75, 59.
13. Katskov, D. A.; McCrindle, R. I.; Schwarzer, R.; Marais, P. J. J. G.; Spectrochim. Acta, Part B1995, 50, 1543.
14. Katskov, D. A.; Schwarzer, R.; Marais, P. J. J. G.; McCrindle, R. I.; J. Anal. At. Spectrom. 1994, 9, 431.
15. Wolfe, J. R.; McKenzie, D. R.; Borg, R. J.; J. Appl. Phys. 1964, 36, 1906.
16. Aucélio, R. Q.; Smith, B. W.; Winefordner, J. D.; Anal. Sci. 1999, 15, 321.
17. Ngobeni, P.; Canario, C.; Katskov, D. A.; Thomassen, Y.; J. Anal. At. Spectrom. 2003, 18, 762.
18. Canario, C.; Ngobeni, P.; Katskov, D. A.; Thomassen, Y.; J. Anal. At. Spectrom. 2004, 19, 1468.
19. Bileni, M.; Ngobeni, P.; Katskov, D. A.; Panichev. N.; J. Anal. At. Spectrom. 2002, 19, 236.
20. Welz, B.; Schlemmer, G.; Mudakavi, J. R.; J. Anal. At. Spectrom.1992, 7, 1257.
21. Slavin, W.; Graphite Furnace AAS: A Source Book, 2nd ed., Perkin-Elmer Corp.: Ridgefield, 1991.
22. Silva, J. B. B.; da Silva, M. A.; Curtius, A. J.; Welz, B.; J. Anal. At. Spectrom. 1999, 14, 1737.
23. Katskov, D. A.; Marais, P. J. J. G.; McCrindle, R. I.; Spectrochim. Acta, Part B1996, 51, 1291.
24. CRC Handbook of Chemistry and Physics, 75th ed., CRC Press, Inc.: Boca Raton, 1995.
Table 3. Recovery tests and measured concentrations of Cd and Pb in commercial alcohol samples
Cd Pb
Sample
Sample con-centration
(µg L-1)
Recoverya (%)
Sample con-centration
(µg L-1)
Recoverya (%)
C1 -b 97.5 0.34 ± 0.05 90.8
C2 0.62 ± 0.07 93.9 0.53 ± 0.07 91
C3 - 106.7 0.4 ± 0.1 120
C4 - 101 0.38 ± 0.11 120
C5 - 107.5 0.6 ± 0.08 128
C6 - 94.8 - 90
C7 0.29 ± 0.05 104.7 0.68 ± 0.1 121
A1 - 95 0.71 ± 0.15 104.1
AA 0.83 ± 0.02 95.9 1.16 ± 0.1 105