Inequities in access to and use of drinking water
services in Latin America and the Caribbean
Luiz Carlos Rangel Soares,
1Marilena O. Griesinger,
2J. Norberto W. Dachs,
3Marta A. Bittner,
4and Sonia Tavares
5Objective. To identify and evaluate inequities in access to drinking water services as re-flected in household per capita expenditure on water, and to determine what proportion of household expenditures is spent on water in 11 countries of Latin America and the Caribbean.
Methods. Using data from multi-purpose household surveys (such as the Living Standards Measurement Survey Study) conducted in 11 countries from 1995 to 1999, the availability of drinking water as well as total and per capita household expenditures on drinking water were analyzed in light of socioeconomic parameters, such as urban vs. rural setting, household in-come, type and regularity of water supply service, time spent obtaining water in homes not served by running water, and type of water-purifying treatment, if any.
Results. Access to drinking water as well as total and per capita household expenditures on drinking water show an association with household income, economic conditions of the house-hold, and location. The access of the rural population to drinking water services is much more restricted than that of the urban population for groups having similar income. The proportion of families having a household water supply system is comparable in the higher-income rural population and the lower-income urban population. Families without a household water sup-ply system spend a considerable amount of time getting water. For poorer families, this implies additional costs. Low-income families that lack a household water supply spend as much money on water as do families with better income. Access to household water disinfection methods is very limited among poor families due to its relatively high cost, which results in poorer drinking water quality in the lower-income population.
Conclusions. Multi-purpose household surveys conducted from the consumer’s point of view are important tools for research on equity and health, especially when studying unequal access to, use of, and expenditures on drinking water. It is recommended that countries im-prove their portion of the surveys that deals with water and sanitation in order to facilitate na-tional health assessments and the establishment of more equitable subsidy programs.
Drinking water, water supply, water and health, water and development, Latin America.
ABSTRACT
Inequity is a term that describes dif-ferences that are unjust, unnecessary, and avoidable. Every person should have access to all the sanitary and so-cial services that are necessary to pro-tect, promote, and maintain or recover his health (1). Inequity, insofar as it Key words
1 Division of Health and Environment (HEP),
Pro-gram of Basic Sanitation (HES), Pan American Health Organization, Washington, D.C., United States of America.
2 Institute of Geography, Universidade Federal
de Uberlândia, Minas Gerais, Brazil (e-mail: [email protected]).
3 Division of Health and Human Development
(HDD), Public Policy and Health Program (HDP),
Pan American Health Organization, Washington, D.C., United States of America.
4 Division of Health and Environment (HEP),
Pro-gram of Basic Sanitation (HES), Pan American Health Organization, Washington, D.C., United States of America.
5 Environment and Health Adviser, PAHO/WHO
implies unfair differences in access to services or opportunities, is a hin-drance to the global plan of action launched at the United Nations Con-ference on Environment and Develop-ment, which was held in Rio de Janeiro, Brazil, in June 1992. In order to attain sustainable development, a strategy aimed at safeguarding the well-being of present as well as future generations, it is imperative that any issue concerning health be addressed with due attention to equity—univer-sal access to drinking water at a fair cost, as well as to good sanitation, hous-ing, education, etc.
The Global Conference on Drinking Water and Sanitation that was pro-moted and coordinated by the World Health Organization (WHO) in New Delhi, India, in 1991, stressed the im-portance of universal access to safe drinking water supplies in sufficient quantities by the year 2000. Equity in access to safe drinking water is one of the most important indicators of so-cioeconomic development (2).
In its document entitled “Policy for Health for All”, WHO ranked equity in health as the second of 38 targets: “By the year 2020, the health gap be-tween socioeconomic groups within countries should be reduced by at least one-fourth in all Member States, by substantially improving the level of health of disadvantaged groups” (1).
The Pan American Health Organiza-tion (PAHO) considers access to safe drinking water and sanitation services one of the fundamental determinants of health. Since the 1950s, PAHO has carried out assessments of drinking water supplies and sanitation services in the Region of the Americas every 5 years. These assessments have been an important basis for health sector poli-cies and actions at the global, regional, and national levels.
With the arrival of the end of the mil-lennium, PAHO carried out a more ex-tensive assessment of drinking water services and sanitation in the Americas and published the results in a docu-ment entitled Regional report on the Eval-uation 2000 in the Region of the Americas: water supply and sanitation, current sta-tus and prospects(2). Evaluation 2000 is
an instrument that was created to help countries diagnose their strengths and weaknesses in terms of drinking water and sanitation services, as well as the quality of such services.6
One innovative aspect of Evaluation 2000 was that each Member State pre-pared an analytical report provid-ing an overall national profile of the health sector. At the time these na-tional reports were drawn up, PAHO requested that all countries include an evaluation of access to and use of water supply services from the point of view of equity. However, the data-base for Evaluation 2000 does not have this kind of information, since the data are provided by private and/ or governmental water service pro-viders, and not by the population tar-geted by these services. Besides, na-tional averages often conceal the presence of great disparities in access to and utilization of services, as well as in per capita expenditures on drinking water.
Increasingly aware of the need to in-vestigate the population’s demand for drinking water supply services in order to complement the information given by drinking water service pro-viders, PAHO conducted an original study that focused specifically on ac-cess to, use of, and expenditures con-nected with drinking water supply services in 11 countries of Latin Amer-ica and the Caribbean (LAC). Since access to safe drinking water is a de-terminant of human health and well-being (3), the results of this assessment can help governments identify prob-lems, establish priorities, and incorpo-rate them in official plans at national, sub-regional and regional levels.
MATERIALS AND METHODS
Data on drinking water services sel-dom include aspects that deal with ex-isting inequalities in the distribution of or access to drinking water supply
ser-vices. Information obtained from of-ficial government sources or private water service providers rarely covers distribution of services by geographical region, or family income, family expen-ditures, or other socioeconomic vari-ables. An alternative source of data that permits a more detailed analysis are the multi-purpose household surveys (sim-ilar to the Living Standards Measure-ment Surveys, or LSMS), which are usually designed to study the quality of life of a given population.
While Evaluation 2000 was being carried out, PAHO’s Division of Health and Human Development’s Program on Public Policy and Health (HDP/ HDD), together with the Division of Health and Environment’s Program of Basic Sanitation (HEP/HES), con-ducted a study of household surveys in 11 countries in Latin America and the Caribbean in an effort to identify and examine inequalities in access to, use of, and expenditures on drinking water supply services. The study was developed with the support of the PAHO/WHO Representative Office in Peru and was carried out in the following 11 countries: Bolivia, Brazil, Chile, Colombia, Ecuador, El Sal-vador, Jamaica, Nicaragua, Panama, Paraguay, and Peru.
The criterion for selecting the coun-tries included in the study was the availability of household survey data for the period from 1995 to 1999. Al-though these surveys focus mainly on household income and expenditures, they also include modules on educa-tion, health, and employment, among others. From the module on living conditions it is possible to get informa-tion about water supply, basic sanita-tion, and solid waste disposal. A num-ber of variables shed light on living standards in a country and how they relate to the availability of safe drink-ing water supply services: how much a household spends on drinking water, characteristics of the household (type of building, number of rooms, number of dwellers, presence or absence of electricity), urban vs. rural setting, name of municipality or other geo-graphical subdivision, type and regu-larity of water supply, time spent on 6 All the data obtained from PAHO’s Member States
getting water in homes not served by running water, type of water treat-ment, total and per capita household expenditures or income, etc.
The surveys also provide informa-tion on access to water supply services under different household conditions: in households having safe drinking water, with or without piping; in households without piped water but with access to collective water distri-bution systems or community sources such as public springs, private or com-munity wells, or public wash basins; and in households without any type of water supply. Thus, information on drinking water supply systems is pre-sented in conjunction with socioeco-nomic variables.
In addition, household surveys fo-cus on demand for water supply ser-vices as viewed from the perspective of the population using or lacking such services. In this way, they com-plement the information provided in Evaluation 2000 and contribute valu-able data on inequalities in access to, use of and expenditures on water at the household level.
The 11-country study, the data on drinking water services, and the analy-ses conducted in each country resulted in a consolidated report on inequali-ties in access to, use of and expen-ditures on drinking water that was presented during the Regional Sympo-sium on Drinking Water and Sanita-tion just prior to the Inter-American Association of Sanitary and Environ-mental Engineering (AIDIS) Congress in Porto Alegre, Brazil, in December 2000.7
The information gathered in the 11 countries and subsequently analyzed is not restricted to the coverage of drinking water and sanitation ser-vices. It also deals with various types of technology, prospects for the devel-opment of the water supply sector, quality and efficiency of water supply services, health implications of such services, and public vs. private sys-tems in service delivery. It also
in-cludes other relevant information, such as water supply services in met-ropolitan areas, particularly low-income inner-city pockets.
The objective of this study is to iden-tify and assess access to safe drinking water in light of per capita spending on water at the household level, and to determine the proportion of total household expenditures that is com-prised by water in 11 countries of Latin America and the Caribbean. Ex-isting inequities in access to, use of, and spending on drinking water ser-vices in the 11 countries surveyed are seen as a factor that impacts on human health and well-being.
USE OF AND ACCESS TO DRINKING WATER SERVICES
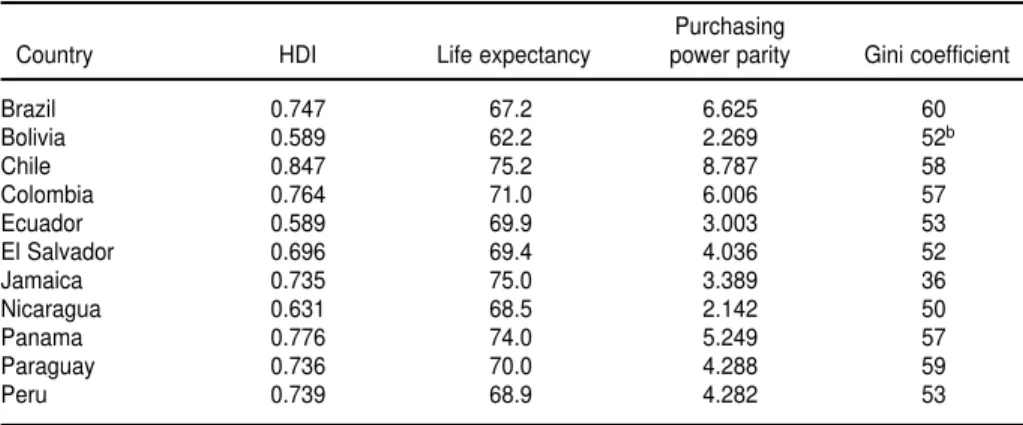
The Latin American and Caribbean Region, which is generally recognized as having the greatest economic in-equalities in the world, includes coun-tries with a wide range of social, eco-nomic, and health conditions. The Human Development Index (HDI) re-flects the status of a country in terms of three basic human endeavors: to live a long life, to attain knowledge, and to enjoy a decent living standard. Three variables have been chosen as their corresponding indicators: life ex-pectancy at birth, educational level,
and income. The HDI makes it possi-ble to compare different countries in terms of development, and the gap be-tween a given country’s index and the highest possible index that it could attain indicates the distance it has to travel to achieve development. These HDI development variables, purchase power parity (PPP), and the income in-equalities measured by the GINI coef-ficient for the 11 countries surveyed are shown in Table 1.
Over the past 50 years, the Region has practically doubled its population, which rose from less than 400 million inhabitants in 1950 to 790 million at the end of 1998 and to more than 800 mil-lion in 2000. Latin America and the Caribbean have a combined total of 497 million inhabitants. The entire popula-tion of the 11 countries surveyed is ap-proximately 284 million inhabitants, so that the household surveys represent over 50% of the population of Latin America and the Caribbean.
Access to drinking water has been classified according to three main pop-ulation categories:
• Populations with a household supply, when piped water is installed within the residence or in a private lot, regardless of the source or method of extraction;
• Populations having easy access to water,when there is no household 7 The reports from each participating country, as
well as the original tables and analyses, are also available on the CEPIS Web page.
TABLE 1. Development indicators for selected countries of Latin America and the Caribbeana
Purchasing
Country HDI Life expectancy power parity Gini coefficient
Brazil 0.747 67.2 6.625 60
Bolivia 0.589 62.2 2.269 52b
Chile 0.847 75.2 8.787 58
Colombia 0.764 71.0 6.006 57
Ecuador 0.589 69.9 3.003 53
El Salvador 0.696 69.4 4.036 52
Jamaica 0.735 75.0 3.389 36
Nicaragua 0.631 68.5 2.142 50
Panama 0.776 74.0 5.249 57
Paraguay 0.736 70.0 4.288 59
Peru 0.739 68.9 4.282 53
aThe source of the Human Development Index, life expectancy at birth, and per capita income was the United Nations Devel-opment Report for 2000; purchasing power parity and the Gini coefficient were taken from the most recent UNDP basis of in-equalities, always between 1994 and 1998.
connection to a supply of drinking water but there is access to an aver-age of 20 liters of drinking water per person per day from a public source located no more than one kilometer from the home;
• Populations without any water sup-ply, or unserved populations, when the drinking water comes from pri-vate wells, springs, streams, rivers, rainwater deposits, etc.
Of the total population of Latin America and the Caribbean, 73.73% lives in households having a supply of drinking water; 10.86% falls in the category having easy access to drink-ing water, and 15.41% is still not served by any drinking water supply service. The percentage of the popula-tion with a piped household drinking water supply increased from 33% in 1960 to 80% in 1990 and to nearly 85% in 2000 (2).
When data on access to drinking water services from official water providers (supply side) in each of the 11 countries studied (Figure 1) is com-pared to data generated through the household surveys, which represent the users of the services or the demand side of the equation (Table 2), it be-comes clear that the values do not dif-fer widely. Discrepancies in the figures corresponding to “easy access” and “unserved” populations, as seen in Paraguay, can result from differences in the survey questions and in how “household water supply” and “easy access” were interpreted in the various surveys. With the exception of Colom-bia, the information provided by water supply companies tends to over-estimate the percentage of the popula-tion with access to drinking water.
Despite similarities and differences in the data provided by both sources, these figures still conceal
inequali-ties in access to and use of drinking water under different socioeconomic conditions.
Inequalities between urban and rural populations
As a result of the continuous move-ment of the rural population toward the cities, the urban population has been much larger than the rural popu-lation since the latter 1990s. In 1998, 73% of the population (575.4 million people) lived in urban areas, and 27% (equivalent to 214.6 million inhabitants) lived in rural areas (Figure 2). Unfortu-nately, not all those who moved from rural areas to the cities have achieved an improvement in their quality of life. Access to drinking water systems varies significantly when urban and rural populations are compared. Poor urban areas, such as slums and shan-FIGURE 1. Percentage of the total population with access to drinking water supply services (providers’ perspective) in selected countries of Latin America and the Caribbean
Percentage Total population
Household supply Easy access No access
0 10 20 30 40 50 60 70 80 90 100
Jamaica Paraguay El Salvador Peru
Nicaragua Ecuador Bolivia Colombia Brazil Panama Chile
38.32 42.19
52.02 54.01
61.35 63.89
64.60 75.16
42.20
14.07 6.37
8.86
15.45 4.84
6.33
19.48 56.38
40.64 33.50
24.58 29.73
26.54
9.39 10.99 13.15
5.82
75.28 82.00 87.85
13.74
12.49
7.33
1.43
tytowns, exist in most large and medium-size cities in Latin America. These poor neighborhoods, which are inhabited mainly by people who came from rural areas, have grown rapidly. They first sprouted and spread in the suburbs and later in the larger towns and cities, creating complex social, economic and health problems. Drink-ing water supply and adequate sanita-tion services are among the main prob-lems in these economically deprived areas: the costs of services are not re-covered, which results in their
defi-cient operation and in poor systems maintenance, leading to the most seri-ous setback, which is a reluctance to invest in rural areas. Governmental resources usually go to urban popula-tions who are better represented at the political and decision-making levels than the rural population.
Despite progress in the supply of drinking water services in Latin Amer-ica and the Caribbean, there is still great disparity between urban and rural populations. Only 37.64% of the total rural population has access to
drinking water within the home, com-pared to 86.7% of the urban popula-tion. The population not served by water supply services is much higher in rural areas (38.78%) than in urban areas (7.02%). Of the rural population, 23.58% has “easy access” to drinking water, compared to 6.28% of the urban population. The urban population without any water supply service is estimated at 26 million, compared to 51 million in rural areas (2).
In some countries having good water supply services in urban areas, as in Bolivia, Brazil, Chile, El Salvador, Nicaragua and Panama, coverage in rural areas is quite low (Figures 3 and 4). This means special attention must be paid to these areas when prioritiz-ing policies and creatprioritiz-ing or strength-ening special subsidy programs and mechanisms.
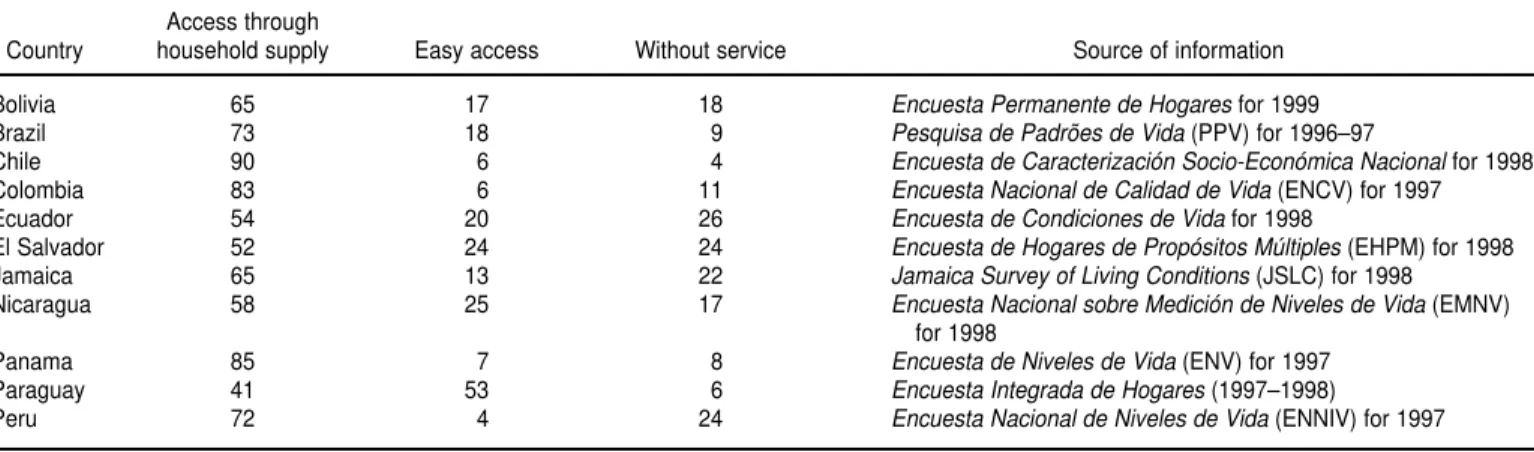
Let’s take the example of Chile, where 99% of the population in urban areas has a source of drinking water in the home as compared to only 36% of the population living in rural areas. In Chile, 39% of the population belongs in the “easy access” category, and 25% is not served. In Colombia, 97% of the urban population has a household water supply, but in rural areas the percentage drops to 77% on average, and to only 30% in certain remote places. The urban population lacking any supply service is 2%, while 46% of the population living in scattered rural TABLE 2. Access to drinking water supply services according to multi-purpose household surveys (demand perspective) in selected coun-tries of Latin America and the Caribbean
Access through
Country household supply Easy access Without service Source of information
Bolivia 65 17 18 Encuesta Permanente de Hogaresfor 1999
Brazil 73 18 9 Pesquisa de Padrões de Vida(PPV) for 1996–97
Chile 90 6 4 Encuesta de Caracterización Socio-Económica Nacionalfor 1998
Colombia 83 6 11 Encuesta Nacional de Calidad de Vida(ENCV) for 1997
Ecuador 54 20 26 Encuesta de Condiciones de Vidafor 1998
El Salvador 52 24 24 Encuesta de Hogares de Propósitos Múltiples(EHPM) for 1998
Jamaica 65 13 22 Jamaica Survey of Living Conditions(JSLC) for 1998
Nicaragua 58 25 17 Encuesta Nacional sobre Medición de Niveles de Vida(EMNV)
for 1998
Panama 85 7 8 Encuesta de Niveles de Vida(ENV) for 1997
Paraguay 41 53 6 Encuesta Integrada de Hogares(1997–1998)
Peru 72 4 24 Encuesta Nacional de Niveles de Vida(ENNIV) for 1997
FIGURE 2. Growth of the urban and rural population
0 100 000 000 200 000 000 300 000 000 400 000 000 500 000 000 600 000 000
1950
Population
1960 1970
Year
1980 1990 1998
Urban population Rural population Total population
areas has no access to water supply services of any type.
In general, economists prefer to measure a household’s economic sta-tus by using expenditure instead of in-come as an indicator. This is because there are many difficulties inherent in measuring income—imputation, recall bias, seasonality, long questionnaires—, even more so than when measuring consumption, and a host of additional issues arise (3). Most important of all, perhaps, is the fact that in the case of households whose income is derived from agriculture or a family business, which are quite numerous, personal and business inputs and outputs are difficult to separate (3). Furthermore, instead of total family expenditure, household “expenditure per capita” was utilized as a better indicator of wealth, since it controls for the effect of family size.
The rural and urban populations were grouped separately in terms of economic status according to house-hold expenditure per capita. If the pop-ulation of the entire country had been used, the very small number of people in rural areas belonging to the upper deciles would have resulted in a bias in favor of the urban areas. When urban populations are compared with rural populations, it becomes clear that for households falling in the same expen-diture category, the former invariably have better access to drinking water than the latter. On the other hand, when the percentage of households having piped water in the four poorest deciles of the population is compared to that in the top decile, it becomes clear that the greatest inequalities are found in a few scattered rural areas and that they are less marked in urban areas and in rural villages.
Expenditures in households having drinking water
Data from the multi-purpose house-hold surveys made it possible to com-bine information on access to public water supply services and per capita expenditures on drinking water at the household level, on the one hand, with variables such as socioeconomic status (grouped in deciles) and household per capita income in rural and urban areas on the other.
Table 3 shows the percentage of households with a piped water sup-ply in the deciles having the low-est and highlow-est household expendi-tures per capita and in the whole population, as well as the percent-age of total household expenditures that is comprised by drinking water among the same deciles and the entire population.
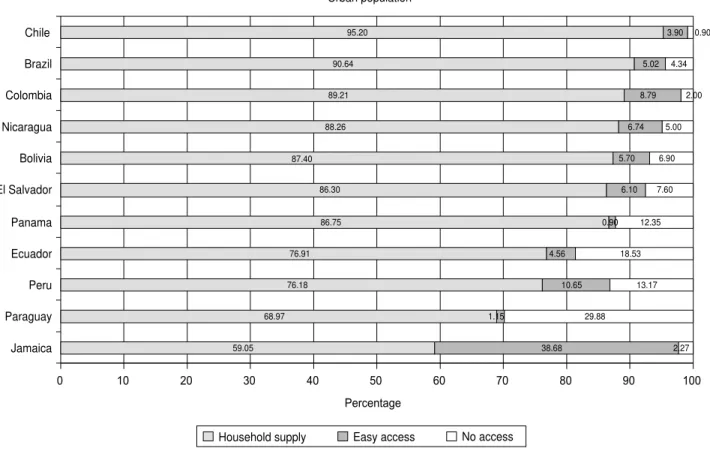
FIGURE 3. Percentage of the urban population with access to drinking water supply services in selected countries of Latin Amer-ica and the Caribbean
0 10 20 30 40 50
Percentage Urban population
60 70 80 90 100
Jamaica Paraguay Peru Ecuador Panama El Salvador Bolivia Nicaragua Colombia Brazil Chile
59.05 68.97
76.18 76.91
86.75 86.30 88.26
89.21 90.64
95.20
38.68 1.15
10.65 4.56
0.90 6.10 5.70 6.74
8.79 5.02
3.90
2.27 29.88
13.17 18.53
12.35 7.60
6.90 5.00
2.00 4.34
0.90
87.40
Household supply Easy access No access
Panama and El Salvador are the only countries where the percentage of households having a piped water sup-ply in the top rural economic decile (92.8 and 39.6%, respectively) is higher than in the poorest urban decile (84 and 39.3%, respectively). In all the other countries, the percentage of households with piped water is invari-ably higher in urban areas for all household expenditure deciles and in-creases along with economic status. In Bolivia, Chile, Colombia, Jamaica, and Panama, the percentage of households having a piped water supply varies from over 80% of households compris-ing the lowest 10% in per capita ex-penditure to nearly 100% of those hav-ing the highest expenditure per capita, indicating there is little inequity in ac-cess to drinking water in urban areas. The other six countries show marked
inequities. In Paraguay they range from 35 to 87.7%, and in Brazil from 53.5% to 97.3%. The percentage of households with a piped water supply in rural areas is always lower than in urban areas, but inequalities among dif-ferent socioeconomic strata are smaller than in the cities.
Per capita expenditure on drinking water, and as a percentage of total household expenditures, is also pre-sented in Table 3 for 10 of the 11 countries (the Chilean survey fails to provide this type of information). Ex-penditures on water are closely related to family income and per capita expen-ditures in all countries included in the study, with the exception of Jamaica, where per capita expenditure on drink-ing water is always approximately twice what it is in countries with com-parable levels of income per capita.
In the countries examined in this study, the amount spent on water con-sumption per family ranges from 0.1% of total household expenditures in remote rural areas in Panama to 6.5% in Kingston, Jamaica. Like access to drinking water, expenditure on water differs more widely in urban areas. It is important to note that spending less on water does not always result from water being cheaper; rather, in most instances it is an indicator that there is a lack of services. Per capita expendi-ture on water is lowest in rural popu-lations that are widely scattered and difficult to reach and among indige-nous populations.
In Kingston, Jamaica, per capita ex-penditure on water in the poorest 10% of the population is not only the high-est among all 11 countries, but also more than four times higher than the FIGURE 4. Percentage of the rural population with access to drinking water supply services in selected countries of Latin Amer-ica and the Caribbean
11.08 12.88
14.43 16.70
19.66 29.20
30.41 41.69 42.00 45.29
76.15
1.76
46.51 19.13
8.60
45.31 21.47 13.5
31.31 9.43
20.39
9.70
87.16
40.61 66.44
74.70
35.03 49.33 56.01
27.00 48.57
34.32
14.15
0 10 20 30 40 50 60 70 80 90 100
Paraguay Jamaica Nicaragua El Salvador Brazil Peru Bolivia Colombia Ecuador Chile Panama
Percentage Rural population
Household supply Easy access No access
percentage spent on water by the upper class. In Brazil, urban and rural populations in the lowest income brackets spend proportionally two times more on water than the most af-fluent sector of the population.
A strong association was found be-tween expenditure on water and fam-ily income: the richest families spend more on water in absolute terms than poorer families, yet the proportion of total family income that is allocated to water consumption is much higher among the latter. This is true in both urban and rural areas, and the discrep-ancy is even greater in the cities. If we also take into account that, on average, poorer families receive water of lesser quality from sources that are difficult to reach and that they must spend time
getting the water, the proportion of household expenditures that goes to obtaining water is even greater among poorer population groups.
Quality of water supply services
There is a well-established correla-tion between the coverage and quality of drinking water supply services, san-itation, health, and quality of life. Ex-perience indicates that water-borne epidemics tend to disappear more quickly in places with good sanitation and where the quality of the drinking water supply is guaranteed.
In light of the fact that 77 million people are still not served by water supply services in Latin America and
the Caribbean, there is a potential risk that people will consume polluted or unsafe drinking water. This is in addi-tion to the fact that the quality of drinking water services provided to the population differs not only in urban vs. rural areas, but also among different regions within a single coun-try, among different socioeconomic strata and sometimes among different ethnic groups.
It is estimated that in Latin America and the Caribbean, 60% of the popula-tion—more than 219 million people— having a household supply of drink-ing water is served by hydraulic systems that work sporadically. In ad-dition, factors such as inefficient treat-ment plants, poor water disinfection or its lack, precarious distribution net-TABLE 3. Percentage of households with water supply services and percentage of total household expenditure that goes to getting drink-ing water in selected countries of Latin America and the Caribbean
Percentage of households with water supply Percentage of total household expenditure on in the lowest and highest deciles of total expenditure drinking water for the lowest and highest deciles of total
per capita and in the entire population expenditure per capita and in the entire population
1st decile 10th decile 1st decile 10th decile
Country (low income) (high income) Total (low income) (high income) Total
Bolivia Urban 82.1 98.1 90.6 2.5 1.8 1.9
Rural 14.3 41.5 23.0 1.3 0.6 0.9
Brazil Urban 53.5 97.3 89.6 3.4 1.2 2.3
Rural 2.6 32.3 19.3 3.9 1.3 1.9
Chile Urban 96.8 99.7 98.8
Rural 27.7 43.1 36.0 NA NA NA
Colombia Urban 91.1 99.2 97.4 3.3 0.9 1.6
Rurala 71.4 91.8 78.2 2.1 0.3 0.8
Ruralb 29.6 41.0 31.2 1.4 0.8 0.7
Ecuador Urban 56.2 90.8 75.3 3.6 1.1 1.9
Rurala 42.3 49.4 46.3 2.3 1.7 1.3
Ruralb 11.2 26.3 18.5 0.9 0.5 0.9
El Salvador Urban 39.3 88.8 70.5 2.8 1.1 1.9
Rural 16.2 39.6 25.5 4.1 1.3 2.6
Jamaica Kingston 95.7 100.0 97.4 6.5 1.5 3.0
Urban 62.7 89.5 79.4 3.8 1.4 2.6
Rural 23.2 54.8 38.8 3.9 2.0 2.8
Nicaragua Urban 58.3 96.4 83.9 2.4 1.0 1.7
Rural 7.3 53.3 30.5 1.9 1.4 1.7
Panama Urban 84.0 100.0 95.4 2.7 1.3 1.9
Rural 55.8 92.8 79.9 1.6 0.7 1.2
Ruralc 16.7 45.5 24.4 0.6 0.1 0.4
Indigenous 39.0 34.4 37.1 0.8 0.4 0.5
Paraguay Urban 35.0 87.7 66.9 1.7 1.1 1.4
Rural 1.8 30.6 13.3 2.3 0.7 1.2
Peru Urban 57.7 97.0 85.0 2.4 1.7 1.9
Rural 35.0 34.4 41.9 1.6 0.8 0.8
works, clandestine and poorly made household pipelines, and faulty house-hold installations all make for poor water quality. Inadequate or insuffi-cient institutional resources, lack of technical expertise, and poor control and surveillance mechanisms also magnify these problems.
Considering that sanitary surveil-lance of water sources is still deficient in most countries included in the study and that there is no certification of drinking water services by local health authorities, there is a latent danger of diarrheal disease and water-borne diseases in general among consumers. These problems are more serious in poor peri-urban pockets, particularly those surrounding large cities of Latin America and the Ca-ribbean whose inhabitants have mi-grated there from rural areas.
After the cholera epidemic that took place in Latin America in 1991, there was significant progress in the disin-fection of water for human consump-tion in urban areas as a result of a regional effort aimed at achieving a disinfection rate of 100%. Rural water supply systems have seen much slower progress for a number of reasons, one of them being the difficulty of deliver-ing disinfectants to remote locations. In some areas this problem has been solved by local production of disinfec-tant solutions through electrolysis of common salt (NaCl). Furthermore, ef-forts have been made to introduce water disinfection at the household level in places without community-level water supply systems or where such systems only work intermittently. Evaluation 2000 reported that 21 countries in the Region of the Ameri-cas have 100% of their urban water supply services disinfected, 15 have disinfection in some of their water sys-tems, 11 countries did not provide in-formation, and one country reported no disinfection of urban water sources at all. It is estimated that 59% of the population of Latin America and the Caribbean receives water that is sub-jected to regular disinfection. In 1995, 23 countries of the Region notified that the majority of their urban population had access to water treated in
accor-dance with WHO guidelines for drink-ing water quality, but this is far from true for rural areas.
The importance of safe drinking water as a determinant of health is undeniable (4). Inequities in access to, utilization of and expenditures on drinking water are closely related to the large economic and social equities that exist in the countries in-cluded in this study. Knowing that such differences and inequalities in water supply exist should lead to the establishment and implementation of policies intended to decrease inequi-ties and to improve the access to safe drinking water for all individuals and families in Latin American and Carib-bean countries.
In countries where it was possible to estimate the regularity of water supply services, these were not always found to be better in higher-income areas. Ir-regularity in water supply seems to be more strongly associated with the nat-ural scarcity of water resources and/ or the deficient operation of water dis-tribution systems than with income. An example of this is the Peruvian coast, where the average family in-come is somewhat higher than that of other regions, but the regularity of water distribution is lower due to a shortage of water.
On the average, Peruvian dwellings with piped water have a limited access of 13 hours daily. However, strong dif-ferences are seen throughout the coun-try: rural areas, as well as mountain and jungle villages, enjoy a more regu-lar water supply than metropolitan Lima and other urban areas along the coast. Urban families have fewer hours of access to water every day than poor rural populations in the mountains and the jungle, where natural avail-ability of water is greater.
When the regularity of water supply services is viewed in light of expendi-ture per capita, families having the lowest and highest per capita expendi-tures (the top and bottom 10%) enjoy more regular water distribution ser-vices than the middle-income strata. In order to understand this better, it is necessary to examine urban and rural areas separately. A greater proportion
of poor families live in rural and agri-cultural areas having a greater avail-ability of water as a natural resource, while the urban middle class tends to live in big cities where water is expen-sive and usually in short supply.
In Panama, households with piped water get service that is pretty regular. The average supply is 21 hours daily for 29 days of the month in most parts of the country, with urban areas far-ing slightly better than rural ones. This may indicate that there is abundant water as a natural resource and an ef-ficient system of water supply.
In Colombia, dwellings with piped water get good, regular service, with slight irregularity in urban areas de-pending on differences in expenditure or income per capita, mainly in urban areas.
Time spent in getting drinking water
In Ecuador, those families that lack a household water supply but that have easy access to water from a nearby source take an average of seven and one half minutes to obtain that water, while those who do not have easy ac-cess to drinking water services take five minutes more, on average. Few surveys have this type of information. Families that have to collect water directly from streams, rivers or canals spend anywhere from one to 15 hours obtaining it. On the other hand, those who have access to a public source out-side the household spend less time get-ting their drinking water. This means that the population pays with time for the lack of investment in bringing water sources closer to the dwellings. Furthermore, this also shows that there is a relationship between the time it takes to obtain water and family in-come, since the lower the inin-come, the more difficult is access to a water source.
areas, the proportion of families with-out a household supply is even higher, which means it takes more time to ob-tain water.
Among families without a house-hold water supply, those who pur-chase water from trucks or carts and those who are supplied by wells spend a greater amount of time getting water. These are families with limited economic resources that, besides lack-ing access to water of good quality, are forced to devote an important propor-tion of their income and productive time to obtaining safe water.
DISCUSSION AND CONCLUSIONS
Over the past several decades, im-portant progress has been made in ex-tending the coverage of water supply services in Latin America and the Ca-ribbean. However, a large percentage of the population still lacks access to such services. Multi-purpose house-hold surveys such as the ones we’ve described can help countries in their ef-forts to reduce inequities. These sur-veys can be powerful political instru-ments by virtue of their usefulness in promoting private and community participation, as well as social mobi-lization, in the search for sustainable solutions within the local social context to the situation facing the most disad-vantaged portions of the population.
Looking at those inequities that cur-rently exist helps in establishing social and technological strategies with a more comprehensive and realistic ap-proach, within a multiple sector per-spective leading to better coordination
between the water and sanitation sec-tor and the areas of planning, health, housing and urban development. De-spite the recent tendency to privati-zation of basic services, examining inequities is a valuable means of ad-dressing the needs of one of the most vulnerable segments of the popula-tion: those who lack access to drinking water.
Inequity analyses derived from the LSMS data or similar surveys can also help guide policy, strengthen legal and institutional frameworks as required, and establish sector investment poli-cies as well as financing options and subsidies that take into account the dif-ferent population strata, prioritizing those that are most disadvantaged and hardest to reach. They can also help identify existing gaps and target ac-tions to reduce them.
Results of the present study indicate that factors determining current in-equities in access to, use of, and ex-penditures on drinking water are gen-erally related to poverty. Inequities in access to safe drinking water are di-rectly related to unequal family expen-ditures for drinking water supply ser-vices: the proportion of families with a household water supply is greater among families having higher per cap-ita expenditures.
When comparing groups with simi-lar income levels, the population liv-ing in rural areas has a smaller pro-portion of households with a piped water supply. Even among the wealth-iest 10% of the rural population, the proportion of dwellings with a house-hold water supply is smaller than in the poorer deciles of the urban
popu-lation. These differences could be ex-plained by the fact that these areas are not prioritized by the water supply programs and in the social and poli-tical agendas, lack of specific sector policies and subsidies, and the higher costs of installing a drinking water supply infrastructure in areas with low population density. However, they can also be the result of the fact that these areas fail to draw the atten-tion of naatten-tional authorities and public investment funds.
At the national level, unequal access to water (household connections) in urban areas is not always related to differences in family income or expen-ditures on water; some cities have a higher percentage of households with an internal water supply, regardless of the average family income. The same can be said of areas where households lack an internal water supply, since the water system as a whole may be deficient.
The time spent in getting water when there is none in the house im-poses additional costs on poor fami-lies. The poorer the families are, the greater are the distance they must travel and the time they must spend getting water, and the more limited their access to public services.
In view of the importance of utiliz-ing this type of survey data to study inequities in access to and expenditure on drinking water, the countries should make an effort to strengthen and improve the questions on water and sanitation. Studies like this should be performed periodically in order to monitor progress toward reducing the inequities detected.
1. Alleyne GAO. “Equity and health.” In: Pan American Health Organization. Equity and health: views from the Pan American Sanitary Bureau. Washington, D.C.: PAHO; 2001:3–21. (Occasional Publication No. 8).
2. Pan American Health Organization. Regional report on the Evaluation 2000 in the Region of the Americas: water supply and
sanita-tion, current status and prospects. Division of Health and Environment, Washington, D.C., September 2001. (http://www.paho.org, searching for water).
3. Deaton A. The analysis of household surveys: a microeconometric approach to development policy. Baltimore: The Johns Hopkins Univer-sity Press; 1997.
4. Otterstetter H, Galvão LA, Witt P, Toft P, Caporali S, Pinto PC, et al. “Health equity in relation to safe drinking water supply.” In: Pan American Health Organization. Equity and health: views from the Pan American San-itary Bureau. Washington, D.C.: PAHO; 2001: 99–114. (Occasional Publication No. 8).
Objetivo. Identificar y evaluar las inequidades en el acceso a y uso de servicios de agua potable tal como se reflejan en los gastos domiciliarios per capita en agua, y de-terminar qué proporción de los gastos del hogar se destina a pagar el agua en 11 países de América Latina y el Caribe.
Métodos. A patrir de datos obtenidos mediante encuestas domiciliarias de tipo
gen-eral (tales como la Living Standards Measurement Survey) realizadas en 11 países entre 1995 y 1999, la disponibilidad de agua potable y los gastos domiciliarios per capital y totales destinados a obetener agua potable fueron examinados a la luz de parámetros socioeconómicos, tales como la residencia urbana o rural, los ingresos del hogar, el tipo y la regularidad del servicio de distribución de agua, el tiempo dedicado a con-seguir el agua en hogares sin alcantarillado y el tipo de sistema de purificación del agua, cuando lo hay.
Resultados. El acceso a agua potable, así como los gastos domiciliarios totales y per
capital para la obtención de agua, muestran una asociación con los ingresos del hogar, la situación económica del hogar y su ubicación. El acceso de la población rural a ser-vicios de agua potable es mucho más reducido que el de la población urbana en aque-llos grupos que devengan ingresos similares. La proporción de las familias que tienen una sistema distribuidor de agua potable en la vivienda es similar en la población rural de más altos ingresos que en la población urbana de ingresos más bajos. Las fa-milias que no tienen un sistema de distribución de agua potable dedican mucho tiempo a conseguir el agua, lo cual implica, para las familias pobres, un gasto adi-cional. Las familias de bajos ingresos que carecen de una fuente de agua potable en el hogar gastan tanto dinero en conseguir agua como las familias de ingresos más altos. El acceso a métodos de desinfección del agua en el domicilio es muy reducido en el caso de las familias pobres, puesto que estos métodos son relativamente caros. El re-sultado es que las familias de menores ingresos beben agua de inferior calidad.
Conclusiones. Las encuestas domiciliarias para fines generales que se han llevado a
cabo desde el punto de vista del consumidor son instrumentos de valor para estudiar la equidad y la salud, particularmente cuando se estudian las desigualdades del ac-ceso a y uso de servicios de agua potable y lo que se gasta en obtenerla. Se recomienda que los países mejoren la parte de la encuesta dedicada al agua y al saneamiento a fin de facilitar la realización de evaluaciones sanitarias a escala nacional y el establec-imiento de programas de subsidios más equitativos.
RESUMEN