Low expression of APAF-1XL in acute
myeloid leukemia may be associated with
the failure of remission induction therapy
B.D. Benites, A. Fattori, C. Hackel, I. Lorand-Metze, C.A. De Souza, E. Schulz,
F.F. Costa and S.T.O. Saad
Hemocentro and Departamento de Medicina Interna, Faculdade de Medicina, Universidade Estadual de
Campinas, Campinas, SP, Brasil
Correspondence to: S.T.O. Saad, Hemocentro, UNICAMP, 13083-970 Campinas, SP, Brasil
E-mail: [email protected]
Apoptotic protease activating factor 1 (APAF-1) has a critical role in the regulation of apoptosis. In the present study, the mRNA expression analysis of different APAF-1 transcripts (APAF-1S, APAF-1LC, APAF-1LN, and APAF-1XL) was analyzed in bone marrow samples from 37 patients with acute myeloid leukemia (newly diagnosed, with no previous treatment). APAF-1XL and
APAF-1LN transcripts (with and without an extra WD-40 repeat region, respectively) were detected in all samples, although the major form expressed was APAF-1XL in 65% of the samples (group 1), while 35% of the samples expressed primarily APAF-1LN
(group 2). Only 46% of the patients presented complete remission in response to remission induction therapy (represented by less than 5% marrow blasts and hematological recovery), all but 2 cases being from group 1, 21.6% did not attain complete remission (only 1 case from group 1), and 32.4% of the patients died early. Lower expression of APAF-1XL ( APAF-1XL/APAF-1LN ratio <1.2) was associated with a poor response to therapy (P = 0.0005, Fisher exact test). Both groups showed similar characteristics regarding white blood cell counts, cytogenetic data or presence of gene rearrangements associated with good prognosis as AML1-ETO, CBFB-MYH11 and PML/RARA. Since it has been shown that only the isoforms with the extra WD-40 repeat region activate procaspase-9, we suggest that low procaspase-9 activation may also be involved in the deregulation of apoptosis and chemotherapy resistance in acute myeloid leukemia.
Key words: APAF-1; Acute myeloid leukemia; Apoptosis; Chemotherapy resistance Research supported by FAPESP (#05/51681-1) and CNPq (#352445/1996-3).
Received March 14, 2008. Accepted June 9, 2008
Introduction
Disturbance of the apoptotic mechanism is implicated in many human diseases, especially cancer (1), and failure to activate the apoptotic machinery can result in resistance to the cytotoxic effects of multiple chemotherapeutic agents (2,3). For the majority of anticancer drugs, apoptosis ap-pears to be initiated by the cytochrome c/apoptotic prote-ase activating factor 1 (APAF-1)/caspprote-ase-9 pathway. Cy-tochrome c can be released from mitochondria into the cytosol after the induction of apoptosis by many different stimuli. Upon its release and in the presence of dATP or ATP, APAF-1 forms a complex with procaspase-9. In turn,
Several investigators have described multiple APAF-1 splice variants. Alternative splicing can create an NH2
-terminal 11-amino acid insert between the CARD and ATPase domain or an additional COOH-terminal WDR between the fifth and sixth WDRs. The APAF-1XL and APAF-1LN isoforms have the insertion between the CARD and ATPase domains, and APAF-1XL also presents the additional WDR (10,11). In vitro assays have shown that only the forms containing the extra WDR were able to activate procaspase-9 in a cytochrome c- and dATP-de-pendent fashion, while the NH2-terminal insert was not
required (12).
Recent findings have provided insight into the regula-tion of the balance between apoptosis and cell proliferaregula-tion signals, and have suggested that some genes and path-ways may have an important role in the pathogenesis of acute myeloid leukemia (AML). AML is a lethal malignant disease characterized by the abnormal proliferation and differentiation of myeloid progenitor cells. The transforma-tion to leukemogenesis requires multiple steps, including defects in the growth and differentiation of hematopoietic cells (13).
Analysis of apoptotic gene expression in patients with AML has revealed that tumor suppressor genes are down-regulated and protooncogenes are up-down-regulated (13) and that several cellular signaling pathways acting either on cell cycle regulation or on apoptosis are altered. Deregula-tion was found in pathways that contribute to genomic stability and regulate cell cycle progression, and transcrip-tional alterations were also identified. Abnormalities were observed in the regulation of caspases by up-regulation of CASP8 and by the altered expression of the BCL2-related pathway (14). Svingen et al. (15) demonstrated that the levels of APAF-1 protein vary between acute lymphoblas-tic leukemia and AML patient samples and did not find a correlation with prognostic factors or response to induction therapy (15). However, Jia et al. (16) demonstrated that APAF-1 deficiency induces resistance to apoptosis in hu-man leukemic cells. Moreover, Furukawa et al. (17) de-scribed the methylation silencing of APAF-1 in AML cell lines and in a few AML patient samples but no studies have reported its relationship with prognosis (17). Thus, the role of APAF-1 in AML remains poorly characterized.
The aim of the present study was to characterize the expression of different APAF-1 transcripts in untreated AML bone marrow samples and to correlate the expres-sion of these mRNAs with the clinical outcome of these patients. The relative expression of these transcripts was determined by RT-PCR band densitometry, a technique that allows a reproducible comparison between APAF-1LN and APAF-1XL transcripts. A strong association
be-tween low APAF-1XL mRNA expression and poor re-sponse to chemotherapy was detected.
Subjects and Methods
Subjects
Thirty-seven patients with AML (1 biphenotypic, 1 M0, 10 M1, 5 M2, 6 M3, 12 M4, 1 M5B, and 1 M6) (18) and 10 normal bone marrow donors participated in this study. The diagnosis of AML was based on clinical and laboratory data. Informed written consent was obtained from all indi-viduals, and the study was approved by the Ethics Com-mittee of the General Hospital of the State University of Campinas. Median age was 49 years (range: 19–86 years). The male:female ratio was 2.3:1. The median rate of leukemic blasts in patient bone marrow samples was 85% (range: 34 to 97%). All patients were untreated and were enrolled at the time of initial therapy. Thirty-four patients presented primary AML and 3 patients secondary AML after myelodysplasia. Remission induction therapy included anthracyclines, cytarabine and 6-thioguanine for patients under 60 years and etoposide, mitoxantrone and 6-thiogua-nine for patients over 60 years. For patients with the M3 subtype, the induction treatment included all transretinoic acid and mitoxantrone.
Complete remission was determined when bone mar-row became normocellular, containing less than 5% blasts. Relapse was diagnosed when bone marrow contained >5% leukemic blasts or when leukemic infiltration occurred at any other site.
RNA extraction, cDNA transcription and RT-PCR assays
Total RNA from bone marrow samples was prepared using TRIzol® Reagent (Invitrogen, USA) and cDNA was
synthesized with the SuperScript II™ reverse transcriptase and oligo (dT) primer. Reverse-transcribed RNA was sub-mitted to PCR in a 50-µL reaction mixture using high fidelity Taq Platinum® (Invitrogen). The relative amounts of
APAF-1 cDNAs with or without the NH2-terminal 11-amino acid
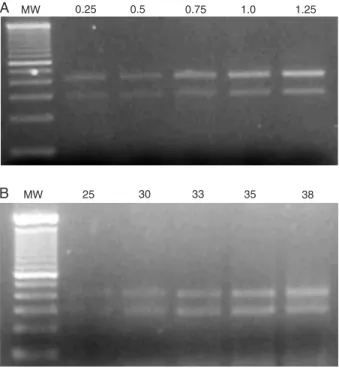
extension at 72°C. In order to ensure that the RT-PCR signal was linear with respect to RNA input, we performed kinetic analysis by varying the number of amplification cycles (25, 30, 33, 35, 38) and the amount of cDNA input (0.25, 0.5, 0.75, 1.0, 1.25 µg), considering that the same amount of RNA was reverse-transcribed for each sample (Figure 1). On the basis of this analysis, we used 33 cycles for both pairs of primers and 1 µg cDNA. PCR amplification was carried out in duplicate and water was used as nega-tive control. PCR products were run on 1.5% agarose gels and analyzed by staining with ethidium bromide. Band quantification was performed using the Kodak Digital Im-age 1D software, version 3.0.2. For most samples, experi-ments were repeated twice.
RT-PCR was also performed for the detection of other recognized prognostic markers in AML as PML-RARA, AML1-ETO, CBFB-MYH11 rearrangements using the fol-lowing primers: 1) Inv16C1: 5’CAGGCAAGGTATATTT GAAGG3', Inv16M1: 5’CTCTTCTCCTCATTCTGCTC’, and Inv16nest: 5’GAAATGGAGGTCCATGAGCT3'; 2) PML-RAR: 5'-ACCGATGGCTTCGACGAGTTC-3', 5'-AGCCCTT GCAGCCCTCACAG-3', 5'-AGCGCGACTACGAGGAGA TG-3', and 5'-CCATAGTGGTAGCCTGAGGACT-3'; 3) AML1 gene: 5'-AGCTTCACTCTGACCATCAC-3', ETO gene: 5’TGAACTGGTTCTTGGAGCTCCT-3', and 8,21 probe ETO gene: 5'-TTCACAAACCCACCGGAAGTA-3'.
Cell cultures, induction of apoptosis and Western blot
In order to determine if the expression of APAF-1 transcripts is related to apoptosis, we used KG-1 and HL-60 cells as a model since APAF-1XL is expressed differ-ently in these cell lines. The induction of apoptosis was performed by incubation of KG-1 and HL-60 cell lines with 100 mM ethanol with or without serum (5%, v/v, heat-inactivated horse serum and 10%, v/v, fetal calf serum) for 24 h (19). Total protein was then extracted and submitted to SDS-PAGE, on a 15% polyacrylamide Laemmli system (20). Western blot was performed using a caspase-9 anti-body (Santa Cruz Biotechnology, USA). Inactive caspase-9 is 47 kDa and after hydrolysis, a 35-kDa band should be detected.
Statistical analysis
Correlation between mRNA expression and clinical re-sponse to remission induction therapy was assessed using the Fisher exact test. The association of APAF-1 isoforms with survival was determined by comparing Kaplan-Meier survival curves constructed for the two different groups by the log-rank test. Overall survival was measured from diag-nosis to death or date of the last follow-up visit. Patient follow-up continued up to January 31, 2007.
MW 0.25 0.5 0.75 1.0 1.25
A
B MW 25 30 33 35 38
Figure 1. Figure 1. Figure 1. Figure 1.
Figure 1. Standardization of RT-PCR conditions by kinetic anal-ysis of APAF-1 transcript amplification. A, Increasing amounts of cDNA were submitted to 33 cycles of amplification (from 0.25 to 1.25 µg). B, cDNA (1 µg) was submitted to different numbers of cycles of amplification (from 25 to 38). MW = molecular weight (100-bp ladder).
Results
Relative expression of APAF-1 transcripts in AML blasts and normal bone marrow
PCR analysis using N1 and N2 primers revealed only the APAF-1 transcript with the 11-amino acid NH2-terminal
insertion in all samples. The same was observed in normal controls. PCR analysis using primers C1 and C2 showed two products in all samples, although their relative amounts varied among samples (Figure 2). Only two APAF-1 tran-scripts, APAF-1XL and APAF-1LN, were detected in the 37 AML patient samples examined.
The results of analysis by real-time PCR were not reproducible (data not shown). However, taking advan-tage of the fact that both transcripts can be efficiently and simultaneously amplified in the same tube, the APAF-1XL/ APAF-1LN mRNA ratio was calculated based on the quan-tification of the 430- and 301-bp band, respectively. Dupli-cate analysis showed a coefficient of variation lower than 20% (median = 6.4%; range: 0 to 19%) for quantitation of the bands indicating the reliability of the method. This method has the advantage of permitting the comparison of the two transcripts in a same sample.
PCR product contained the extra WDR (APAF-1XL/APAF-1LN ratio ≥1.2), and in 13 samples (35%), the expression of both products was similar or with a predominance of the transcript lacking the extra WDR (APAF-1XL/APAF-1LN ratio ≤1.15; Figure 2, Table 1). The analysis of 10 normal bone marrow samples showed a median APAF-1XL/APAF-1LN ratio = 1.07 (range = 0.92-1.38). Approximately equal amounts of APAF-1XL and APAF-1LN (containing only
the NH2-terminal insertion) were detected in normal bone
marrow, colon and spleen tissues, while tissues such as brain, kidney, stomach, and skeletal muscle expressed more APAF-1XL (12).
Low expression of APAF-1XL is associated with failure of remission induction therapy
Patients were divided into two groups according to
Figure 2. Figure 2. Figure 2. Figure 2.
Figure 2. RT-PCR of APAF-1 transcripts from patients with acute myeloid leukemia numbered as shown in Tables 1 and 2. MW = molecular weight (100-bp ladder).
APAF-1XL
APAF-1LN APAF-1XLAPAF-1LN
APAF-1XL APAF-1LN
MW 10 14 20 24 MW 2 4 MW 16 17
Table 1. Table 1.Table 1. Table 1.
Table 1. Relationship of APAF-1XL/APAF-1LN ratio with the response to the first or second cycle of remission induction therapy. Patient Age AML Leukocytes Cytogenetics AML1- PML- CBFB- APAF-1XL/ Remission number (years) (FAB) (N/mm3) ETO RARA MYH11 APAF-1LN ratio
1 60 M1 na nd nd nd nd 1.27 Yes
2 54 M4 26760 46,XY negative negative negative 1.97 Yes
3 51 M4 7260 46,XY negative negative negative 1.36 Yes
4 51 M4 123000 46,XX negative negative negative 1.49 Yes
5 76 M4 11820 46,XY negative negative positive 1.29 Yes
6 47 M1* 6750 45,XY,8q-,-21 nd nd nd 1.34 Yes
7 20 M1 27370 46,XX negative negative negative 1.88 Yes
8 24 M3 24800 46,XY negative positive negative 3.16 Yes
9 41 M1 2800 46,XX negative negative negative 1.58 Yes
10 18 M0 16800 nd negative negative negative 1.65 Yes
11 86 M1 8430 nd negative negative negative 1.24 Yes
12 44 M6 na nd nd nd nd 1.34 Yes
13 44 biphenotypic na nd nd nd nd 1.33 Yes
14 58 M4 12200 nd nd nd nd 1.31 Yes
15 43 M4 6830 nd nd nd nd 1.34 Yes
16 83 M4 26450 46,XX negative negative positive 1.76 No
17 34 M1 12890 nd nd nd nd 0.89 Yes
18 31 M3 28630 nd negative positive negative 1.05 Yes
19 58 M4 11690 nd nd nd nd 0.78 No
20 22 M2 2100 46,XY negative negative negative 1.05 No
21 31 M1 8630 nd nd nd nd 1.08 No
22 70 M2 112000 47,XY,+11 negative negative negative 1.07 No
23 30 M5B 6810 nd negative negative negative 1.08 No
24 36 M2* 2310 45,XY,-5,17p+[6]/46,XY[19] negative negative negative 1.15 No
25 52 M1 na nd negative negative negative 1.08 No
APAF-1XL/APAF-1LN ratio, with group 1 expressing mostly APAF-1XL, ranging from 1.20 to 3.16 and group 2 express-ing APAF-1XL/APAF-1LN, rangexpress-ing from 0.78 to 1.15. Com-parison of the two AML groups showed no difference regarding age, AML subtypes, white blood cell counts, cytogenetic data, presence of PML-RARA, AML1-ETO, CBFB-MYH11 gene rearrangements, expression of CD34, HLA-DR, lymphoid markers. However, in response to the first or second cycle of remission induction therapy, 17 (46%) patients obtained complete remission (less than 5% marrow blasts and hematological recovery), all but 2 of these cases were in group 1, while 8 (21.6%) did not attain complete remission (only 1 case in 8 were from group 1) and 12 (32.4%) patients died early (equally distributed in both groups). To our knowledge, the data reported herein show for the first time that levels of APAF-1XL lower than APAF-1LN are associated with a poor response to remis-sion induction therapy (Fisher test: P = 0.0005, 95%CI: 3.09-2458.81, odds ratio = 39.59; Table 2).
Lack of correlation between APAF-1 transcript expression and overall survival
To investigate a possible correlation between APAF-1 mRNA expression and overall survival we divided the patients into two groups with an APAF-1XL/APAF-1LN ratio = 1.15 as the cut-off. Mean survival was 12.8 months for the group with a ratio >1.15 and 11.5 months for the group with a ratio ≤1.15; however, the difference was not statistically significant (P = 0.54; see Figure 3). Thus, although APAF-1 transcript expression appears to be an important marker of the response to chemotherapy, it is not associated with patient survival.
Correlation between APAF-1 transcript expression and caspase-9 activation
To determine if lower amounts of APAF-1XL are asso-ciated with lower caspase-9 activation, we induced apop-tosis in HL-60 and KG-1 cells, and determined caspase-9 activation and the APAF-1XL/APAF-1LN expression ratio. Apoptosis was induced by incubating the cell lines with 100 mM ethanol with or without FBS for 24 h (19), and Western blot was performed using caspase-9 antibody, as described in Subjects and Methods.
The KG-1 cell line had a high expression of APAF-1LN and a very low expression of APAF-1XL, with the opposite occurring in HL-60 cells, which contain high amounts of APAF-1XL (Figure 4A). Densitometric analysis of the bands showed, as expected, higher amounts of cleaved cas-pase-9 in the HL-60 cell line, and a predominance of the inactive form in the KG-1 cell line (Figure 4B,C). These data indicate a direct relationship between higher
APAF-Table 2. Table 2. Table 2. Table 2.
Table 2. Correlation between the relative expression of APAF-1 transcripts and response to remission induction therapy.
Group Remission
Yes No
1 (ratio >1.15) 15 1
2 (ratio ≤1.15) 2 7
Group 1: predominantly expressing APAF-1XL (APAF-1XL/ APAF-1LN ratio >1.15) and group 2: predominantly expressing APAF-1LN or both isoforms equally (APAF-1XL/APAF-1LN ratio ≤1.15). P = 0.0005 (Fisher test).
0 10 20 30 40 50
Patient survival
100
80
60
40
20
0
Mean survival (months) ratio 1.15 (N = 8)£ ratio >1.15 (N = 15)
Figure 3. Figure 3. Figure 3. Figure 3.
Figure 3. Kaplan-Meier plot of overall survival according to the ratio APAF-1XL/APAF-1LN. Overall survival of patients present-ing an APAF-1XL/APAF-1LN ratio >1.15 (solid line, N = 15) versus patients presenting an APAF-1XL/APAF-1LN ratio ≤1.15 (dashed line, N = 8). There was no significant difference between groups (log-rank test).
1XL mRNA levels and the activation of caspase-9 at the protein level.
Discussion
concentration. Competitive PCR is a labor-intensive meth-od limited to a variable target-to-competitor ratio. Lately, real-time PCR has been used with reliable results (22); however, a well-validated boundary-spanning primer is necessary. Moreover, the method requires multiple inter-nal control genes for normalization of the reaction.
In the present study, the relative expression of APAF-1 transcripts was measured by semi-quantitative PCR, which allowed us to efficiently amplify both transcripts in the same reaction tube. Other investigators have used this same approach (12,22). Furthermore, our analysis in-tended to demonstrate the relationship between the two transcripts in the same sample, rather than compare each transcript in several samples; thus, this method allowed us to approximately determine the APAF-1XL/APAF-1LN ra-tio. Our results showed that two APAF-1 transcripts were present in all AML patients, although in varying amounts. All samples examined exclusively showed the transcript corresponding to the insertion of the 11 amino acids be-tween the CARD and ATPase domains. Regarding the COOH-terminal, the presence of both transcripts, with and without the extra WDR, was observed. Thus, the mRNA transcripts found in patient cells were both APAF-1XL and APAF-1LN. Indeed, the results clearly showed the asso-ciation of the APAF-1 transcript mRNA expression with the response to induction treatment. All but two patients, pre-senting predominantly the APAF-1XL transcript, responded to the first or second cycle of remission induction therapy.
Patients with the highest expression of APAF-1XL had a tendency to higher survival, which, however, was not statisti-cally significant.
When we induced apoptosis in cell cultures of the HL-60 line, which presents the highest amounts of APAF-1XL, efficient caspase-9 activation was observed but not in the KG-1 line which has relatively less APAF-1XL and more APAF-1LN. This association between the levels of a spe-cific transcript of the APAF-1 gene and caspase-9 activa-tion suggests how the result of alternative splicing could modulate an important biological process such as apopto-sis.
Quantitation of the various molecules involved in the apoptotic pathways has been studied to predict the re-sponse of leukemia patients to chemotherapy. High AF1q expression was associated with poor survival in pediatric AML (23). FAK expression correlates with enhanced mi-gratory properties, drug resistance, high leukocytosis, and reduced survival (24), and low or absentexpression of the FADD protein in leukemic cells at diagnosisis a poor independent prognostic factor (25). In addition to their prognostic significance, a better understanding of the bio-logic mechanism of these molecular changes may help identify new targets for cancer therapy.
In AML, the expression level of molecules involved in the mitochondria-mediated pathway of apoptosis also pro-vides important prognostic information. Although the prog-nostic value of the expression of BCL-2 antiapoptotic and
Figure 4. Figure 4.Figure 4. Figure 4.
BAX proapoptotic molecules is controversial (26-29), the BAX to BCL-2 ratio is of prognostic value in AML patients (30).
Benedict et al. (12) have shown that only the APAF-1 isoforms with the extra WDR activate procaspase-9. Thus, we suggest that in AML a low expression of APAF-1XL may possibly be correlated with a lower procaspase-9 activation, corroborating the deregulation of apoptosis and chemotherapy resistance.
Several studies have demonstrated a strong relation-ship between APAF-1 expression and response to chemo-therapy and progression or prognosis of many neoplastic diseases such as melanoma, Burkitt lymphoma, chronic lymphoid leukemia, colorectal cancer, and cervical cancer (31-35). Moreover, hypermethylation of the APAF-1 gene may be an independent prognostic factor in acute lympho-blastic leukemia (36). In addition to these findings, the
results herein presented showed, for the first time, that APAF-1 expression is also associated with response to chemotherapy in acute myeloid leukemia.
Despite the small number of patients studied, the pres-ent results strongly suggest that APAF-1 plays a role in their response to chemotherapy and may have an impact on the survival of AML patients. Thus, multicentric studies with a larger number of patients should be encouraged in order to test the impact of APAF-1XL as a prognostic marker in AML.
Acknowledgments
We are grateful to Ms. Tereza Sueko Ide Salles for valuable technical assistance, to Mr. Roberto Zulli for performing the statistical analysis, and to Ms. Raquel S. Foglio for revision of the English text.
References
1. Nicholson DW. ICE/CED3-like proteases as therapeutic tar-gets for the control of inappropriate apoptosis. Nat Biotechnol 1996; 14: 297-301.
2. Jia L, Allen PD, Macey MG, Grahn MF, Newland AC, Kelsey SM. Mitochondrial electron transport chain activity, but not ATP synthesis, is required for drug-induced apoptosis in human leukaemic cells: a possible novel mechanism of regulating drug resistance. Br J Haematol 1997; 98: 686-698.
3. Jia L, Macey MG, Yin Y, Newland AC, Kelsey SM. Subcellu-lar distribution and redistribution of Bcl-2 family proteins in human leukemia cells undergoing apoptosis. Blood 1999; 93: 2353-2359.
4. Li P, Nijhawan D, Budihardjo I, Srinivasula SM, Ahmad M, Alnemri ES, et al. Cytochrome c and dATP-dependent for-mation of Apaf-1/caspase-9 complex initiates an apoptotic protease cascade. Cell 1997; 91: 479-489.
5. Hu Y, Benedict MA, Ding L, Nunez G. Role of cytochrome c and dATP/ATP hydrolysis in Apaf-1-mediated caspase-9 activation and apoptosis. EMBO J 1999; 18: 3586-3595. 6. Saleh A, Srinivasula SM, Acharya S, Fishel R, Alnemri ES.
Cytochrome c and dATP-mediated oligomerization of Apaf-1 is a prerequisite for procaspase-9 activation. J Biol Chem 1999; 274: 17941-17945.
7. Cecconi F, Alvarez-Bolado G, Meyer BI, Roth KA, Gruss P. Apaf1 (CED-4 homolog) regulates programmed cell death in mammalian development. Cell 1998; 94: 727-737. 8. Yoshida H, Kong YY, Yoshida R, Elia AJ, Hakem A, Hakem
R, et al. Apaf1 is required for mitochondrial pathways of apoptosis and brain development. Cell 1998; 94: 739-750. 9. Zou H, Henzel WJ, Liu X, Lutschg A, Wang X. Apaf-1, a
human protein homologous to C. elegans CED-4, partici-pates in cytochrome c-dependent activation of caspase-3. Cell 1997; 90: 405-413.
10. Hahn C, Hirsch B, Jahnke D, Durkop H, Stein H. Three new
types of Apaf-1 in mammalian cells. Biochem Biophys Res Commun 1999; 261: 746-749.
11. Walke DW, Morgan JI. A comparison of the expression and properties of Apaf-1 and Apaf-1L. Brain Res 2000; 886: 73-81.
12. Benedict MA, Hu Y, Inohara N, Nunez G. Expression and functional analysis of Apaf-1 isoforms. Extra Wd-40 repeat is required for cytochrome c binding and regulated activa-tion of procaspase-9. J Biol Chem 2000; 275: 8461-8468. 13. Melo MB, Ahmad NN, Lima CS, Pagnano KB, Bordin S,
Lorand-Metze I, et al. Mutations in the p53 gene in acute myeloid leukemia patients correlate with poor prognosis. Hematology 2002; 7: 13-19.
14. Casas S, Ollila J, Aventin A, Vihinen M, Sierra J, Knuutila S. Changes in apoptosis-related pathways in acute myelocytic leukemia. Cancer Genet Cytogenet 2003; 146: 89-101. 15. Svingen PA, Karp JE, Krajewski S, Mesner PW Jr, Gore
SD, Burke PJ, et al. Evaluation of Apaf-1 and procaspases-2, -3, -7, -8, and -9 as potential prognostic markers in acute leukemia. Blood 2000; 96: 3922-3931.
16. Jia L, Srinivasula SM, Liu FT, Newland AC, Fernandes-Alnemri T, Fernandes-Alnemri ES, et al. Apaf-1 protein deficiency con-fers resistance to cytochrome c-dependent apoptosis in human leukemic cells. Blood 2001; 98: 414-421.
17. Furukawa Y, Sutheesophon K, Wada T, Nishimura M, Saito Y, Ishii H, et al. Methylation silencing of the Apaf-1 gene in acute leukemia. Mol Cancer Res 2005; 3: 325-334. 18. Bennett JM, Catovsky D, Daniel MT, Flandrin G, Galton DA,
Gralnick HR, et al. Proposed revised criteria for the classifi-cation of acute myeloid leukemia. A report of the French-American-British Cooperative Group. Ann Intern Med 1985; 103: 620-625.
20. Laemmli UK. Cleavage of structural proteins during the assembly of the head of bacteriophage T4. Nature 1970; 227: 680-685.
21. Vandenbroucke II, Vandesompele J, Paepe AD, Messiaen L. Quantification of splice variants using real-time PCR. Nucleic Acids Res 2001; 29: E68.
22. Pfaffl MW. A new mathematical model for relative quantifi-cation in real-time RT-PCR. Nucleic Acids Res 2001; 29: e45.
23. Tse W, Meshinchi S, Alonzo TA, Stirewalt DL, Gerbing RB, Woods WG, et al. Elevated expression of the AF1q gene, an MLL fusion partner, is an independent adverse prognostic factor in pediatric acute myeloid leukemia. Blood 2004; 104: 3058-3063.
24. Recher C, Ysebaert L, Beyne-Rauzy O, Mansat-De Mas V, Ruidavets JB, Cariven P, et al. Expression of focal adhesion kinase in acute myeloid leukemia is associated with en-hanced blast migration, increased cellularity, and poor prog-nosis. Cancer Res 2004; 64: 3191-3197.
25. Tourneur L, Delluc S, Levy V, Valensi F, Radford-Weiss I, Legrand O, et al. Absence or low expression of fas-associ-ated protein with death domain in acute myeloid leukemia cells predicts resistance to chemotherapy and poor out-come. Cancer Res 2004; 64: 8101-8108.
26. Del Poeta G, Venditti A, Del Principe MI, Maurillo L, Bucci-sano F, Tamburini A, et al. Amount of spontaneous apopto-sis detected by Bax/Bcl-2 ratio predicts outcome in acute myeloid leukemia (AML). Blood 2003; 101: 2125-2131. 27. Oltvai ZN, Milliman CL, Korsmeyer SJ. Bcl-2
heterodimer-izes in vivo with a conserved homolog, Bax, that acceler-ates programmed cell death. Cell 1993; 74: 609-619. 28. Campos L, Rouault JP, Sabido O, Oriol P, Roubi N,
Vas-selon C, et al. High expression of bcl-2 protein in acute
myeloid leukemia cells is associated with poor response to chemotherapy. Blood 1993; 81: 3091-3096.
29. Lauria F, Raspadori D, Rondelli D, Ventura MA, Fiacchini M, Visani G, et al. High bcl-2 expression in acute myeloid leukemia cells correlates with CD34 positivity and complete remission rate. Leukemia 1997; 11: 2075-2078.
30. Bincoletto C, Saad ST, da Silva ES, Queiroz ML. Haemato-poietic response and bcl-2 expression in patients with acute myeloid leukaemia. Eur J Haematol 1999; 62: 38-42. 31. Soengas MS, Capodieci P, Polsky D, Mora J, Esteller M,
Opitz-Araya X, et al. Inactivation of the apoptosis effector Apaf-1 in malignant melanoma. Nature 2001; 409: 207-211. 32. Sun Y, Orrenius S, Pervaiz S, Fadeel B. Plasma membrane sequestration of apoptotic protease-activating factor-1 in human B-lymphoma cells: a novel mechanism of chemore-sistance. Blood 2005; 105: 4070-4077.
33. Sturm I, Bosanquet AG, Radetzki S, Hummel M, Dorken B, Daniel PT. Silencing of APAF-1 in B-CLL results in poor prognosis in the case of concomitant p53 mutation. Int J Cancer 2006; 118: 2329-2336.
34. Umetani N, Fujimoto A, Takeuchi H, Shinozaki M, Bilchik AJ, Hoon DS. Allelic imbalance of APAF-1 locus at 12q23 is related to progression of colorectal carcinoma. Oncogene 2004; 23: 8292-8300.
35. Leo C, Richter C, Horn LC, Schutz A, Pilch H, Hockel M. Expression of Apaf-1 in cervical cancer correlates with lymph node metastasis but not with intratumoral hypoxia. Gynecol Oncol 2005; 97: 602-606.