Non-invasive messenger RNA transcriptional
evaluation in human kidney allograft dysfunction
G. Joelsons
1, T. Domenico
1, L.F. Gonc
¸
alves
1,2
and R.C. Manfro
1,21Programa de Pós-Graduac
¸ão em Medicina: Ciências Médicas, Faculdade de Medicina,
Universidade Federal do Rio Grande do Sul, Porto Alegre, RS, Brasil 2Servic
¸o de Nefrologia, Hospital de Clínicas de Porto Alegre, Porto Alegre, RS, Brasil
Abstract
The aim of the present study was to evaluate messenger RNA expression in kidney allograft recipients. Forty-four kidney transplant recipients were evaluated up to three months after grafting. After transplantation, peripheral blood samples were drawn sequentially for real-time polymerase chain reaction analyses of perforin and TIM-3 genes. Biopsies were obtained to evaluate acute graft dysfunction and interpreted according to the Banff classification. Eight patients presented episodes of acute rejection. Recipients with rejection had significantly higher levels of TIM-3 mRNA transcripts compared to those without rejection (median gene expression 191.2 and 36.9 mRNA relative units, respectively; Po0.0001). Also, perforin gene expression was
higher in patients with rejection (median gene expression 362.0 and 52.8 mRNA relative units; Po0.001). Receiver operating
characteristic curves showed that the area under the curve (AUC) for the TIM-3 gene was 0.749 (95%CI: 0.670–0.827). Perforin gene mRNA expression provided an AUC of 0.699 (95%CI: 0.599 to 0.799). Overall accuracy of gene expression was 67.9% for the TIM-3 gene and 63.6% for the perforin gene. Combined accuracy was 76.8%. Negative predictive values were 95.3% for the TIM-3 gene, 95.5% for the perforin gene, and 95.4% in the combined analyses. Gene expression was significantly modulated by rejection treatment decreasing 64.1% (TIM-3) and 90.9% (perforin) compared to the median of pre-rejection samples. In conclusion, the longitudinal approach showed that gene profiling evaluation might be useful in ruling out the diagnosis of acute rejection and perhaps evaluating the efficacy of treatment.
Key words: Kidney transplantation; Acute rejection; Gene expression; Diagnosis; mRNA
Introduction
Kidney transplantation has become the therapy of choice for many patients with end-stage renal disease. In the last two decades, significant improvements occurred in thefirst year post transplantation, but despite this early success, long-term survival of patients and allografts has not improved significantly (1).
Acute rejection (AR), defined as graft aggression result-ing from the recipient’s immune response to the donor antigens expressed in grafted organs, is a major immuno-logical event and may influence short- and long-term outcomes (2). It typically occurs during the initial periods following renal transplantation and its diagnosis is sus-pected by an increment in serum creatinine and confirmed by histological analysis of graft tissue. A major difficulty in current clinical practice is that biomarkers presently used in renal transplantation are not accurate enough to differentiate AR from other causes of graft dysfunc-tion, such as acute tubular necrosis, calcineurin inhibi-tors nephrotoxicity, and infections. No single satisfactory method of diagnosing AR is currently available. Instead,
combined methods are used for post-transplantation monitoring.
Histological examination of allograft tissue remains the gold standard for the diagnosis of allograft dysfunction (3). Recent refinements have reduced but not abolished biopsy-associated complications; however, sampling errors, poor reproducibility in interpretation, and the focal characteristic of the inflammatory process of rejection pose additional problems leading to the need of multiple samples to increase diagnostic accuracy (4). Also to be considered are the elevated costs of the biopsy procedure. On the other hand, protocol biopsies may display features of inflammation occurring in well-functioning grafts, the so-called subclinical rejection, that has been associated with chronic graft loss (5).
Gene expression profiling in the early post-transplant period may provide insight into the activity of the immune system in response to the graft (6). Non-invasive tools have several advantages that include the frequent and sequential assessments of the recipient’s immune status.
Correspondence: R.C. Manfro:<[email protected]>
The developments in the molecular monitoring of recipi-ents of solid organ transplants have focused on non-invasive tests of easily accessible biologicalfluids, such as urine and peripheral blood (7–11). Results obtained with hypothesis-driven candidate messenger RNAs (mRNA) expression patterns evaluated in urine and blood have been impressive in cross-sectional studies suggesting that molecular perturbations may precede not only graft dysfunction but also histological changes. Among the studied genes, perforin and TIM-3 have performed highly in terms of diagnostic accuracy in the mentioned cross-sectional studies (8,10,12,13). Perforin is stored in cyto-plasmic granules and subsequently secreted by effector CTL leading to pore formation in the target-cell membrane, ultimately leading to cell death (14). TIM-3 is a type I membrane protein preferentially expressed on terminally differentiated Th1 cells, which seems to be central in the mechanisms of allograft rejection (15). However, it must be acknowledged that the vast majority of the studies employing these tools are cross-sectional and that the validation of biomarkers still requires the demonstration of adequate accuracy in longitudinal follow-up studies.
In the present study, we analyzed TIM-3 and perforin mRNA expression in the peripheral blood of kidney transplant recipients to evaluate their utility as non-invasive biomarkers of anti-allograft responses.
Material and Methods
Subjects
Forty-four kidney transplant recipients were enrolled. They agreed to participate by signing an informed consent form, and blood samples were sequentially drawn at days 3, 4–6, 9–11, 14–16, 19–21, 24–26, 29–31, 44–46, 59–61, 89–91 after transplantation. Acute rejection was diagnosed by histopathological analysis of graft biopsies or by surveil-lance biopsies in patients with delayed graft function (DGF). DGF was defined by the need of dialysis within the first week after transplantation. Two cores were obtained at each biopsy and the slides were interpreted according to the Banff classification (3) by a pathologist unaware of the clinical suspicion. Biopsies rated as Banff 1A or higher were considered as rejection. Based on the occurrence of acute rejection, patients were classified as either rejectors or non-rejectors and their gene expression was studied accordingly.
Immunosuppression and anti-rejection therapy All patients received a 500-mg dose of methylprednis-olone transoperatively and were maintained with a combi-nation of prednisone, sodium mycophenolate, and tacrolimus or cyclosporine. Patients at high-risk for acute rejection received antibody induction therapy with anti-thymocyte antibodies and patients with post-operative oliguria or anuria received anti-IL2 receptor antibodies within 24 h of the transplant surgery. Acute cellular rejections were
treated with a 3-day course of 500 mg methylpredniso-lone intravenously. Steroid-resistant rejections and those with initial classification of Banff IIA or higher were treated with a 10–14-day course of anti-thymocyte antibodies.
Sample handling and design of primers and probes Peripheral blood samples were drawn in EDTA-containing tubes and leukocytes were obtained through erythrocyte lysis with a hypotonic buffer and stored at
–80°C. RNA isolation was performed using the QiaAmp RNA Blood Mini Kit (Qiagen Inc., USA) according to the manufacturer’s instructions. Total RNA quantifications were made using the NanoDrops1000 Spectrophotometer v.3.7
(Thermo Fischer Scientific, USA) and RNA purity was observed as a ratio of absorbances at two different wave lengths (260/280 nM). Only samples with optical density ratio higher than 1.7 were analyzed. Total RNA was reverse transcribed into cDNA using the cDNA High Capacity Kit (Applied Biosystems, USA), according to manufacturer’s instructions, to afinal volume of 20mL and stored at–20°C. The 50nuclease assay was performed using the ABI 7000 Sequence Detection System and TaqMan Universal PCR Master Mix, composed by AmpliTaq Golds DNA
polymerase, Amperase UNG, passive reference (ROX), buffer and dNTPs (Applied Biosystems, USA). The design and synthesis of the gene specific primers andfluorogenic probes for Perforin (ID: Hs 00169473_m1; GenBank reference: 5551; also listed as PRF1) and TIM-3 (ID: Hs 00262170_m1; GenBank reference: 84868; also listed as HAVCR2) mRNA were made by TaqMansGene Expres-sion Assays (Applied Biosystems, USA) and had already been tested and validated previously by the manufacturer. 18S rRNA, was used as an endogenous control (Eukaryotic 18S rRNA Endogenous Control, Applied Biosystems). Gene Expression Assays consisted of 20 concentrated (360mM) mix of PCR primers and TaqmansMGB (Minor
Groove Binding) probes. These assays are designed for the detection and amplification of specific genetic sequences. All primers utilized were intron-spanning to avoid genomic DNA amplification (Gene Expression Assays/Custom Prim-ers and Probes; Applied Biosystems, USA). The Taqmans
Statistical analyses
Descriptive analyses, means±SD, and distributions are reported. Receiver operating characteristic (ROC) curves and non-parametric Mann-Whitney and U-Wilcoxon tests were used for the statistical analysis of quantitative variables. Fisher’s exact test was used to compare qualitative variables and non-parametric Wilcoxon signed-rank test was used to compare gene expression levels pre-and post-treatment. ROC curves were generated to analyze diagnostic parameters derived from gene expression. A P level o0.05 was considered for statistical
signifi-cance. The threshold for overexpression of the genes evaluated (100% relative to the calibrator) were estab-lished by ROC curves and used for the calculation of the diagnostic parameters.
The study was approved by the research and ethics committee of Hospital de Clínicas de Porto Alegre and registered at the Office for Human Research Protection.
Results
Kidney transplant recipients were sequentially evalu-ated during the initial 90 days after transplantation. Patients were divided according to the occurrence of acute rejection based on graft pathology. The main demographic char-acteristics of the groups are shown in Table 1. No significant difference was found for the comparisons of gender, age, race, cold ischemia time, human leukocyte antigen (HLA) matching (loci A, B, and DR), incidence of DGF, serum creatinine up to 180 days after transplantation, percentage
of deceased donor recipients, and immunosuppressive regimen. The eight rejection episodes were classified as Banff IA (4 episodes), IB (1 episode), IIA (1 episode), and IIB (2 episodes). Biopsies with borderline rejection occurred in 10 patients and were not included in the rejection group.
Gene expression analyses
Eight recipients presented an acute rejection episode. Twenty-eight peripheral blood samples were drawn from these subjects and compared to 243 samples that included all samples from 36 patients without rejection (n=197) and the post-treatment samples of the patients with rejection (n=46).
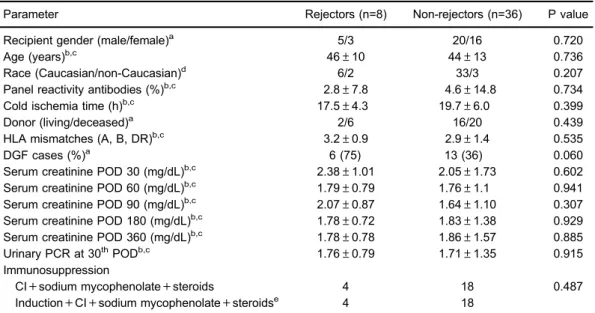
Recipients with rejection had significantly higher levels of TIM-3 mRNA transcripts compared to those without rejection. The median gene expression values were 191.2 and 36.9 mRNA relative units, respectively (Mann-Whitney, Po0.001). A significant difference was also observed in
the median mRNA expression of the perforin gene: 362 and 52.8 mRNA relative units, respectively, for patients with and without acute rejection (Mann-Whitney; P=0.001). Figure 1 displays the box plots of logarithmic transformed mRNA expressions comparing patients with and without acute rejection.
Box plots show the 10th, 25th, 50th (median), 75th, and 90th percentile values for mRNA gene expression values related to the calibrator (2-DDCt) using 18S rRNA as endogenous control. The logarithmic transformed mRNA levels of perforin and TIM-3 were higher in leukocytes from patients with acute rejection than in patients without
Table 1.Demographic and transplant data of the study subjects.
Parameter Rejectors (n=8) Non-rejectors (n=36) P value
Recipient gender (male/female)a 5/3 20/16 0.720
Age (years)b,c 46±10 44±13 0.736
Race (Caucasian/non-Caucasian)d 6/2 33/3 0.207
Panel reactivity antibodies (%)b,c 2.8±7.8 4.6±14.8 0.734
Cold ischemia time (h)b,c 17.5±4.3 19.7±6.0 0.399
Donor (living/deceased)a 2/6 16/20 0.439
HLA mismatches (A, B, DR)b,c 3.2±0.9 2.9±1.4 0.535
DGF cases (%)a 6 (75) 13 (36) 0.060
Serum creatinine POD 30 (mg/dL)b,c 2.38±1.01 2.05±1.73 0.602 Serum creatinine POD 60 (mg/dL)b,c 1.79±0.79 1.76±1.1 0.941 Serum creatinine POD 90 (mg/dL)b,c 2.07±0.87 1.64±1.10 0.307 Serum creatinine POD 180 (mg/dL)b,c 1.78±0.72 1.83±1.38 0.929 Serum creatinine POD 360 (mg/dL)b,c 1.78±0.78 1.86±1.57 0.885 Urinary PCR at 30thPODb,c 1.76±0.79 1.71±1.35 0.915 Immunosuppression
CI+sodium mycophenolate+steroids 4 18 0.487
Induction+CI+sodium mycophenolate+steroidse 4 18
a
rejection. Perforin and TIM-3 mRNA levels were higher in the acute-rejection group than in non-rejection group (Po0.001) (Panels A and B).
ROC curves were generated to analyze the diagnostic parameters of mRNA expression. The areas under the curve (AUC) observed for the TIM-3 and perforin genes are shown in Figure 2. Analyses of expression for both genes resulted in statistically significant AUCs (Po0.001).
For TIM-3 gene, the diagnostic parameters were sensitiv-ity of 71.4%, specificsensitiv-ity of 67.5%, positive predictive value of 20.2%, and negative predictive value of 95.3% accuracy. Perforin gene diagnostic parameters were sensitivity of 75.0%, specificity of 62.2%, positive predictive value of 18.7%, and negative predictive value of 95.5% accuracy. All 8 episodes of acute rejection presented increased expres-sion of one or both genes. Among the 28 samples obtained
Figure 1.Levels of perforin (A) and TIM-3 mRNA (B) gene expression in peripheral blood leukocytes of kidney allograft recipients
with and without acute rejection. Data are reported as medians, minimum, and maximum values, and 25–75% interquartile range.
Figure 2.Perforin (A) and TIM-3 ROC (B) curves of gene expression in the peripheral blood for acute rejection diagnosis of kidney
in these 8 events, 22 had a raise in the expression in one or both genes (78.6%), 19 had an increased expression in both genes (86.4%), one had isolated increased expression of TIM-3 (4.5%), and 2 samples had isolated increased expression of perforin (9.1%). Combined gene analyses (TIM-3 and perforin) using the same cut-offs as for single gene analyses were performed and resulted in a higher accuracy (76.8%) for the diagnosis of acute rejection (Po0.001).
Time of rejection diagnosis and effects of anti-rejection therapy
Acute rejection was clinically diagnosed in a mean of 9.3 days post-transplantation (range: 7 to 13 days) and the mean time for the molecular diagnosis was 5.3 days (range: 4 to 7 days) (Po0.01). Messenger RNAs
expres-sions were compared at pre- and post-rejection treatment samples. TIM-3 gene median expression dropped 77.1% in the comparison of expression pre- and post-treatment for acute rejection (P=0.001). The drop of the perforin gene expression reached 90.9% in the same comparison (P=0.001).
Discussion
In the present study, we evaluated mRNA expression for the diagnosis of acute rejection of kidney allografts. We found elevated expression of TIM-3 and perforin in patients with acute rejection that anticipated graft dysfunc-tion. An elevated negative predictive value of gene expres-sion analysis for the rejection diagnosis was also observed. However, considerable variation in mRNA expression occurred outside of the rejection episodes.
In the last decade, molecular techniques have been evaluated for the non-invasive diagnosis of renal allograft dysfunction, mainly for the detection of acute rejection, with analyses performed in either peripheral blood or urine (7,9,10). The non-invasive transcriptional approach has been developed in an attempt to avoid the need for allograft biopsy and better monitor the occurrence of graft injuries. However, the vast majority of the studies are cross-sectional and thus do not provide sequential graft evalua-tion and gene expression profile over time.
A number of different genes have been evaluated either in the peripheral blood (7,17,18) or in the urine (8,9,12,19,20) and have been shown to be well correlated in both and with tissue (10,13). Here, we report the longitudinal expression of the well-validated molecules perforin and TIM-3, both expressed by cytotoxic T lym-phocytes (CTLs) that are activated during graft rejection (21,22). Perforin is stored in cytoplasmic granules and subsequently secreted by effector CTL leading to pore formation in the target-cell membrane, ultimately leading to cell death (14). Importantly, increased amounts of perforin protein have been demonstrated by immunostaining in human renal grafts undergoing acute rejection in previous
studies with biopsy samples (23) andfine-needle aspirates (24). TIM-3 is a type I membrane protein preferentially expressed on terminally differentiated Th1 cells that seems to be central in the mechanisms of allograft rejection (15). TIM-3 has been associated with autoimmune diseases, tolerance induction, and to the regulation of Th1 immune responses (25,26). Previous studies have shown that perforin (7,8,10,17) and TIM-3 (12,13) mRNA expression in non-invasive cell samples (peripheral blood and urinary sediment cells) are augmented during acute rejection episodes of kidney grafts. TIM-3 protein expression has not been demonstrated in biopsies of renal transplant recipients. However, increased urinary concentration of soluble TIM-3 was demonstrated by ELISA by Chen and co-workers, in renal transplant recipients with acute rejection (27).
There is a paucity of longitudinal studies profiling non-invasive molecular biomarkers in kidney transplantation aiming at the diagnosis of acute rejection. In the present study, we observed increased mRNA expression of the perforin and TIM-3 genes in peripheral blood samples of patients that underwent acute renal graft rejection. Similarly, in thefirst reported longitudinal study, Simon and collaborators reported that acute cellular rejection could be detected by serial peripheral blood analyses of the perforin and granzyme B increased expression (17). Later, Suthanthiran et al. profiled urinary cell mRNA in the most robust longitudinal study available and have shown that a three-gene signature (18S ribosomal, CD3εmRNA, and interferon-inducible protein 10) discriminated acute cellu-lar rejection from other causes of graft dysfunction (19). From these studies, it is possible to infer that increased mRNA expression of genes involved in the cytolytic attack occurs during acute cellular rejection as demonstrated at the available cross-sectional studies. Also, these studies have all found increased signaling before the clinical diagnosis of rejection. Suthanthiran et al. found that diagnostic gene signature precedes by 20 days the histological diagnosis of graft rejection (19) and Simon et al. described increased gene expression in a median of eleven days before the clinical diagnosis of rejection (17). The KSORT study was conceived to develop a test using a simple blood gene expression assay to detect patients at high risk for AR by using novel reference-based algorithm, using a 13 gene model set. In the KSORT study, although not longitudinally designed, it was also possible to anticipate AR up to three months prior to detection by renal biopsy taken at graft dysfunction (11). Accordingly, in the present study, increased gene expres-sion was also detected before clinical diagnosis.
not attributable to rejection processes (28,29). Similarly, in the present study, the analysis of the expression levels of perforin and TIM-3 in patients with borderline rejection did not exhibit an acute rejection profile.
Another important finding of the present study is the down-regulation of mRNA expression observed in response to rejection treatment. Both perforin and TIM-3 mRNA transcripts decreased significantly upon rejection ther-apy. Similar results were described in cross-sectional studies, evaluating mRNA expression either in renal tissue (30) or in peripheral blood leukocytes (7). Also, in the longitudinal study by Simon et al., it was found that the expression of perforin and granzyme B decreased significantly after rejection treatment (17). Suthanthiran et al. reported that the score of the diagnostic signature for rejection decreased significantly following acute cellular rejection therapy. Interestingly, no association was found with the Banff grade for acute cellular rejection (19). Molecular features are suppressed by treatment more quickly than histopathology lesions, suggesting that they reflect the suppression of graft injury mechanisms better than histopathologic lesions, which can last longer, despite successful treatment (31). Taken together, these findings suggest that the non-invasive gene expression evaluations might become useful in monitoring the efficacy of immunosuppressive treatment of acute rejection.
Some dissimilarities were observed in the analysis of the diagnostic parameters derived from gene expres-sion evaluation. Simon et al. reported that the positive predictive value (PPV) at initial times after transplantation seems to increase overtime (16). Suthanthiran et al. described sensitivity and specificity around 80% (19). In the present study, the diagnostic accuracy was lower than those reported in the previous longitudinal studies. Furthermore, accuracy was substantially lower than that observed in previous cross-sectional surveys. Importantly, and in accordance to Reeve et al., the negative predictive values were elevated indicating that rejection episodes would hardly occur in the absence of increased gene expression (32). The low PPV found in longitudinal studies suggests that high PPV found in cross-sectional studies might be misleading. Accordingly, the study by Simon et al. also reported PPVs that, although higher than those observed in the present study, were substantially lower
than those reported in the cross-sectional studies. Also, in their study, the PPVs were increased by their approach to data reporting, which consisted of separating per period after transplantation and had different cutoff values for each time interval, leading to optimized but perhaps less clinically applicable results (16).
The reasons why prevalence studies show higher accuracy may be related to their strategy in evaluating cases and controls. These studies use a well-defined clinical phenotype (e.g. acute rejection), which is com-parable to other equally well-defined situations, all retro-spectively diagnosed. In this approach, overtime variations of gene expression are not detected. On the other hand, when samples are collected sequentially, variations in gene expression will be detected and will necessarily decrease the test accuracy. For instance, viral infections, including BK polyoma virus, which may be clinically silent, can elicit a TH1 response that involves many of the genes that also participate in the acute rejection phenomena (32). Sub-clinical rejection will not be detected unless sequential protocol biopsies are performed (33–35). Another possible reason for the false-positive results is the power of the molecular tool. It is conceivable that the RT-PCR detects very small, and perhaps not relevant, increments in gene expression.
The present study had weaknesses to be mentioned. Initially, gene selection for analyses was chosen from hypothesis-driven cross-sectional studies. Secondly, pre-transplant samples were not obtained and perhaps would be the ideal for comparisons of the subsequent samples. Thirdly, we did not perform protocol biopsies that could reveal subclinical aggressions and explain increased molec-ular expressions. Moreover, follow-up was restricted to three months. Finally, the study included a limited number of patients and no episodes of antibody-mediated acute rejection occurred in the study sample. In spite of the above, we believe that our study brought up and reinforced relevantfindings such as the high negative predictive value and the effectiveness of the molecular approach for early diagnosis of acute rejection.
In conclusion, we suggest that the molecular non-invasive diagnosis of renal graft dysfunction, although currently not validated, is an approach with potential clinical usefulness and worth developing for future use.
References
1. Lamb KE, Lodhi S, Meier-Kriesche HU. Long-term renal allograft survival in the United States: a critical reappraisal.
Am J Transplant2011; 6: 1226–1235.
2. Nankivell BJ, Alexander SI. Rejection of the kidney allograft.
N Engl J Med2010; 363: 1451–1462, doi: 10.1056/NEJMra 0902927.
3. Solez K, Colvin RB, Racusen LC, Haas M, Sis B, Mengel M, et al. Banff 07 classification of renal allo-graft pathology: updates and future directions. Am J
Transplant 2008; 8: 753–760, doi: 10.1111/j.1600-6143. 2008.02159.x.
6. Anglicheau D, Suthanthiran M. Noninvasive prediction of organ graft rejection and outcome using gene expression patterns.Transplantation2008; 86: 192–199, doi: 10.1097/ TP.0b013e31817eef7b.
7. Vasconcellos LM, Schachter AD, Zheng XX, Vasconcellos LH, Shapiro M, Harmon WE, et al. Cytotoxic lymphocyte gene expression in peripheral blood leukocytes correlates with rejecting renal allografts. Transplantation 1998; 66: 562–566, doi: 10.1097/00007890-199809150-00002. 8. Li B, Hartono C, Ding R, Sharma VK, Ramaswamy R, Qian B,
et al. Noninvasive diagnosis of renal-allograft rejection by measurement of messenger RNA for Perforin and granzyme B in urine.N Engl J Med2001; 344: 947–954, doi: 10.1056/ NEJM200103293441301.
9. Muthukumar T, Dadhania D, Ding R, Snopkowski C, Naqvi R, Lee JB, et al. Messenger RNAfor FOXP3 in the urine of renal-allograft recipients.N Engl J Med2005; 353: 2342–2351, doi: 10.1056/NEJMoa051907.
10. Aquino-Dias EC, Joelsons G, da Silva DM, Berdichevski RH, Ribeiro AR, Veronese FJ, et al. Non-invasive diagnosis of acute rejection in kidney transplants with delayed graft function.Kidney Int2008; 73: 877–884, doi: 10.1038/sj.ki. 5002795.
11. Roedder S, Sigdel T, Salomonis N, Hsieh S, Dai H, Bestard O, et al. The kSORT assay to detect renal transplant patients at high risk for acute rejection: results of the multicenter AART study.PLoS Med2014; 11: e1001759, doi: 10.1371/journal. pmed.1001759.
12. Renesto PG, Ponciano VC, Cenedeze MA, Saraiva Câmara NO, Pacheco-Silva A. High expression of TIM-3 mRNA in urinary cells from kidney transplant recipients with acute rejection.Am J Transplant2007; 7: 1661–1665, doi: 10.1111/ j.1600-6143.2007.01795.x.
13. Manfro RC, Aquino-Dias EC, Joelsons G, Nogare AL, Carpio VN, Gonc¸alves LF. Nonivasive TIM-3 messenger
RNA evaluation in renal transplant recipients with graft dysfunction. Transplantation 2008; 86: 1869–1874, doi: 10.1097/TP.0b013e3181914246.
14. Liu CC, Walsh CM, Young JD. Perforin: structure and function.Immunol Today1995; 16: 194–201, doi: 10.1016/ 0167-5699(95)80121-9.
15. Kuchroo VK, Umetsu DT, DeKruyff RH, Freeman GJ. The TIM gene family: emerging roles in immunity and disease.
Nat Rev Immunol2003; 3: 454–462, doi: 10.1038/nri1111. 16. Livak KJ, Schmittgen TD. Analysis of relative gene expression data using real-time quantitative PCR and the 2 (-DDC(T)) method. Methods 2001; 25: 402–408, doi: 10.1006/meth. 2001.1262.
17. Simon T, Opelz G, Wiesel M, Ott RC, Süsal C. Serial peripheral blood Perforin and granzyme B gene expression measurements for prediction of acute rejection in kidney graft recipients.Am J Transplant2003; 3: 1121–1127, doi: 10.1034/j.1600-6143.2003.00187.x.
18. Sabek O, Dorak MT, Kotb M, Gaber AO, Gaber L. Quantitative detection of T-cell activation markers by real-time PCR in renal transplant rejection and correlation with histopathologic evaluation.Transplantation2002; 74: 701–707, doi: 10.1097/00007890-200209150-00019.
19. Suthanthiran M, Schwartz JE, Ding R, Abecassis M, Dadhania D, Samstein B, et al. Urinary-cell mRNA profile
and acute cellular rejection in kidney allografts.N Engl J Med2013; 369: 20–31, doi: 10.1056/NEJMoa1215555. 20. Hricik DE, Nickerson P, Formica RN, Poggio ED, Rush D,
Newell KA, et al. Multicenter validation of urinary CXCL9 as a risk-stratifying biomarker for kidney transplant injury.
Am J Transplant 2013; 13: 2634–2644, doi: 10.1111/ajt. 12426.
21. Hall BM. Cells mediating allograft rejection.Transplantation
1991; 51: 1141–1151, doi: 10.1097/00007890-199106000-00001.
22. Steinmuller D. Which T cells mediate allograft rejection.
Transplantation1985; 40: 229–233, doi: 10.1097/00007890-198509000-00001.
23. Wagrowska-Danilewicz M, Danilewicz M. Immunoexpres-sion of perforin and granzyme B on infiltrating lymphocytes in human renal acute allograft rejection.Nefrologia. 2003; 23: 538–544.
24. Pascoe MD, Marshall SE, Welsh KI, Fulton LM, Hughes DA. Increased accuracy of renal allograft rejection diagnosis using combined perforin, granzyme B, and Fas ligandfi ne-needle aspiration immunocytology. Transplantation 2000; 69: 2547–2553, doi: 10.1097/00007890-200006270-00013. 25. Sánchez-Fueyo A, Tian J, Picarella D, Domenig C, Zheng XX, Sabatos CA et al. TIM-3 inhibits T helper type 1-mediated auto- and alloimmune responses and promotes immunologi-cal tolerance. Nature Immunol 2003; 4: 1093–1101, doi: 10.1038/ni987.
26. Sabatos CA, Chakravarti S, Cha E, Schubart A, Sánchez-Fueyo A, Zheng XX et al. Interaction of TIM-3 and TIM-3 ligand regulates T helper type 1 responses and induction of peripheral tolerance.Nature Immunol2003; 4: 1102–1110, doi: 10.1038/ni988.
27. Chen D, Peng W, Jiang H, Yang H, Wu J, Wang H, Chen J. Noninvasive detection of acute renal allograft rejection by measurement of soluble Tim-3 in urine.Mol Med Rep2017; 16: 915–921, doi: 10.3892/mmr.2017.6670.
28. de Freitas DG, Sellarés J, Mengel M, Chang J, Hidalgo LG, Famulski KS, et al. The nature of biopsies with "borderline rejection" and prospects for eliminating this category.Am J Transplant 2012; 12: 191–201, doi: 10.1111/j.1600-6143. 2011.03784.x.
29. Halloran PF, Pereira AB, Chang J, Matas A, Picton M, De Freitas D, et al. Potential impact of microarray diagnosis of T cell-mediated rejection in kidney transplants: the INTER-COM study. Am J Transplant 2013; 13: 2352–2363, doi: 10.1111/ajt.12387.
30. Strehlau J, Pavlakis M, Lipman M, Shapiro M, Vasconcellos L, Harmon W, et al. Quantitative detection of immune activation transcripts as a diagnostic tool in kidney transplantation.Proc Natl AcadSci USA1997; 94: 695–700, doi: 10.1073/pnas.94. 2.695.
31. Reeve J, Einecke G, Mengel M, Sis B, Kayser N, Kaplan B, et al. Diagnosing rejection in renal transplants: a comparison of molecular and histopathology-based approaches.Am J Transplant 2009; 9: 1802–1810, doi: 10.1111/j.1600-6143. 2009.02694.x.
33. Lipman ML, Shen Y, Jeffery JR, Gough J, McKenna RM, Grimm PC, et al. Immune-activation gene expression in clinically stable renal allograft biopsies: molecular evidence for subclinical rejection.Transplantation1998; 66: 1673–1681, doi: 10.1097/00007890-199812270-00018.
34. Aquino Dias EC, Veronese FJ, Gonc¸alves LFS, Manfro RC.
Molecular markers in subclinical acute rejection of renal
transplants.Clin Transplant2004; 18: 281–287, doi: 10.1111/ j.1399-0012.2004.00161.x.