rev bras hematol hemoter. 2017;39(2):183–185
w w w . r b h h . o r g
Revista
Brasileira
de
Hematologia
e
Hemoterapia
Brazilian
Journal
of
Hematology
and
Hemotherapy
Letter
to
the
Editor
Stathmin
1
expression
in
plasma
cell
neoplasms
DearEditor,
Multiplemyeloma(MM)isahematologicalmalignancy char-acterizedby clonalproliferation ofmalignant plasma cells whichaccumulateinthebonemarrow,resultinginrecurrent hypercalcemia,anemia,osteolyticlesions,renalfailure,and increasedriskofinfection.1 Stathmin 1,also named onco-protein18(OP18)orleukemia-associatedphosphoproteinp18 (LAP18), is amicrotubule destabilizer that playsan impor-tant role in cell progression, clonogenicity, differentiation andsurvival.2 Stathmin1overexpressionhasbeenreported in hematological malignancies, including acute myeloid leukemia, acute lymphoid leukemia, lymphoma, high-risk myelodysplastic syndromes and primary myelofibrosis.3–7 Functionalstudiesindicatethathighstathmin1expressionis abletosustainrapidcelldivisionandproliferationofleukemia cells,whicharesuppressedbystathmin1inhibition.5,8,9Using themicroarrayapproach,stathmin1hasbeen identifiedas oneof15relevantgenesthatdeterminetheoutcomeinMM patients.10
TheaimofthepresentstudywastoinvestigateStathmin 1 expression in respect to clinical and laboratorial char-acteristics, and outcomes of MM patients. Bone marrow samplescollected from healthy donors(n=21, medianage
A
Stathmin 1 expression in bone marrow cellsMM patients MM patients
5 100 100
80
60
40
20
0 80
60
Low stathmin 1 expression Low stathmin 1 expression High stathmin 1 expression High stathmin 1 expression
p=0.86 p=0.63
40
20
0 10
0 20 30 40 50 60 70 0 10 20 30 40 50 60 70 80 4
3
2
1
0
Healthy donor
n=21 Months Months
PCL n=4 MM
n=30
Relative lev
e
l of
stathmin 1
mRNA expression
Progression free survival, %
Overall survival, %
C
B
Figure1–Stathmin1expressioninplasmacellneoplasms.(A)QuantitativepolymerasechainreactionanalysisofStathmin
1mRNAexpressioninbonemarrowcellsfromhealthydonors,andfrompatientswithmultiplemyeloma(MM)orplasma
cellleukemia(PCL).Thehypoxanthinephosphoribosyltransferase1genewasusedasthereferencegeneandahealthydonor
wasusedasacalibratorsample.Horizontallinesindicatemedians.Progressionfreesurvival(B)andoverallsurvival(C)of
MMpatientsstratifiedbymedianStathmin1expression.p-ValueswerecalculatedbytheLong-ranktest.
33 years;range: 18–69),MMpatients(n=30;medianage 64 years;range:45–86)andplasmacellleukemiapatients(PCL;
n=4;medianage72years;range:68–84)were analyzed.All patients included in the study were untreated atthe time of sample collection. Patients’ characteristics are listed in
Table1.Allhealthycontrolsandpatientsprovidedinformed
writtenconsentandthestudywasapprovedbytheResearch EthicsCommitteeoftheUniversidadeEstadualdeCampinas. MM patients received cyclophosphamide, thalidomide and dexamethasone (CTD; n=15), bortezomib, thalidomide and dexamethasone(VTD;n=1),CTD/VTD(n=4),ormelphalan, prednisoloneandthalidomide(MPT;n=9)protocoltreatments orwatchfulwaiting(n=1).TotalRNAwasobtainedfromtotal bonemarrowcellsafterremovaloferythrocytesbyhemolysis usingtheTRIzolreagent(Invitrogen,Carlsbad,CA,USA).The genomicDNAwaseliminatedusingDNAseItreatment (Invit-rogen).ThecDNAwasobtainedfrom1gofRNAusingthe
RevertAidTMFirstStrandcDNASynthesisKit(MBIFermentas,
184
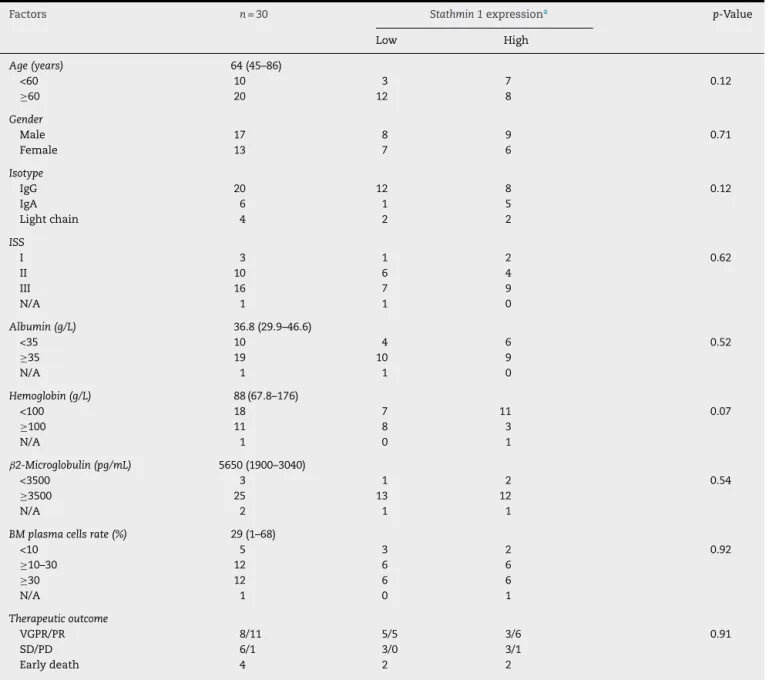
revbrashematolhemoter.2017;39(2):183–185Table1–TheassociationbetweenclinicalandlaboratorialcharacteristicsofmultiplemyelomapatientsandStathmin1
expression.
Factors n=30 Stathmin1expressiona p-Value
Low High
Age(years) 64(45–86)
<60 10 3 7 0.12
≥60 20 12 8
Gender
Male 17 8 9 0.71
Female 13 7 6
Isotype
IgG 20 12 8 0.12
IgA 6 1 5
Lightchain 4 2 2
ISS
I 3 1 2 0.62
II 10 6 4
III 16 7 9
N/A 1 1 0
Albumin(g/L) 36.8(29.9–46.6)
<35 10 4 6 0.52
≥35 19 10 9
N/A 1 1 0
Hemoglobin(g/L) 88(67.8–176)
<100 18 7 11 0.07
≥100 11 8 3
N/A 1 0 1
ˇ2-Microglobulin(pg/mL) 5650(1900–3040)
<3500 3 1 2 0.54
≥3500 25 13 12
N/A 2 1 1
BMplasmacellsrate(%) 29(1–68)
<10 5 3 2 0.92
≥10–30 12 6 6
≥30 12 6 6
N/A 1 0 1
Therapeuticoutcome
VGPR/PR 8/11 5/5 3/6 0.91
SD/PD 6/1 3/0 3/1
Earlydeath 4 2 2
ISS:InternationalStagingSystem;BM:bonemarrow;VGPR:verygoodpartialresponse;PR:partialresponse;SD:stabledisease;PD:progressive disease.
a MultiplemyelomapatientsweredividedintogroupsbasedonStathmin1expression;LowStathmin1expressionwasdefinedaslowermedian
valuesandhighStathmin1expressionwasdefinedashighermedianvalues.
phosphoribosyltransferase 1 (HPRT1) (FW: GAACGTCTTGCTC-GAGATGTGA; RV: TCCAGCAGGTCAGCAAAGAAT) and the Maxima Sybr green qPCR system (MBI Fermentas). HPRT1
wasusedasthegenereference.ReactionconditionsforRNA extraction,cDNAsynthesisandqPCRwereperformed accord-ingtothemanufactures’instructions.Anegative‘notemplate control’wasincludedforeachprimerpair.Thedissociation protocolwasperformedattheendofeachruntocheckfor nonspecific amplification. Three replicas were run on the sameplateforeachsample.Therelativegeneexpressionwas calculatedusingtheequation,2−CT.11Additionaldetailsof qPCRexperimentswillbeprovideduponrequest.Astatistical analysiswasperformedusingGraphPadPrism5(GraphPad Software, Inc., San Diego, CA, USA). For comparisons, the
Kruskal–WallistestwithDunn’sposttestwasusedfor mea-sured variables with three levels and the chi-squared test wasusedforcategoricalvariables.Coxregressionwasused toestimateoverallsurvival(OS)andprogressionfreesurvival (PFS). OSwasdefinedasthe time(inmonths) betweenthe dateofsamplingandthedateofdeath(fordeceasedpatients) or last follow-up (for censored patients). PFS was defined asthetime(inmonths)betweenthesamplingandthedate of the first event (symptomatic progression based on the InternationalMyelomaWorkingGroupcriteria12ordeath)or last follow-up (for censored patients). A p-value<0.05 was consideredstatisticallysignificant.
revbrashematolhemoter.2017;39(2):183–185
185
MM(median:0.86:range: 0.30–2.89) and PCL(median:0.79; range:0.41–4.38)patients(p-value>0.05;Figure1A).To eval-uatethecorrelationofStathmin1expressionwithclinicaland laboratorialfactorsfurther,MMpatientsweredividedintotwo groupsbased on medianStathmin 1levels: high Stathmin 1
expression(median:1.43;range:0.89–2.89)andlowStathmin 1expression(median:0.62;range:0.30–0.83).Inourcohortof MMpatients,noassociationswereobservedbetween Stath-min1expressionand clinicalfactors,laboratorialfactorsor therapyresponseratios(Table1).Stathmin1expressiondid notaffectPFS(lowStathmin1expressionversushigh Stath-min1expression–hazardratio:1.08;95%confidenceinterval: 0.46–2.53;p-value=0.87) nor OS (lowStathmin 1 expression versushigh Stathmin1expression– hazardratio:0.77;95% confidenceinterval:0.28–2.18;p-value=0.68)(Figure1BandC). Insummary,ourfindingssuggestthatStathmin1 expres-sionisnotdifferentlyexpressedinplasmacellneoplasmsand hasnoimpactupon MMoutcomes whenconsideredas an isolatedfactor.TheseresultshighlightthatStathmin1 over-expressionmaybelinkedtohigh proliferatehematological malignanciesasMMischaracterizedbyslowproliferationof malignantplasmacellsinthebonemarrow.13,14Futurestudies usinglargercohortsandfunctionalinvestigationsare neces-sarybeforedisregardingtheinvolvementofStathmin1inthe malignantphenotypeofplasmacellneoplasms.
Conflict
of
interest
Theauthorsdeclarenoconflictsofinterest.
r
e
f
e
r
e
n
c
e
s
1. PalumboA,AndersonK.Multiplemyeloma.NEnglJMed.
2011;364(11):1046–60.
2. BellettiB,BaldassarreG.Stathmin:aproteinwithmanytasks.
Newbiomarkerandpotentialtargetincancer.ExpertOpin
TherTargets.2011;15(11):1249–66.
3. HanashSM,StrahlerJR,KuickR,ChuEH,NicholsD.
Identificationofapolypeptideassociatedwiththemalignant
phenotypeinacuteleukemia.JBiolChem.
1988;263(26):12813–5.
4. RoosG,BrattsandG,LandbergG,MarklundU,GullbergM.
Expressionofoncoprotein18inhumanleukemiasand
lymphomas.Leukemia.1993;7(10):1538–46.
5. Machado-NetoJA,deMeloCamposP,FavaroP,LazariniM,
Lorand-MetzeI,CostaFF,etal.Stathmin1isinvolvedinthe
highlyproliferativephenotypeofhigh-riskmyelodysplastic
syndromesandacuteleukemiacells.LeukRes.
2014;38(2):251–7.
6. NylanderK,MarklundU,BrattsandG,GullbergM,RoosG.
Immunohistochemicaldetectionofoncoprotein18(Op18)in
malignantlymphomas.HistochemJ.1995;27(2):155–60.
7. Machado-NetoJA,deMeloCamposP,FavaroP,LazariniM,da
SilvaSantosDuarteA,Lorand-MetzeI,etal.Stathmin1
inhibitionamplifiesruxolitinib-inducedapoptosisin
JAK2V617Fcells.Oncotarget.2015;6(30):29573–84.
8.JehaS,LuoXN,BeranM,KantarjianH,AtwehGF.Antisense
RNAinhibitionofphosphoproteinp18expressionabrogates
thetransformedphenotypeofleukemiccells.CancerRes.
1996;56(6):1445–50.
9.IancuC,MistrySJ,ArkinS,WallensteinS,AtwehGF.Effectsof
stathmininhibitiononthemitoticspindle.JCellSci.
2001;114(Pt5):909–16.
10.DecauxO,LodeL,MagrangeasF,CharbonnelC,GouraudW,
JezequelP,etal.Predictionofsurvivalinmultiplemyeloma
basedongeneexpressionprofilesrevealscellcycleand
chromosomalinstabilitysignaturesinhigh-riskpatientsand
hyperdiploidsignaturesinlow-riskpatients:astudyofthe
IntergroupeFrancophoneduMyelome.JClinOncol.
2008;26(29):4798–805.
11.LivakKJ,SchmittgenTD.Analysisofrelativegeneexpression
datausingreal-timequantitativePCRandthe2(−DeltaDelta
C(T))Method.Methods.2001;25(4):402–8.
12.KyleRA,RajkumarSV.Criteriafordiagnosis,staging,risk
stratificationandresponseassessmentofmultiplemyeloma.
Leukemia.2009;23(1):3–9.
13.PuthierD,Pellat-DeceunynckC,BarilleS,RobillardN,Rapp
MJ,Juge-MorineauN,etal.DifferentialexpressionofBcl-2in
humanplasmacelldisordersaccordingtoproliferationstatus
andmalignancy.Leukemia.1999;13(2):289–94.
14.ScudlaV,OrdeltovaM,BacovskyJ,VytrasovaM,HorakP,
MinarikJ.Therelationshipbetweenproliferationand
apoptosisinpatientswithmonoclonalgammopathyof
undeterminedsignificanceormultiplemyeloma.
Haematologica.2005;90(12):1713–4.
JoãoAgostinhoMachado-Netoa,FernandoVieiraPericolea, FernandoFerreiraCostaa,FabiolaTrainaa,b,
SaraTeresinhaOlallaSaada,∗
aUniversidadeEstadualdeCampinas/Hemocentro(UNICAMP),
Campinas,SP,Brazil
bUniversidadedeSãoPaulo(USP),RibeirãoPreto,SP,Brazil
∗Correspondingauthorat:HematologyandHemotherapy
Cen-ter,University ofCampinas (UNICAMP),RuaCarlosChagas, 480,CEP13083-878,Campinas,SP,Brazil.
E-mails:[email protected](J.A.Machado-Neto),
[email protected](S.T.OlallaSaad).
Received21October2016 Accepted8February2017 Availableonline11March2017
1516-8484/
©2017Associac¸ ˜aoBrasileiradeHematologia,Hemoterapiae TerapiaCelular.PublishedbyElsevierEditoraLtda.Thisisan openaccessarticleundertheCCBY-NC-NDlicense(http://
creativecommons.org/licenses/by-nc-nd/4.0/).