http://dx.doi.org/10.1590/1519-6984.16012 Original Article
Ichthyofauna as bioindicator of environmental quality in an
industrial district in the amazon estuary, Brazil
Viana, AP.* and Lucena Frédou, F.
Universidade Federal do Pará – UFPA, Av. Bernado Sayão, 1, Guamá, CEP 66075-110, Belém, PA, Brazil *e-mail: [email protected]
Received July 31, 2012 – Accepted March 22, 2013 – Distributed May 31, 2014 (With 4 figures)
Abstract
The objective of the present study was to describe the ecological status of ichthyofauna in an industrial district (Pará
river, Amazon estuary), through the use of different environmental descriptors. To evaluate the impacts of the industrial area and cargo terminal, three areas were considered: Zone 1 (maximum impact), Zone 2 (median impact) and Zone 3 (low impact). A total of 77 species were captured. Differences in the composition of the ichthyofauna were recorded between Zones and environments (main channel and tidal channel). The ecological indices revealed clear evidence of the impact of the industrial hub and cargo terminal on the fish communities. In Zone 1, there was a reduction in the number of feeding groups (in the main channel) and larger fish and the Shannon diversity index and Margalef’s richness were also significantly lower. The multivariate analysis separated the different Zones clearly into three groups,
indicating marked differences in the levels of contamination in the different parts of the study area. Keywords: community fish, habitat use, Pará River, industrial hub.
Ictiofauna com indicador biológico estuarino em um distrito
industrial, estuário amazônico, Brasil
Resumo
O objetivo deste trabalho foi descrever o status ecológico da ictiofauna em um distrito industrial (rio Pará, estuário
Amazônico), através do uso de diferentes descritores ambientais. Para avaliar o impacto da zona industrial e terminal de cargas, três áreas foram consideradas: Zona 1 (máximo impacto), Zona 2 (médio risco) e Zona 3 (baixo impacto).
Um total de 77 espécies foi capturado. Diferenças na composição da ictiofauna foram encontradas em todas as zonas
e ambientes (canal principal e canal de maré). Os índices ecológicos revelaram alterações da comunidade de peixes na área do distrito industrial. Na Zona 1 houve uma redução no número de categorias tróficas (no canal principal) e de peixes de grande porte e o índice de diversidade de Shannon e a riqueza de Margalef foram significativamente mais baixos. A análise multivariada separou as Zonas em três grupos, indicando diferenças marcantes no nível de
contaminação nas diferentes áreas de estudo.
Palavras-chave: comunidade de peixe, uso do habitat, Rio Pará, área industrial.
1. Introduction
The Amazon estuary is the oceanic outlet of the
World’s largest hydrographic basin, with a total discharge equivalent to approximately one sixth of that of all the rivers in the World combined, containing one fifth of all the freshwater released into the planet’s oceans
(Martinelli et al., 1989). The dynamics of this estuary
reflect the force of this discharge into the Atlantic Ocean,
which is so strong that seawater rarely passes through the mouth of the river (Nittrouer et al., 1995). The
composition of the region’s ichthyofauna is influenced by seasonal fluctuations in salinity levels and the turbidity
of the water, which is controlled by the estuarine plume (Barthem, 1985). Within the Amazon estuary, more
precisely in the estuary of the Pará River, an important industrial hub is located, where activities include the processing of kaolin, alumina and aluminum for export. These processes produce residues which may liberate
substances with significant impacts on the quality of the
water (Rubio and Tessele, 2002). The principal sources of risk include leaks from tanks and pipelines, accidental
spills of toxic substances and the overflowing of residue
sedimentation pools, all of which have been recorded in the study area since the establishment of the industrial installations (Lima et al., 2011).
A number of studies have shown that the degradation of
may lead to a reduction in the abundance of commercially-important species, resulting in economic and social problems for local communities (Kennish, 1985; Blaber, 2000).
Estuarine environments, in particular that of the Amazon, which surrounds the cargo terminal, are characterised by high primary and secondary productivity and provide
nurseries for numerous species of fish and other aquatic
organisms, many of which are of commercial value. This study area is an estuarine environment with a considerable
freshwater input, being classified as a tidal freshwater
estuary according to the scheme of Elliott and McLusky
(2002). Despite the intense industrial activity at the estuary
of the Pará River, the area is an important artisanal fishing
ground and the local population is highly dependent on
fishery resources (Paz et al., 2011). In addition to its socio-economic importance, the area plays an important ecological role in the reproduction, feeding and development
of many fish species.
Biological monitoring is a method of assessing water
quality through the responses of biological communities to
changes in environmental conditions (Whitfield and Elliott, 2002; Goulart and Callisto, 2003). Fish can be effective bioindicators and have been used successfully for the
assessment of the quality of many freshwater environments
in the Amazon basin and estuarine environments, in the case Guajará Bay (Viana et al., 2010). In the present study,
to diagnose the environmental quality in an industrial
district in the Amazon estuary, the icthyofauna was used as bioindicator, through the use of different ecological descriptors.
2. Material and Methods
2.1 Study area and data collection
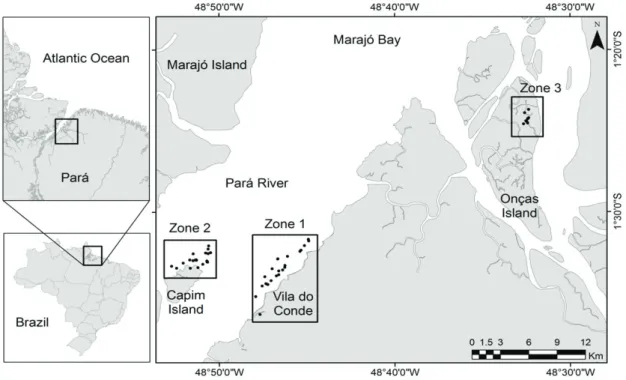
The study area is located on the right bank of the estuary Pará River in the Brazilian state of Pará, the Amazon estuary.
This work was designed to test the effects of the probable environmental contamination in the area adjacent to the industrial installations and cargo terminal in the estuary of
the Pará River. For this, the collection fish specimens were
organised in three distinct Zones, representing different levels of impact: Zone 1, located in the vicinity of the cargo terminal and industrial district (Figure 1), where the risk of contamination was highest; Zone 2, adjacent to
Capim Island (Figure 1), distant at 16.98 km of the cargo
terminal and industrial district, classified as a median
risk area due to its relative proximity to the Zone 1 and
Zone 3, located in Onças Island (Figure 1), at 38.42 km
of the cargo terminal and industrial district, classified as
minimum risk due to its distance from Zone 1.
Two different types of environment – the main river channel and tidal channel – were sampled in all three Zones. Samples were collected every three months, between
2009 (June and September) and 2010 (January and April), covering the region’s principal climatic periods: rainy-dry transition (R-D), dry season, dry-rainy transition (D-R) and rainy season (R). All samples were collected during
neap tides in all Zones for each climatic period.
Different sampling protocols were used in the main
channel and tidal channel, due to their distinct dynamics. In
the channel, monofilament gillnets with different stretched mesh sizes were used (25, 35 and 40 mm) and the total
net was 133.2 m. The nets were allowed to drift for an
average soak time of 1 h 30 min. In the tidal channel, a block net (25 mm mesh size) was set at the mouth of the
tidal channel, closing it completely. Blocking was initiated at the end of the high tide and continued throughout the entire ebb tide cycle (c. 6 h). The fish were caught either
by being gilled in the net (smaller specimens) or collected
manually in the pools remaining near the net. All specimens were stored on ice and transported to the laboratory for processing. Samples were standardised for all study areas and environments.
2.2 Data analysis
The fish specimens were identified to the lowest
possible taxonomic level, based on FAO (1992) and
Keith et al. (2000).
For the evaluation of areas subject to different levels of
contamination (Zones 1, 2 and 3), the data were analysed
in the context of environmental differences (main channel
and tidal channel). The main channel and tidal channel
habitats were analysed separately due to the ecological
differences found between them and the consequent
possibility of different responses to anthropogenic impacts (Viana et al., 2010). Seasonal variation was considered
as replicates since no significant difference was reported
between periods of the year for the biological analysis.
The individuals were classified by size, following Viana et al. (2010). Species captured with total length of
less than 15 cm were classified as small, those between 15 cm and 30 cm in length as medium and fish over 30
cm in length as large. Variation in the body size of the different species among Zones was analyzed using the Kruskal-Wallis test.
The frequency of occurrence of the different fish species
was evaluated based on the scheme proposed by Dajoz
(1973). Species with a frequency of occurrence of ≥50% were classified as constant, those with a frequency between 25 and 50% as accessory and those with a frequency of
<25% as occasional.
Feeding functional groups, based on feeding preferences
and strategies, were defined for each area. For this, species
were allocated to feeding groups (based on Krumme et al., 2004 and Elliott et al., 2007): zooplanktivore (ZP); detritivore
(DV); piscivore (PV); zoobenthivore (ZB); opportunist/ omnivore (OP). Two additional categories were included piscivore/zoobenthivore (PV/ZB). The trophic categories were identified by combining the regional information
available on predominant diet (Krumme et al., 2004; Brenner and Krumme, 2007; Raiol, 2007, Almeida et al., 2010, Barbosa et al., 2012) and stomach examination of several species. Where little information was available, trophic preferences were inferred from data gathered by the Fishbase project (Froese and Pauly, 2007). The percentage contribution of each functional category to the total species richness and individual abundance was calculated for each area. The results were compared among
groups in order to assess the prevailing feeding strategies
adopted by fish community.
The Catch per Unit of Effort (CPUE) was used to assess the relative abundance of fish in the main channel,
while density was used for the tidal channel. The CPUE values were based on the numerical abundance or density (number of individuals, n) and biomass (total weight, b). For the main channel, CPUE = 100n or b (ATi)–1, where
A is net length in metres, and Ti is soak time in minutes.
In the case of the tidal channel, the density index was
obtained by n or b/Ai, where Ai is the flooded area, which was estimated for each tidal channel at the peak of the high tide during the neap tide.
Shannon’s diversity index (H’), Pielou’s evenness index (J), Simpson’s index (l), total species present (S)
and Margalef’s index (D) were used to assess community
structure.
The differences in the values of these indices among the different study Zones were evaluated using one-way ANOVA.
When necessary, the data were log (x+1) transformed to make the normality and variance homogeneous. Tukey’s test was used to determine the normality and Bartlett’s test
was used to determine the homogeneity of the variances.
Differences were further explored with Tukey’s post hoc test. For nonparametric data, the Kruskal-Wallis analysis of variance was used.
A multivariate multidimensional scaling (MDS) analysis was used to evaluate the effects of spatial (Zones) in species
composition and to identify distinct groups. Groups were
subsequently examined using the similarity percentages analysis (SIMPER). All groups were also tested using the analysis of similarities two-way nested ANOSIM (Clarke and Warwick, 1994). Catch per unit of effort (CPUE) was used as data entry for multivariate analyses.
3. Results
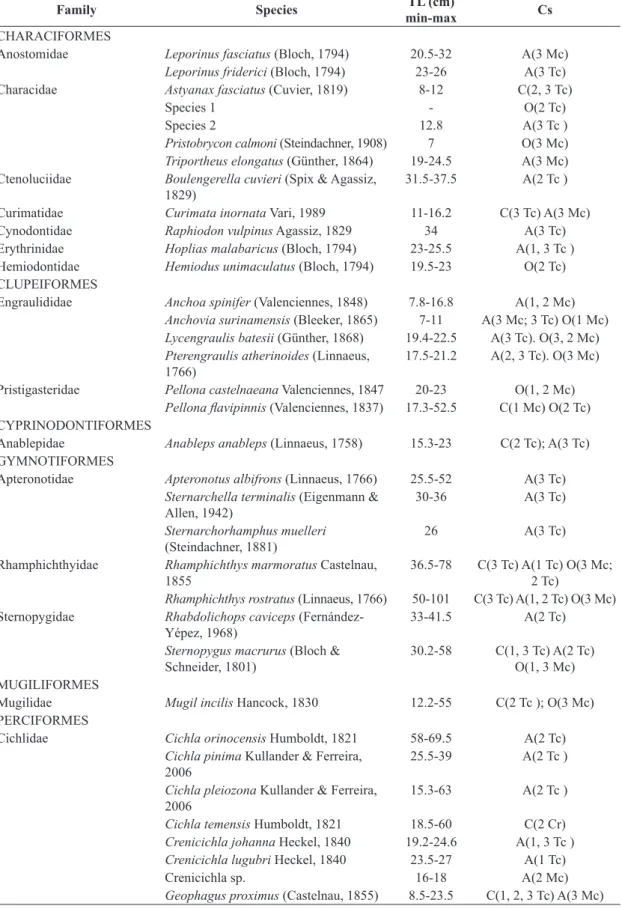
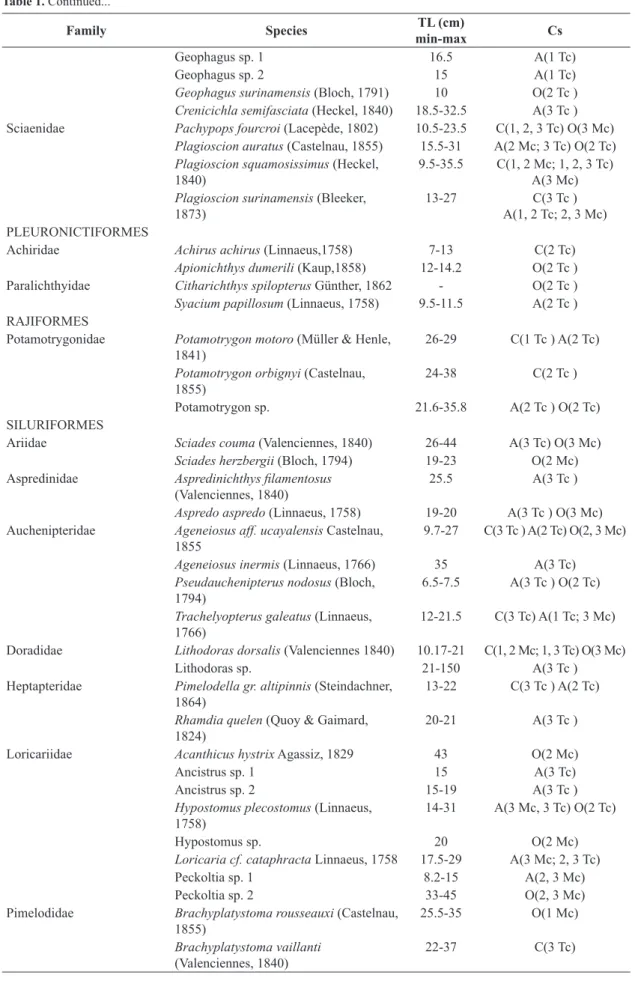
A total of 1.708 fish specimens belonging to 77 species,
27 families and 10 orders were captured. Considering both main channel and tidal channel, 23 species were captured in Zone 1, 49 in Zone 2, and 50 in Zone 3 (Table 1). The Plagioscion squamosissimus (Heckel, 1840) [22.1% of the total] and Lithodoras dorsalis (Valenciennes, 1840)
[with 21.7% of the total] were the most abundant species. Medium-sized fish predominated in all Zones, with an overall average 65.6%. Large fish were least common in Zone 1, whereas small fish were least common in Zone 3. The largest proportion of species classified as constant was recorded in Zone 1, in both main (33.3%) and tidal channels (44.4%). Accessory species predominated in Zone 3, in both main (44%) and tidal channel (62.7%), while
occasional species were common in all Zones, principally the main channel (Table 1).
The CPUE values for both numerical abundance and
biomass indicated a significantly higher abundance in Zone 1 for main channel (ANOVA, p < 0.05). For tidal
Table 1. Species captured in the estuary of Pará River (Amazon estuary). Total length (TL) minimum and maximum; constancy of species (Cs): C – Constant; A – accessory; O – occasional; Mc – Main channel; Tc – Tidal Channel; 1 – Zone 1; 2 – Zone 2; 3 – Zone 3.
Family Species TL (cm)
min-max Cs
CHARACIFORMES
Anostomidae Leporinus fasciatus (Bloch, 1794) 20.5-32 A(3 Mc)
Leporinus friderici (Bloch, 1794) 23-26 A(3 Tc)
Characidae Astyanax fasciatus (Cuvier, 1819) 8-12 C(2, 3 Tc)
Species 1 - O(2 Tc)
Species 2 12.8 A(3 Tc )
Pristobrycon calmoni (Steindachner, 1908) 7 O(3 Mc) Triportheus elongatus (Günther, 1864) 19-24.5 A(3 Mc) Ctenoluciidae Boulengerella cuvieri (Spix & Agassiz,
1829) 31.5-37.5 A(2 Tc )
Curimatidae Curimata inornata Vari, 1989 11-16.2 C(3 Tc) A(3 Mc)
Cynodontidae Raphiodon vulpinus Agassiz, 1829 34 A(3 Tc)
Erythrinidae Hoplias malabaricus (Bloch, 1794) 23-25.5 A(1, 3 Tc )
Hemiodontidae Hemiodus unimaculatus (Bloch, 1794) 19.5-23 O(2 Tc)
CLUPEIFORMES
Engraulididae Anchoa spinifer (Valenciennes, 1848) 7.8-16.8 A(1, 2 Mc)
Anchovia surinamensis (Bleeker, 1865) 7-11 A(3 Mc; 3 Tc) O(1 Mc) Lycengraulis batesii (Günther, 1868) 19.4-22.5 A(3 Tc). O(3, 2 Mc) Pterengraulis atherinoides (Linnaeus,
1766) 17.5-21.2 A(2, 3 Tc). O(3 Mc)
Pristigasteridae Pellona castelnaeana Valenciennes, 1847 20-23 O(1, 2 Mc)
Pellona flavipinnis (Valenciennes, 1837) 17.3-52.5 C(1 Mc) O(2 Tc)
CYPRINODONTIFORMES
Anablepidae Anableps anableps (Linnaeus, 1758) 15.3-23 C(2 Tc); A(3 Tc)
GYMNOTIFORMES
Apteronotidae Apteronotus albifrons (Linnaeus, 1766) 25.5-52 A(3 Tc)
Sternarchella terminalis (Eigenmann &
Allen, 1942) 30-36 A(3 Tc)
Sternarchorhamphus muelleri
(Steindachner, 1881) 26 A(3 Tc)
Rhamphichthyidae Rhamphichthys marmoratus Castelnau, 1855
36.5-78 C(3 Tc) A(1 Tc) O(3 Mc;
2 Tc)
Rhamphichthys rostratus (Linnaeus, 1766) 50-101 C(3 Tc) A(1, 2 Tc) O(3 Mc) Sternopygidae Rhabdolichops caviceps
(Fernández-Yépez, 1968) 33-41.5 A(2 Tc)
Sternopygus macrurus (Bloch &
Schneider, 1801) 30.2-58 C(1, 3 Tc) A(2 Tc) O(1, 3 Mc) MUGILIFORMES
Mugilidae Mugil incilis Hancock, 1830 12.2-55 C(2 Tc ); O(3 Mc)
PERCIFORMES
Cichlidae Cichla orinocensis Humboldt, 1821 58-69.5 A(2 Tc)
Cichla pinima Kullander & Ferreira, 2006
25.5-39 A(2 Tc )
Cichla pleiozona Kullander & Ferreira, 2006
15.3-63 A(2 Tc )
Cichla temensis Humboldt, 1821 18.5-60 C(2 Cr)
Crenicichla johanna Heckel, 1840 19.2-24.6 A(1, 3 Tc ) Crenicichla lugubri Heckel, 1840 23.5-27 A(1 Tc)
Crenicichla sp. 16-18 A(2 Mc)
Family Species TL (cm)
min-max Cs
Geophagus sp. 1 16.5 A(1 Tc)
Geophagus sp. 2 15 A(1 Tc)
Geophagus surinamensis (Bloch, 1791) 10 O(2 Tc ) Crenicichla semifasciata (Heckel, 1840) 18.5-32.5 A(3 Tc )
Sciaenidae Pachypops fourcroi (Lacepède, 1802) 10.5-23.5 C(1, 2, 3 Tc) O(3 Mc)
Plagioscion auratus (Castelnau, 1855) 15.5-31 A(2 Mc; 3 Tc) O(2 Tc) Plagioscion squamosissimus (Heckel,
1840) 9.5-35.5 C(1, 2 Mc; 1, 2, 3 Tc) A(3 Mc)
Plagioscion surinamensis (Bleeker,
1873) 13-27 A(1, 2 Tc; 2, 3 Mc)C(3 Tc ) PLEURONICTIFORMES
Achiridae Achirus achirus (Linnaeus,1758) 7-13 C(2 Tc)
Apionichthys dumerili (Kaup,1858) 12-14.2 O(2 Tc )
Paralichthyidae Citharichthys spilopterus Günther, 1862 - O(2 Tc )
Syacium papillosum (Linnaeus, 1758) 9.5-11.5 A(2 Tc )
RAJIFORMES
Potamotrygonidae Potamotrygon motoro (Müller & Henle,
1841) 26-29 C(1 Tc ) A(2 Tc)
Potamotrygon orbignyi (Castelnau,
1855) 24-38 C(2 Tc )
Potamotrygon sp. 21.6-35.8 A(2 Tc ) O(2 Tc)
SILURIFORMES
Ariidae Sciades couma (Valenciennes, 1840) 26-44 A(3 Tc) O(3 Mc)
Sciades herzbergii (Bloch, 1794) 19-23 O(2 Mc)
Aspredinidae Aspredinichthys filamentosus
(Valenciennes, 1840) 25.5 A(3 Tc )
Aspredo aspredo (Linnaeus, 1758) 19-20 A(3 Tc ) O(3 Mc) Auchenipteridae Ageneiosus aff. ucayalensis Castelnau,
1855
9.7-27 C(3 Tc ) A(2 Tc) O(2, 3 Mc)
Ageneiosus inermis (Linnaeus, 1766) 35 A(3 Tc)
Pseudauchenipterus nodosus (Bloch,
1794) 6.5-7.5 A(3 Tc ) O(2 Tc)
Trachelyopterus galeatus (Linnaeus,
1766) 12-21.5 C(3 Tc) A(1 Tc; 3 Mc)
Doradidae Lithodoras dorsalis (Valenciennes 1840) 10.17-21 C(1, 2 Mc; 1, 3 Tc) O(3 Mc)
Lithodoras sp. 21-150 A(3 Tc )
Heptapteridae Pimelodella gr. altipinnis (Steindachner,
1864) 13-22 C(3 Tc ) A(2 Tc)
Rhamdia quelen (Quoy & Gaimard,
1824) 20-21 A(3 Tc )
Loricariidae Acanthicus hystrix Agassiz, 1829 43 O(2 Mc)
Ancistrus sp. 1 15 A(3 Tc)
Ancistrus sp. 2 15-19 A(3 Tc )
Hypostomus plecostomus (Linnaeus,
1758) 14-31 A(3 Mc, 3 Tc) O(2 Tc)
Hypostomus sp. 20 O(2 Mc)
Loricaria cf. cataphracta Linnaeus, 1758 17.5-29 A(3 Mc; 2, 3 Tc)
Peckoltia sp. 1 8.2-15 A(2, 3 Mc)
Peckoltia sp. 2 33-45 O(2, 3 Mc)
Pimelodidae Brachyplatystoma rousseauxi (Castelnau,
1855) 25.5-35 O(1 Mc)
Brachyplatystoma vaillanti
(Valenciennes, 1840) 22-37 C(3 Tc)
values, which were significantly different from those of the other Zones (Kruskal-Wallis,p < 0.05).
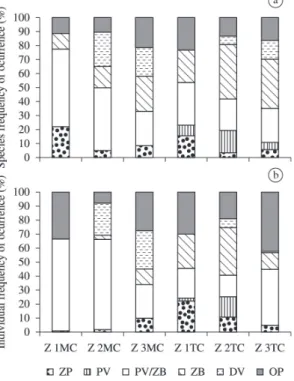
Considering the different feeding functional groups, there was a predominance of piscivore/zoobenthivore (PV/
ZB) and zoobenthivore (ZB) species in all areas, in terms
of the percentage of species, except in Zone 1 in the main
channel. The Zooplanktivorous (ZP) were also relatively important in Zone 1. The Piscivorous (PV) were not
captured in the channel in any of the three Zones and the lowest diversity of feeding groups was recorded in Zone 1 (Figure 2a). Similar patterns are observed when individuals rather than species are considered, with a predominance of the PV/ZB and ZB categories, although opportunists/ omnivores were prominent in both the main channel and tidal channel of Zone 3 (Figure 2b).
Comparing the main channel of Zone 1 with those of
the other Zones, all indices were significantly different (ANOVA, p < 0.05), except for evenness. The post test identified significantly lower values for species richness Shannon’s and Margalef’s index and higher values for abundance, dominance and Simpson’s index (Figure 3). In
the case of the tidal channel, significant differences were
found only for species richness and evenness, with lower values being recorded for the latter parameter in Zone 3
(ANOVA, p < 0.05), but much higher species richness in
comparison with Zone 1 (Figure 3).
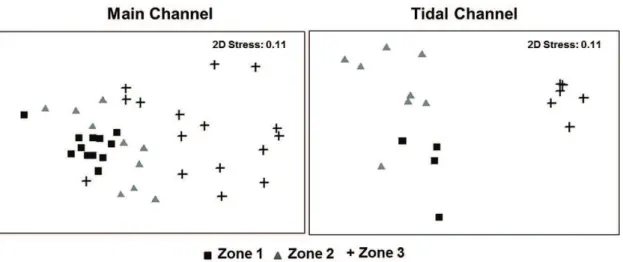
The multivariate analysis identified distinct groups between three area in both main channel (ANOSIM, p < 0.05) and tidal channel (ANOSIM, p < 0.05) with significantly different habitats showed by ANOSIM test (Figure 4). The main species responsible for the discrimination of these groups was, in the main channel, Lithodoras dorsalis,
Plagioscion squamosissimus and Pellona flavipinnis (zones
1×2 and 1×3) and, in the tidal channel, Hypophthalmus marginatus and Sternopygus macrurus (for zones 1×2) and L. dorsalis and P. squamosissimus (for zones 1×3).
4. Discussion
Human activities in estuarine environments tend to have negative effects on the local biota. Together with other waste, pollutants circulate extensively under the
influence of the river discharge and tidal currents, often resulting in concentrations well above legally-defined
limits (Whitfield and Elliott, 2002; Eddy, 2005), although in most cases, few data are available on the integrity of these environments.
In spite of the considerable impacts that have affected
the study area since the construction of the local port by
the Pará Dock Company and the subsequent installation
of mineral ore-processing industries, the ichthyofauna of the estuary of the Pará River is characterized by a considerable diversity, with a total of 77 species being recorded within the study area. However, this diversity
was much lower in the area closest to the port (Zone 1),
where only 23 species were recorded, in comparison with
Family Species TL (cm)
min-max Cs
Hypophthalmus marginatus Valencie nnes, 1840
16.8-40 C(1, 3 Tc) O(1, 2 Mc)
Pimelodus blochii Valenciennes, 1840 16.8-22 C(3 Tc ) O(2, 3 Mc) Platystomatichthys sturio (Kner, 1858) 25 A(3 Tc ) Propimelodus aff. eigenmanni (Van der
Stigchel, 1946) 22.5 A(3 Tc )
TETRAODONTIFORMES
Tetraodontidae Colomesus psittacus (Bloch &
Schneider, 1801) 10.5 O(2 Tc )
Table 1. Continued...
the less impacted areas, which presented fauna typical of other tropical estuarine environments (Barthem, 1985; Krumme et al., 2004; Paiva et al., 2008; Viana et al., 2010).
In general, constant species were more numerous in
the tidal channel than the main channel. These species spend their whole life cycle in these habitats, which are more favourable to their development, given the relative abundance of refuges and feeding resources (Ruffino, 2004; Viana et al., 2010). However, as observed in Guajará Bay, which is adjacent to the present study area, tidal channel are also more vulnerable to contamination, resulting in a
faster response from the fish species, given that it takes longer to filter out contaminants in comparison with the
open channels (Viana et al., 2010).
The analysis of diversity indices is one effective way
to evaluate the health of an aquatic environment ( López-Rojas and Bonilla-Rivero, 2000; Whitfield and Elliott,
2002). Anthropogenic impacts are known to modify
species composition through the elimination of the most
sensitive taxa and the subsequent dominance of the more
tolerant species (Attrill and Depledge, 1997). In our study, for both types of habitats, however, while species richness was lower in Zone 1, which is most vulnerable to industrial contamination, most species were constant,
which appears to reflect their capacity to adapt to impacted
and histological alterations of vital organs, such as the liver, kidneys and gills (Triebskorn et al., 2008). In the same study area, Viana et al. (2012) observed that, for P. squamosissimus and L. dorsalis (main species), clear evidence of histological alterations in the specimens
captured in the most impacted area (Zone 1) and severe
and irreversible alterations of the liver have been registered
for these species (Viana et al, 2012).
Medium-sized fish (TL = 15-30 cm) predominated in all three Zones, although larger fish were more common
in the Zones further from the industrial area, presumably
reflecting anthropogenic factors. The specie L. dorsalis, for example, presented smaller individuals in the zone 1
(TL = 17,43 ±4,4) in comparison with the zone 3 (TL = 30,36 ±10,9).
As in the present study, descriptive indicators for the structure of size classes have been used by a number of
authors to evaluate seasonal and spatial variation in fish communities. In Senegal, for example, a decrease in the maximum length of fish was observed after 20 years of
anthropogenic impact (Ecoutin et al., 2010). According to Yemane et al. (2008), the decline in both the mean
maximum length and the number of fish species able to
attain maximum length may be considered indicators of
disturbances in the fish community, in this case, from overfishing. In the present study, the smaller proportion of larger-sized fish recorded in the impacted areas may reflect an ecological response to anthropogenic disturbance.
Also, in this study, the ecological indices indicated that the structure of the community closest to the industrial area and cargo terminal is the most impacted, based on the low values for species richness and the Shannon and
Margalef indices and elevated dominance (Simpson). The most distant tidal channel (Zone 3) was relatively rich (Margalef index), but equitability was low, indicating a non-uniform distribution of species. The reduced equitability was probably influenced by the dominance of L. dorsalis and P. squamosissimus.
Species representative of all different feeding modes are expected in natural estuaries, as well as a predominance of bottom-feeders (Blaber, 2000; Chaves and Umbria, 2003; Paiva et al., 2008). This pattern was observed in all parts of the study area, in terms of both the number of species and individuals, given the predominance of zoobenthivores, piscivore-zoobenthivores, opportunist-omnivores and detritivores. A reduced number of trophic categories was recorded in the main channel of Zone 1. Environments that have suffered anthropogenic impacts tend to lose organisms at the top of the food chain (Browne and Lutz, 2010; Ecoutin et al., 2010), in this case, piscivores, as well as trophic specialists. According to Garrison and
Link (2000), generalist predators find prey more easily than specialised ones (such as benthophagous species)
and therefore are more able to survive major disturbances. Unfortunately, when no data are available on the trophic structure of the local communities prior to current impacts,
more definitive conclusions on this point are weakened
(Ecoutin et al., 2010).
Sets of indicators have been established by several authors for the monitoring of changes in the environmental
quality of estuaries. However, variation in these indicators is difficult to interpret and may not fully account for the complexity of the ecosystem. In particular, some indicators
are unable to identify short-term responses, demanding a
much longer study period in order to demonstrate fluctuations
effectively (Ecoutin et al., 2010). These variables include habitat use and the CPUE, which were evaluated in the present study.
In the case of relative abundance (CPUE), the highest
The adoption of exclusively physical-chemical criteria
for the evaluation of water quality may not necessarily
provide an accurate depiction of the conditions faced by
local communities (Vieira and Shibatta, 2007). While
these criteria may provide a reliable assessment of water
quality per se, they may not necessarily offer an effective measure of the ecological integrity of the area (Goulart and Callisto, 2003), given that they merely provide a “snapshot” of environmental conditions at a given point in time. By contrast, biological indicators offer an integrated overview
of the accumulated effects of pollution on the biota. In
this study, ecological indicators, especially ecological descriptors, trophic categories and size, were especially effective for the demonstration of the critical alterations
of the fish community of Zone 1, indicating that the biota
is an integrating element that responds systematically to alterations in the environment, despite the restrictions about the use of analysis on the community structure in estuarine environments (Elliott and Quintino, 2007). These impacts were also evident when more sophisticated methods were
applied as a selection of fish based multimetric indices
of ecosystem integrity (Viana et al., 2012).The cargo terminal and industrial district are a case in point here and in addition to the intrinsic potential risks represented by its industries, a number of accidents have been reported since the installation of its ore-processing plants (Lima et al., 2011). Additionally, Berrêdo et al. (2001) showed evidence of contamination by heavy metals in the region.
It is clear that the presence of the cargo terminal and
adjacent industries has an effect on the biological integrity of
areas used by many local fish species for their reproduction
and development. Many species visit the estuary of the Rio Pará during the migrations inherent to their life cycle. The juveniles tend to prefer estuaries due to the existence of favourable conditions for feeding, growth and refuge, as well their connectivity with other habitats (Kennish, 1985; Blaber, 2000). Studies have shown that the inner portion of the Amazon estuary, including Marajó and Guajará bays and the Pará estuary are used by ichthyofauna more for growth and development, rather than reproduction (Viana et al., 2010). In addition to the biological aspects of these phenomena, the local population is economically
dependent on local fishery resources (Paz et al., 2011). Considering the ecological and economic importance of the estuary of the Rio Pará, the mitigation of the impacts caused by the local ore-processing installations and the cargo
terminal and the systematic monitoring of the local aquatic
environments should be given the highest priority. Such measures will be important to guarantee the productivity of these environments for future generations, given the importance of these resources as a source of income and subsistence for local populations. Additionally, despite the lack of historical data for the study area, the methodological
procedures adopted in the present study were adequate
for the detection of the alterations to the environment. Acknowledgements – The authors are grataeful to Dr. Thierry Frédou for comments on earlier drafts of the manuscript
and Artur Miranda for helping with the map. This study
was partially financed by CNPq through a student grant to the first author and through a research grant to the second author, and by the International Institute of Education of Brazil and Moore Foundation, with financial assistance
during the project development.
References
ALMEIDA, MP., LINS, PMO., CHARVET-ALMEIDA, P. and BARTHEM, RB., 2010. Diet of the freshwater stingray Potamotrygon motoro (Chondrichthyes: Potamotrygonidae) on Marajó Island (Pará, Brazil). Brazilian Journal of Biology, vol. 70, no. 1, p. 155-162. http://dx.doi.org/10.1590/S1519-69842010000100022. PMid:20231973
ATTRILL, MJ. and DEPLEDGE, MH., 1997. Community and population indicators of ecosystem health: targeting links between levels of biological organization. Aquatic Toxicology (Amsterdam, Netherlands), vol. 38, no. 1-3, p. 183-197. http:// dx.doi.org/10.1016/S0166-445X(96)00839-9.
BARBOSA, ND., ROCHA, RM. and LUCENA FRÉDOU, F., 2012. The reproductive biology of Plagioscion squamosissimus (Heckel, 1840) in the Pará River estuary (Amazon Estuary). Journal of Applied Ichthyology, vol. 28, no. 5, p. 800-805. http:// dx.doi.org/10.1111/j.1439-0426.2012.02040.x.
BARTHEM, RB., 1985. Ocorrência, distribuição e biologia dos peixes da Baía do Marajó, Estuário Amazônico. Boletim do Museu Paraense Emílio Goeldi, vol. 2, no. 1, p. 15-28.
BERRÊDO, JF., MENDES, AC., SALES, ME. and SARMENTO, JP., 2001. Nível de contaminação por óleo nos sedimentos de fundo e água no rio Pará, decorrente do acidente com a balsa Miss Rondônia. In PROST, MT. and MENDES, AC. (Eds.). Ecossistemas costeiros: impactos e gestão ambiental. Belém: Museu Paraense Emílio Goeldi. p. 153-165.
BLABER, SJM.,2000. Tropical Estuarine fishes: ecology, exploitation and conservation. London: Ed. Chapman & Hall. 367 p. BRENNER, M. and KRUMME, U., 2007. Tidal migration and patterns in feeding of the four-eyed fish Anableps anableps L. in a north Brazilian mangrove. Journal of Fish Biology, vol. 70, no. 2, p. 406-427. http://dx.doi.org/10.1111/j.1095-8649.2007.01313.x. BROWNE, RA. and LUTZ, D., 2010. Lake ecosystem effects associated with top-predator removal due to selenium toxicity. Hydrobiologia, vol. 655, no. 1, p. 137-148. http://dx.doi.org/10.1007/ s10750-010-0416-3.
CHAVES, PTC. and UMBRIA, SC., 2003. Changes in the diet composition of transitory fishes in coastal systems, estuary and continental shelf. Brazilian Archives of Biology and Technology, vol. 46, no. 1, p. 41-46. http://dx.doi.org/10.1590/S1516-89132003000100007.
CLARKE, RK. and WARWICK, RM., 1994. Change in marine communities: an approach to statistical analysis and interpretation. Londres: Ed. Plymouth marine laboratory. 144 p.
Science, vol. 87, no. 2, p. 284-292. http://dx.doi.org/10.1016/j. ecss.2010.01.009.
EDDY, FB., 2005. Ammonia in estuaries and effects on fish. Journal of Fish Biology, vol. 67, no. 6, p. 1495-1513. http:// dx.doi.org/10.1111/j.1095-8649.2005.00930.x.
ELLIOTT, M. and QUINTINO, V., 2007. The Estuarine Quality Paradox, Environmental Homeostasis and the difficulty of detecting anthropogenic stress in naturally stressed areas. Marine Pollution Bulletin, vol. 54, no. 6, p. 640-645. http://dx.doi.org/10.1016/j. marpolbul.2007.02.003. PMid:17418874
ELLIOTT, M. and MCLUSKY, DS., 2002. The need for definitions in understanding estuaries. Estuarine, Coastal and Shelf Science, vol. 55, no. 6, p. 815-827. http://dx.doi.org/10.1006/ecss.2002.1031. ELLIOTT, M., WHITFIELD, AK., POTTER, IC., BLABER, SJM., CYRUS, DP., NORDLIE, FG. and HARRISON, TD., 2007. The guild approach to categorizing estuarine fish assemblages: a global review. Fish and Fisheries, vol. 8, no. 3, p. 241-268. http:// dx.doi.org/10.1111/j.1467-2679.2007.00253.x.
FROESE, R. and PAULY, D.,2007. Fishbase: World wide web electronic publication. Available from: <http://http://www.fishbase. org>. Access in: 5 June 2012.
GARRISON, LP. and LINK, JS., 2000. Diets of five hake species in the northeast United States continental shelf ecosystem. Marine Ecology Progress Series, vol. 204, p. 243-255. http://dx.doi. org/10.3354/meps204243.
GOULART, MD. and CALLISTO, M., 2003. Bioindicadores de qualidade de água como ferramenta em estudos de impacto ambiental. Fapam, vol. 2, no. 1, p. 153-164.
KEITH, P., LE BAIL, OY. and PLANQUETTE, P.,2000. Atlas des poissons d’eau douce de Guyane (tome 2, fascicule I). Paris: Ed. Publications scientifiques du M.N.H.N. 286 p.
KENNISH, MJ.,1985. Ecology of estuaries: biological aspects. Flórida: Ed. CRC PRESS. 408 p.
KRUMME, U., SAINT-PAUL, U. and ROSENTHAL, H., 2004. Tidal and diel changes in the structure of a nekton assemblage in small intertidal mangrove creeks in northern Brazil. Aquatic Living Resources, vol. 17, no. 2, p. 215-229. http://dx.doi. org/10.1051/alr:2004019.
LIMA, ML., SANTOS, ECO., JESUS, IM., MEDEIROS, AC., FAIAL, KCF. and ALVES, CN., 2011. Assessment of Surface Water in Two Amazonian Rivers Impacted by Industrial Wastewater, Barcarena City, Pará State (Brazil). Journal of the Brazilian Chemical Society, vol. 22, no. 8, p. 1493-1504. http://dx.doi. org/10.1590/S0103-50532011000800013.
LÓPEZ-ROJAS, H. and BONILLA-RIVERO, L., 2000. Anthropogenically induced fish diversity reduction in Lake Valencia Basin, Venezuela. Biodiversity and Conservation, vol. 9, no. 6, p. 757-765. http://dx.doi.org/10.1023/A:1008945813101. MARTINELLI, LA., DEVOL, AH., FORSBERG, BR., VICTORIA, RL., RICHEY, JE. and RIBEIRA, MNG., 1989. Descarga de Sólidos Dissolvidos Totais do Rio Amazonas e Seus Principais Tributários. Geochimica Brasiliensis, vol. 3, no. 2, p. 141-148. NITTROUER, CA., KUEHL, SA., STERNBERG, RW., FIGUEIREDO, AG Jr. and FARIA, LEC., 1995. An introduction to
the geological significance of sediment transport and accumulation on the Amazon continental shelf. Marine Geology, vol. 125, no. 3-4, p. 177-192. http://dx.doi.org/10.1016/0025-3227(95)00075-A. Organización de las Naciones Unidas para la Alimentación y la Agricultura – FAO, 1992. Guia de campo de las especies cormeciales marinas y de aguas salobres de la costa septentrional de Sur America. Roma: FAO. 513 p.
PAIVA, ACG., CHAVES, PTC. and ARAÚJO, ME., 2008. Estrutura e organização trófica da ictiofauna de águas rasas em um estuário tropical. Revista Brasileira de Zoologia, vol. 25, no. 4, p. 647-661. http://dx.doi.org/10.1590/S0101-81752008000400010. PAZ, AC., LUCENA FRÉDOU, F. and FRÉDOU, T., 2011. Caracterização da atividade pesqueira em Vila do Conde (Barcarena, Pará), no estuário amazônico. Boletim do Museu Paraense Emílio Goeldi, vol. 6, no. 2, p. 307-318. http://dx.doi.org/10.1590/S1981-81222011000200004.
RAIOL, MJOR., 2007. Comportamento alimentar da ictiofauna na baía do Guajará (Belém-PA). Belém: Universidade Federal do Pará. 57 p. Trabalho de Conclusão de Curso em Oceanografia. RUBIO, J. and TESSELE, F., 2002. Processos para o Tratamento de Efluentes na Mineração. In LUZ, AB., SAMPAIO, JA., MONTE, MB. and Almeida, SL. Tratamento de Minérios. Rio de Janeiro: CETEM-CNPq-MCT. p. 637-697.
RUFFINO, ML., 2004. A pesca e os recursos pesqueiros na Amazônia brasileira. Manaus: IBAMA/ProVárzea. 272 p.
TRIEBSKORN, R., TELCEAN, I., CASPER, H., FARKAS, A., SANDU, C., STAN, G., COLĂRESCU, O., DORI, T. and KÖHLER, HR., 2008. Monitoring pollution in River Mureş, Romania, part II: metal accumulation and histopathology in fish. Environmental Monitoring and Assessment, vol. 141, no. 1-3, p. 177-188. http://dx.doi.org/10.1007/s10661-007-9886-9. PMid:17876715
VIANA, AP., LUCENA FRÉDOU, F., FRÉDOU, T., TORRES, MF. and BORDALO, AO., 2010. Fish fauna as an indicator of environmental quality in an urbanised region of the Amazon estuary. Journal of Fish Biology, vol. 76, no. 3, p. 467-486. http:// dx.doi.org/10.1111/j.1095-8649.2009.02487.x. PMid:20666891 VIANA, AP., FRÉDOU, FL. and FRÉDOU, T., 2012. Measuring the ecological integrity of an industrial district in the Amazon estuary, Brazil. Marine Pollution Bulletin, vol. 64, no. 3, p. 489-499. http://dx.doi.org/10.1016/j.marpolbul.2012.01.006. PMid:22296625
VIEIRA, DB. and SHIBATTA, OA., 2007. Peixes como indicadores da qualidade ambiental do ribeirão Esperança, município de Londrina, Paraná, Brasil. Biota Neotropica, vol. 7, no. 1, p. 0-0. http://dx.doi.org/10.1590/S1676-06032007000100008. WHITFIELD, AK. and ELLIOTT, M., 2002. Fishes as indicators of environmental and ecological changes within estuaries: a review of progress and some suggestions for the future. Journal of Fish Biology, vol. 61, no. sa, p. 229-250. http://dx.doi. org/10.1111/j.1095-8649.2002.tb01773.x.