ABSTRACT: In the Amazonian region, P is often a primary factor limiting sustainable agrosys-tems. We compared the efficiencies of local aluminous phosphate (ALP) and single superphos-phate (SSP) under a cover of leguminous residues to determine the fate of P sources in an Ama-zonian soil with hardsetting characteristics. The experiment followed a randomized block design with four replications and the following treatments: ALPU, i.e. ALP plus urea (U); ALPL, i.e., ALP plus leucaena (L); SSPU, i.e., SSP plus urea; SSPL, i.e., SSP plus leucaena; and BS, i.e., bare soil (without residues). To assess the residual values of the P sources, we used a sequence of crops consisting of maize, cowpea and cassava. Both ALP and SSP exhibited low P efficiency in BS. The greatest amounts of P and N uptake in the plots where P sources and leucaena residues were added, as in those covered with leucaena residue, resulted in higher productivity levels. These differences are important for the adoption of beneficial soil management practices and the use of P sources to enhance efficiency in tropical soils. The use of residues increased the P use efficiency of both P sources, as it enhanced the uptake of both N and soluble P. The replace-ment of SSP with ALP may be advantageous in the second year of planting with high-demand crops, but the P of the SSP retained in the minus soluble fractions may be available if the SSP is used in P-depleting crops combined with no-tillage underneath a mulch of residues.
Keywords: P fractions, hardsetting soil, aluminous phosphate, leguminous residues, nitrogen
Utilization and fate of phosphorus of different sources applied to cohesive soil of
Marta Jordana Arruda Coelho1, Alana das Chagas Ferreira Aguiar2, Virley Gardeny Lima Sena1, Emanoel Gomes de Moura1*
1State University of Maranhão − Agroecology Dept., Av. Lourenço Vieira da Silva, 9 − 65054-970 − São Luís, MA − Brazil.
2Federal University of Maranhão − Biology Dept., Av. dos Portugueses, 1966 − 65080-805 − São Luís, MA − Brazil. *Corresponding author <[email protected]>
Edited by: Francesco Montemurro
Received January 15, 2016 Accepted June 23, 2016
Introduction
In low-input farming systems, the continual min-ing of P by crops and the subsequent removal of P de-creases soil fertility. This removal is now recognized as the fundamental cause of unsustainability, deforestation and declining food security in smallholder farms in the Amazon region and its periphery (Aguiar et al., 2011).
Although there are various sources of P available for use in agricultural systems, for a family farm in the humid tropics, the direct application of local phosphate rock (PR) appears to be a more attractive way of alleviat-ing P deficiency than the use of more expensive, import-ed processimport-ed fertilizers, such as single superphosphate (SSP).
In humid tropical soils, repeated wetting and dry-ing usually promotes long-term hardendry-ing in the absence of soil aggregation (Mullins, 1999). Then, nutrient usage efficiency is the primary factor affecting the sustainable management of agrosystems because of poor soil rootabil-ity and high rates of nutrient loss (Moura et al., 2009).
Soil cover provides positive effects (i) by enhanc-ing the rootability of soils susceptible to hardsettenhanc-ing, since covering the soil surface with mulch preserves the soil moisture by reducing evaporative losses thereby de-laying cohesion (Becher et al., 1997); (ii) by promoting the formation of unstable aggregates through continuous application of residues that improve the environment for root growth and via increases in the free light fraction of organic matter (Shepherd et al., 2002); (iii) by decreasing the P sorption in highly weathered soils by promoting competition between residue decomposition products
and P by sorption sites (Gupy et al., 2005); and (iv) by producing organic acids and humic substances during decomposition, which are also involved in the P solubili-zation process (Singh and Amberger, 1990).
We tested two hypotheses: (1) in a soil with hard-setting characteristics, calcined aluminous phosphate can replace the soluble phosphate used in staple crops if it is combined with leguminous residues in a no-tillage; and (2) instead of using SSP, the residual value of phos-phate rock (PR) reduces the need for imported fertilizers and increases the sustainability of systems during subse-quent years. The objective of this study was to compare the efficiencies of an aluminous phosphate and single superphosphate underneath a cover of leguminous resi-dues by determining the fate of the P of these sources in a tropical soil with hardsetting characteristics.
Materials and Methods
Experimental site and trial set-up
The experiment was conducted over four growing seasons (2010, 2011, 2012 and 2013) at the city of São Luís, in the state of Maranhão, Brazil (2o30’ S, 44o18’
W), at 4 m above sea level. The region has a hot, semi-humid, equatorial climate with mean precipitation of 2,100 mm yr−1 and two well-defined seasons: a rainy
season that extends from Jan to June and a dry season with a pronounced water deficit from July to Dec. The local soil displayed hardsetting characteristics (Moura et al., 2009), and was classified as Arenic Hapludult. It consisted of 260 g kg−1 of coarse sand, 560 g kg−1 of fine
cal characteristics at a depth of 0-20 cm were as follows: pH (CaCl2) 4.3, organic carbon (Walkley-Black) 9.3 g dm−3, P 1.4 mg dm−3, K 0.6 mmol
c dm
−3, Ca 4.0 mmol c
dm−3, Mg 10.0 mmol c dm
−3, potential acidity (resin) 26.0
mmolc dm−3, sum of bases 14.6 mmol c dm
−3, cation
ex-change capacity 40.6 mmolc dm−3 and base-saturation
percentage 36. The soil was characterized in accordance with the standard methods of the Institute of Agronomy, Campinas (Raij et al., 1986). The soil’s dry bulk density was 1.3 g cm−3,as measured by the Thomasson method
(1978) and soil samples were collected at depths of 0-20 cm in 2010 before sowing the maize.
The area had been fallow since 1990 and had sup-ported a local type of grass, which was killed using a glyphosate application. The experiment was conducted under no-tillage conditions, and the experimental plot size was 4 × 8 m. The area was limed in Dec 2009 and 2010 using a surface application of 1 Mg ha−1 of
hydrat-ed calcium, which corresponds to 279 and 78 kg ha−1
of Ca and Mg yr−1 [Ca(OH)
2) + Mg(OH)2], respectively.
The aluminum phosphate (ALP) used in this experiment was collected on Trauíra Island in northeastern Maran-hão, Brazil, located at 1o16’ S 45o37’ W, at 11 m above
sea level. According to Guardani et al. (1989), phosphate consists mainly of the mineral crandallite - goyazite, (Ca, Sr)Al3(PO4)2(OH)5.H2O, with 27.2 mass % of P2O5 and CaO 7 %, SiO2 = 3 %, Fe2O3 = 4 % and Al2O3 = 29 %.
The ALP was ground to a particle size of < 0.150 mm and then calcined at a temperature of 500 °C for 2 h. The calcination was performed using handcrafting techniques in furnaces commonly found in rural com-munities in the region and was monitored using an in-frared radiation thermometer. The P2O5 solubility of the calcined products was measured by extraction in a 2 % citric acid solution (Raij et al., 1986) and was determined to be 6 % P2O5. The P2O5 solubility of single superphos-phate (SSP) in the same 2 % citric acid solution was 18 %. These values were used to calculate the quantities of each product to be used in the soluble P2O5 application. To assess the residual values of the P sources, we used a sequence of crops consisting of maize, cowpea and cas-sava, which are listed from least to most P depletive. The ALP and SSP was applied only in 2010 in a narrow band in a row planting of the maize. Residues from Leucaena leucocephala (leucaena) were collected from an area near the experimental site and applied in a quantity that was similar to that commonly produced in an alley cropping system (6 Mg ha−1), according to Aguiar et al. (2010). The
important chemical parameters of the leucaena were as follows: a C/N ratio of 12 and N and P concentrations of 40.17 g kg−1 and 1.55 g kg−1, respectively.
The experiment followed a randomized block de-sign with four replications and the following treatments: (1) an ALPU treatment consisting of 160 kg ha−1 of P
2O5
from ALP and 100 kg ha−1 of N from urea (U); (2) an
ALPL treatment consisting of 160 kg ha−1 of P
2O5 from
ALP and 6 Mg ha−1 of dry matter residue from leucaena
(L); (3) an SSPU treatment consisting of 160 kg ha−1 of
P2O5 from SSP and 100 kg ha−1 of N from U; (4) an SSPL
treatment consisting of 160 kg ha−1 of P
2O5 from SSP and
6 Mg ha−1 of dry-matter residue from leucaena (L); and
(5) the bare soil (BS) treatment consisting of a control involving no residues, N and P application. The leucaena residue was applied in the form of fresh branches at a rate equivalent to 241 kg ha−1 yr−1 of N and 9.3 kg ha−1
yr−1 of P. The urea and leucaena were applied in 2010,
2011, 2012 and 2013.
The total amounts of applied P (including organic and insoluble inorganic P) were 292 kg ha−1 from ALP
and 78.70 kg ha−1 from SSP combined with U and 329.20
kg ha−1 from ALP and 115.90 kg ha−1 from SSP
com-bined with L. The total amount of urea and leucaena was divided as follows: the maize crop received two sur-face applications, one at the time of sowing and one at approximately the appearance of the six leaves; and the cassava crop received an application at planting and a second at the time of the rainy period of the second veg-etative cycle (12 months after planting). All of the plots received 60 kg ha−1 of K
2O as potassium chloride and 4
kg ha−1 of Zn in the form of ZnSO
4. Both of these
appli-cations were implemented during each year to all crops. The maize (cultivar AG 5020) was sown under a no-till system in Jan 2010 and Jan 2011. A spacing of 90 cm between rows and 33 cm between plants was used. The cowpea (cultivar xique-xique), which is a short-season crop, was sown in 2011 after the harvesting of maize with a spacing of 45 cm between rows and 15 cm be-tween plants was used.The cassava (cultivar João-velho) was planted in Jan 2012. A spacing of 100 cm between rows and 50 cm between plants was used. The weeds were controlled by hand hoeing, once for each crop. In maize at the V4 stage, in cowpea 20 days after sowing and in cassava 30 days after planting.
Plant analysis
The P and N were measured in the dry matter of the maize, cowpea and cassava (including the roots) at physiological maturity. Ten plants from each plot were selected at random, and all of these plant materials were dried at 60 °C for 3-4 days to obtain constant weight. Subsamples were collected and ground to pass through a screen opening size of 1 mm. The concentrations of P and N were determined after digestion using H2SO4 -H2O2, in accordance with Cottenie’s standard method (1980). At the end of the maize and cowpea harvests, the grain yields were evaluated and determined separately within an area of 10 m2; the yields were reported based
on a material moisture content of 145 g kg−1. Cassava
crop productivity was evaluated by measuring the dry matter of the roots. The fresh roots of the cassava were harvested (in Nov 2013) in an area of 16 m2 and then
dried for 3-4 days to obtain constant weight.
Soil P fractionation and the fate of P
excavating a trench 1 m long and 0.05 m wide. The sam-ples from each point were passed through a 2 mm sieve and then air-dried prior to analysis. The fractionation of P in the soil was determined in accordance with the method of Hedley et al. (1982), incorporating the modifi-cations of Condron et al. (1985). Briefly, at each step, 10 mL of extractant was added to 0.5 g soil in 15 mL centri-fuge tubes (1:20 soil:solution ratio) and the tubes shaken end-over-end (orbital shaker, 60 rpm) for 16 h at 25 °C, soil sample was extracted sequentially using an anion exchange resin, 0.5 M NaHCO3 (pH 8.5), 0.1 M NaOH, 1 M HCl and 0.5 M NaOH. The amount of inorganic phosphorus (Pi) in the alkaline extracts (NaHCO3-Pi, 0.1 M NaOH-Pi and 0.5 NaOH-Pi) was determined using the analytical method of Dick and Tabatabai (1977). After centrifugation and removal of supernatant at each step of the fractionation, the soil was washed with 10 mL 0.5 M NaCl solution, to prevent the residual effect of the previous solution (pH change). The organic P (Po) was determined by calculating the difference between the to-tal phosphorus (Pt) and Pi in the alkaline extracts. These alkaline extracts were added to a 1:1 sulfuric acid solu-tion and 7 % ammonium persulfate in an autoclave at 121 °C and 103 kPa for 2 h to determine the Pt (inorgan-ic P + organ(inorgan-ic P). The P acid extracts (NaHCO3-Pt, 0.1 M NaOH-Pt, 0.5 NaOH-Pt and HCl-Pi) were determined following the method of Murphy and Riley (1962).
The fractions of P were quantified based on the lability predicted by the extractors. The labile P (LP) consisted of the resin P plus the NaHCO3-P (Pi and Po), the moderately labile P (MLP) consisted of the 0.1 M NaOH-P (Pi and Po) plus the HCl-P, and the hardly labile P (HLP) consisted of the 0.5 M NaOH-P (Pi and Po).
The P fate percentages were estimated as follows: (1) phosphorus recovery efficiency (PRE) = [(kg ha−1 P
taken up in the treatment - kg ha−1 P taken up in the BS)
/ kg ha−1 total of P applied] × 100. The LP, MLP and
HLP fractions were calculated as follows: (2) LP = [(kg
ha−1 LP in the treatment - kg ha−1 LP in the control) / kg
ha−1 total of P applied] × 100, (3) MLP = [(kg ha−1 MLP
in the treatment - kg ha−1 MLP in the control) / kg ha−1
total of P applied] × 100, (4) HLP = [(kg ha−1 HLP in the
treatment - kg ha−1 HLP in the control) / kg ha−1 of total
Papplied] × 100; (5) residual P = total Papplied in the treatment – (PRE + LP + MLP + HLP). The values of P (mg kg−1) at the three depth intervals (0-10, 10-20, 20-30
cm) were added after conversion for kg ha−1 as follows:
P content (mg kg−1) × soil bulk density (g cm−3) × 10
cm depth / 10.
Statistical analyses
The data were analyzed via analysis of variance (ANOVA), and the means were compared using Tukey’s post hoc test at a p = 0.05 significance level. The data were analyzed using InfoStat software.
Results
Nutrient content and productivity
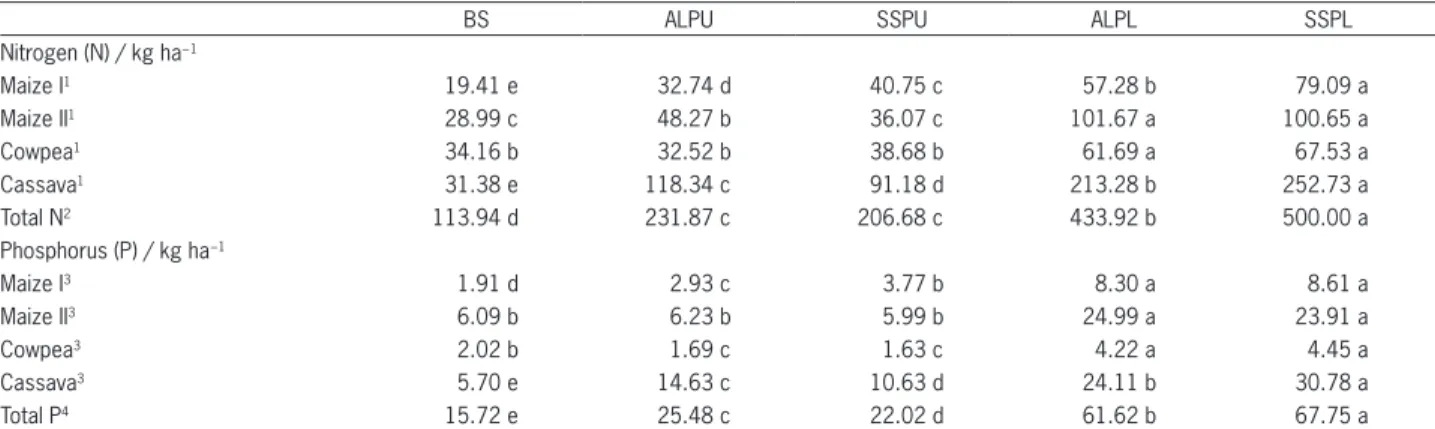
The use of the two P sources with the leucaena residue significantly increased the accumulation of N in all of the crops when compared with the bare soil (Table 1). During the first year, there were differences in N accumulation between the treatments with different sources of P; N accumulation was higher in the SSP plot than in the ALP plot under the same style of manage-ment. During the second year (maize II), there was no difference in N accumulation between the two P sources in the treatments with leucaena, which were higher than all of the other treatments. In terms of N accumulation, the SSPU plot was equal to the BS, and the ALPU was in-termediate. During the third year (cowpea crop), the two P sources with leucaena residue were also coequal and higher than the other treatments (which were coequal) in terms of N accumulation. During the fourth year (cas-sava crop), the ordering of N accumulation in the plots
Table 1 − Nitrogen content and phosphorus absorbed by crops during four consecutive cultivations.
BS ALPU SSPU ALPL SSPL
Nitrogen (N) / kg ha−1
Maize I1 19.41 e 32.74 d 40.75 c 57.28 b 79.09 a
Maize II1 28.99 c 48.27 b 36.07 c 101.67 a 100.65 a
Cowpea1 34.16 b 32.52 b 38.68 b 61.69 a 67.53 a
Cassava1 31.38 e 118.34 c 91.18 d 213.28 b 252.73 a
Total N2 113.94 d 231.87 c 206.68 c 433.92 b 500.00 a
Phosphorus (P) / kg ha−1
Maize I3 1.91 d 2.93 c 3.77 b 8.30 a 8.61 a
Maize II3 6.09 b 6.23 b 5.99 b 24.99 a 23.91 a
Cowpea3 2.02 b 1.69 c 1.63 c 4.22 a 4.45 a
Cassava3 5.70 e 14.63 c 10.63 d 24.11 b 30.78 a
Total P4 15.72 e 25.48 c 22.02 d 61.62 b 67.75 a
was SSPL > ALPL > ALPU > SSPU > BS. The ordering of total N accumulation in general during the study was SSPL > ALPL > ALPU = SSPU > BS.
In the maize I, maize II and cowpea plantings, there were no differences in P accumulation between the plots where the soil was covered with leucaena residue. However, in the cassava crop (third and fourth years), P accumulation varied, with the SSPL plot exhibiting high-er P accumulation than the ALPL plot (Table 1). Dur-ing the first year, the orderDur-ing of P accumulation in the various plots without leucaena was SSPU > ALPU > BS. During the second year, P accumulation was approxi-mately four times higher in the plots provided with resi-dues than in those plots receiving other treatments, and there were no differences in P accumulation between the plots without residues and the control, regardless of the source of P. Similarly, P accumulation of P in the cowpeas was higher in the plots with residues and was lower in the uncovered plots than in the control, regard-less of the source of P. The ordering of P accumulated in the cassava and the total accumulated P was SSPL > ALPL > ALPU > SSPU > BS. The total accumulated P in the crops was more than two times higher in the plots covered with residues.
Only in the second year was the productivity of maize higher in the ALPL plots than the SSPL plots (maize II). The productivity of cowpea and cassava was higher in the SSPL plots (Figure 1). In addition, produc-tivity in the ALPU plots was higher than in the SSPU plots in the maize II and cassava crops. Except for the cowpea crop, in which the productivity of the BS plot did not differ from the uncovered plots, the productiv-ity of the BS plot was lower than that of the other plots. In the cassava (third and fourth years), a crop with low P requirements, the productivity in the ALPU plot was
higher than the SSPU plot. However, where residues of leucaena were provided, productivity in the SSP plot was superior. In all of the crops, productivity of the plots covered with leucaena was superior to that of the plots receiving the other treatments involving either of the P sources.
Soil P fractionation and fate of P
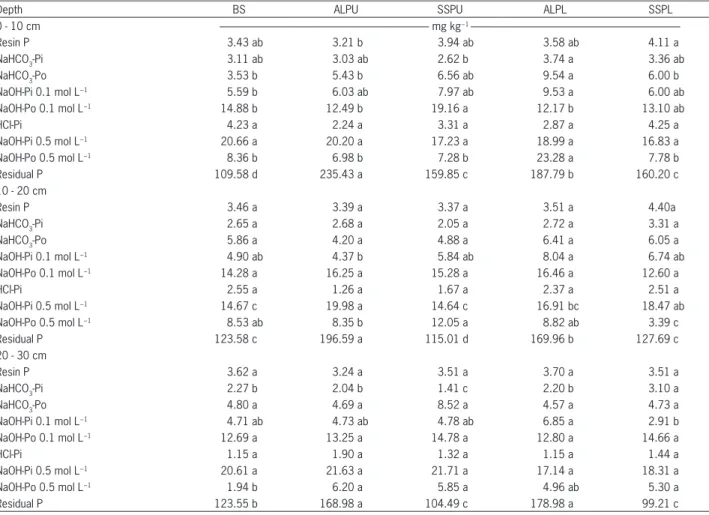
After four years, the amount of resin P was higher in the SSPL plot than in the ALPU plot in the 0-10 cm interval (Table 2), and the NaHCO3-Pi was higher in the ALPL plot than in the SSPU plot. There were no signifi-cant differences between the other treatments. Addition-ally, NaHCO3-Po was higher in the ALPL plot than in the BS, ALPU and SSPL plots. Similarly, the 0.1 NaOH-Pi was higher in the ALPL plot than the BS and without significant differences to the other plots. The 0.1 NaOH-Po in the SSPU plot was higher than in the ALPU, ALPL and BS plots. The HCl-Pi and 0.5 NaOH-Pi fractions did not differ from one treatment to the next, but the 0.5 NaOH-Po was higher in the ALPL plot than in the other plots, which did not differ from one plot to the next.
There were no differences beween the resin P, NaHCO3-Pi, NaHCO3-Po, 0.1 NaOH-Po and HCl-Pi frac-tions in the 10-20 cm interval (Table 2). However, the 0.1 NaOH-Pi fraction was lower in the ALPU plot than in the ALPL plot and without significant differences to the other plots. Additionally, the 0.5 NaOH-Pi fractions were smaller in the BS and SSPU plots than the ALPU and SSPL plots. The 0.5 NaOH Po fraction was lower in the SSPL plot than in all of the other plots and was higher in the SSPU plot than in the ALPU plot. In the 20-30 cm interval, the NaHCO3-Pi fraction was higher in the SSPL. This fraction was lower in the SSPU plots than in other plots (Table 2). The 0.1 NaOH-Pi fraction was higher in the ALPL plot than in the SSPL plot. Additionally, the 0.5 NaOH-Po fraction was lower in the BS plot than in the ALPU, SSPU and SSPL plots.
Only in the superficial layer did the labile and mod-erately labile fractions show differences between treat-ments (Figure 2A). In the ALPL plot, the labile fractions were higher than in the ALPU and the BS plots; in the other plots, the labile fractions were without significant differences. Similarly, the moderately labile fractions were higher in the SSPU plot than in the ALPU plot. In the same layer, the hardly labile fraction was higher in the ALPL plot than in all of the other plots (which did not differ from one to the next). In the 10-20 cm interval, this hardly labile fraction was higher in the ALPU plot than in the BS and SSPL plots; the other treatment plots did not exhibit significant differences (Figure 2B). The hardly labile fraction was also higher in the ALPU plot than in the ALPL plot in the 20-30 cm interval, and the source of the applied P made a difference in terms of the labile fraction in this deepest interval (Figure 2C).
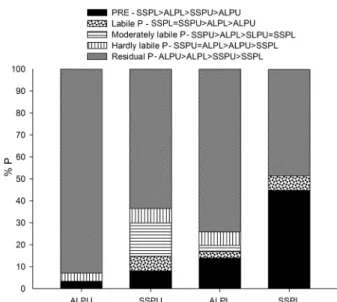
The fate of the total P applied varied with the source of P and type of soil management (Figure 3). The ALPU plot exhibited no buildup in the
percent-Figure 1 − Productivity of Maize (I and II), Cowpea and Cassava. BS = bare soil; ALPU = aluminum phosphate rock (ALP) and urea (U); SSPU = single superphosphate (SSP) and urea (U); ALPL = aluminum phosphate rock (ALP) and leucaena (L); SSPL = single superphosphate (SSP) and leucaena (L); Different letters in the same row indicate significant differences between treatments (p
age of labile or moderately labile P. Approximately 93 % of the total P applied in the ALPU form was transformed into residual P fractions. In the SSPU and ALPL plots, this fraction was 64 % and 74 %, respec-tively. In the same plots, the hardly labile fraction was 7 % and 6 %, respectively. In addition, the percentage of P uptake in the ALPL plot was 14 % versus 8 % in the SSPU plot. In contrast, the opposite trend was ob-served in the moderately labile fraction, i.e., 3 % and 15 % in the ALPL and SSPU plots, respectively. In the SSPL plot, the P recovery efficiency percentage was approximately equal to the residual fractions of P (45 to 48 %), and the rest (7 %) was transformed into the labile fractions.
Discussion
Nutrient content and productivity
The differences in productivity shown in this experiment were the results of the higher amounts of P and N uptake in the plots covered with the residues of leucaena, due to the higher amounts of labile P and
available N, compared to the plots with urea (Table 1 and Figure 1). Enhancing understanding of these find-ings is important for the adoption of beneficial soil man-agement practices and the use of P sources to enhance P efficiency in tropical soils. As major nutrients, N and P are critical to plant growth, it would even be expected that the assimilation of N could be increased in plants with an optimal P supply, and plants receiving adequate N may exhibit significant increases in P assimilation (Graciano et al., 2006).
A negative correlation between unutilized N and levels of applied soluble P was reported by Ali et al. (2002). Under leaching conditions, a steady release of N during the crop cycle from the residue is more impor-tant than rapid early availability in achieving high crop growth, according to Moura et al. (2010). During the first year of our study, the SSP was more efficient than the ALP with or without the use of leucaena residue, which confirms that fertilizers containing more soluble P have a potential to supply P to plants immediately after ap-plication but that their P availability decreases over time (Rivaie et al., 2008).
Table 2 − Phosphorus soil fractions at different depths (0-10, 10-20 and 20-30 cm) under different treatments.
Depth BS ALPU SSPU ALPL SSPL
0 - 10 cm --- mg kg−1
---Resin P 3.43 ab 3.21 b 3.94 ab 3.58 ab 4.11 a
NaHCO3-Pi 3.11 ab 3.03 ab 2.62 b 3.74 a 3.36 ab
NaHCO3-Po 3.53 b 5.43 b 6.56 ab 9.54 a 6.00 b
NaOH-Pi 0.1 mol L−1 5.59 b 6.03 ab 7.97 ab 9.53 a 6.00 ab
NaOH-Po 0.1 mol L−1 14.88 b 12.49 b 19.16 a 12.17 b 13.10 ab
HCl-Pi 4.23 a 2.24 a 3.31 a 2.87 a 4.25 a
NaOH-Pi 0.5 mol L−1 20.66 a 20.20 a 17.23 a 18.99 a 16.83 a
NaOH-Po 0.5 mol L−1 8.36 b 6.98 b 7.28 b 23.28 a 7.78 b
Residual P 109.58 d 235.43 a 159.85 c 187.79 b 160.20 c
10 - 20 cm
Resin P 3.46 a 3.39 a 3.37 a 3.51 a 4.40a
NaHCO3-Pi 2.65 a 2.68 a 2.05 a 2.72 a 3.31 a
NaHCO3-Po 5.86 a 4.20 a 4.88 a 6.41 a 6.05 a
NaOH-Pi 0.1 mol L−1 4.90 ab 4.37 b 5.84 ab 8.04 a 6.74 ab
NaOH-Po 0.1 mol L−1 14.28 a 16.25 a 15.28 a 16.46 a 12.60 a
HCl-Pi 2.55 a 1.26 a 1.67 a 2.37 a 2.51 a
NaOH-Pi 0.5 mol L−1 14.67 c 19.98 a 14.64 c 16.91 bc 18.47 ab
NaOH-Po 0.5 mol L−1 8.53 ab 8.35 b 12.05 a 8.82 ab 3.39 c
Residual P 123.58 c 196.59 a 115.01 d 169.96 b 127.69 c
20 - 30 cm
Resin P 3.62 a 3.24 a 3.51 a 3.70 a 3.51 a
NaHCO3-Pi 2.27 b 2.04 b 1.41 c 2.20 b 3.10 a
NaHCO3-Po 4.80 a 4.69 a 8.52 a 4.57 a 4.73 a
NaOH-Pi 0.1 mol L−1 4.71 ab 4.73 ab 4.78 ab 6.85 a 2.91 b
NaOH-Po 0.1 mol L−1 12.69 a 13.25 a 14.78 a 12.80 a 14.66 a
HCl-Pi 1.15 a 1.90 a 1.32 a 1.15 a 1.44 a
NaOH-Pi 0.5 mol L−1 20.61 a 21.63 a 21.71 a 17.14 a 18.31 a
NaOH-Po 0.5 mol L−1 1.94 b 6.20 a 5.85 a 4.96 ab 5.30 a
Residual P 123.55 b 168.98 a 104.49 c 178.98 a 99.21 c
Figure 2 − P fractions quantified according to the P lability predicted by extractors, at a depth of 0-10 cm (A), 10-20 cm (B) and 20-30 cm (C). ALPU = aluminum phosphate rock (ALP) and urea (U); SSPU = single superphosphate (SSP) and urea (U); ALPL = aluminum phosphate rock (ALP) and leucaena (L); SSPL = single superphosphate (SSP) and leucaena (L); Different letters in the same row indicate significant differences between treatments (p < 0.05).
Figure 3 − Fate of P applied: PRE (Phosphorus recovery efficiency), Labile P, Moderately labile P, Hardly labile P and Residual P. ALPU = aluminum phosphate rock (ALP) and urea (U); SSPU = single superphosphate (SSP) and urea (U); ALPL = aluminum phosphate rock (ALP) and leucaena (L); SSPL = single superphosphate (SSP) and leucaena (L).
Because the P was applied during thefirst year, the uptake of P was dependent on the residual value of the P fertilizer, which varied with the type of crops and soil management that were used during the second year. Thus, during the second year, the residual value of the ALP was superior to the SSP, with or without soil cover, for increasing the productivity of maize, which is a high-ly P-demanding crop (Figure 1). The higher release of P from the SSP during thefirst year may have contributed to the increased amount of P fixed by soil components and the decrease in the uptake of P during the year fol-lowing application, whereas the opposite effect occurred with the ALP fertilizer (Hongqing et al., 2001).
According to Rivaie et al. (2008), dissolved P un-dergoes reactions with organic and inorganic constituents of the soil, resulting in products of varying solubility. Thus, higher values of 0.1 NaOH-Po were found in the SSPU plots than in the SSPL plots (Table 2), suggesting that higher concentrations of organic P may have contrib-uted to an increase in P uptake and yield of the cassava in the plots treated with the SSPL. Cassava is known to be adapted to low-P soil, with a lower critical level (4-6 mg kg−1) than other crop species such as maize (with a critical
level of 10-15 mg kg−1) (Ribeiro et al., 1999). In general,
P uptake by cassava is dependent on vesicular-arbuscular mycorrhiza associations, and the effectiveness of these as-sociations is determined by the extent of the infected root length (Howeler and Cadavid, 1990).
mycorrhiza in cassava due to its effect on the improve-ment of the soil’s physical properties, such as soil mois-ture content, increased porosity and decreased mechani-cal resistance to hyphal growth.
Similarly, the higher P uptake of the cowpea crop in the SSPL plot is also associated with more effective symbiosis with arbuscular mycorrhizae and an increase in symbiotic nitrogen fixation (Jemo et al., 2006). Culti-vars of cowpea BRS are selected for their tolerance to P deficiency and aluminum toxicity in tropical acid soils (Barros et al., 2013). Therefore, external requirements of P for nodulation in these cultivars of cowpea are lower than in other legume species (Alkama et al., 2009).
After four years, with the sequence of crops used (less to more P-depletive crops), there was little contri-bution to the labile fraction of P by either source of P. Small differences between the P fractions were due to the style of management rather than to the solubility of the P source and were insufficient to change the criti-cal level of P (Ribeiro et al., 1999). In general, only the ALPL treatment resulted in higher P fractions (hardly labile and labile) in the 0-10 cm interval compared to the control (Figure 2A). In contrast, the ALPU plot did not exhibit any difference in P fractionation from that of the BS. According to Mweta et al. (2007), the practice of leguminous pruning can increase total P availability. Phenolic and aliphatic acids produced during the decom-position of organic matter are responsible for the solubi-lization of phosphates in soil (Ramesh et al., 2003).
It is worth highlighting the comparison between the fate and recovery efficiencies of P associated with the SSPU and SSPL treatments (Figure 3). Nearly 28 % of the P applied in the SSPU plot migrated to the mod-erately labile and hardly labile fractions, whereas the corresponding P in the SSPL plot may have been taken up by the plants, as the soluble fractions were practi-cally equal in two treatments. In addition, the recovery efficiency with the SSPL treatment was 48 % versus 8 % with the SSPU treatment. Certain processes may ac-count for this difference. First, competition between the residue decomposition products and P for soil sorption sites results in an increased soil solution P concentration in highly weathered soils (Guppy et al., 2005). Second, the presence of residue on the soil surface decreases evapotranspiration, delays soil cohesion and enhances soil rootability (Moura et al., 2012). These conditions favor both N and P uptake, thereby decreasing the op-portunity for P sorption by the soil. Additionally, the dif-ferences in terms of P uptake and the moderately and labile fractions between the ALPU and ALPL (7 % to 20 %) treatments confirms the capacity for solubilization of P by leucaena residues, even with aluminous phosphate.
Conclusions
In soils of the humid tropics, which are prone to cohesion, both aluminous phosphate and single super-phosphate exhibit low efficiency if they are used on soil
without residue cover, which affects the sustainability of the system. In contrast, the use of leguminous residues in a no-tillage system increases P usage efficiency of both the single superphosphate and the aluminous phos-phate, as this management practice enhances the uptake of both N and soluble P. The replacement of single su-perphosphate by aluminous phosphate may be advanta-geous during the second year of planting with high-de-mand crops, but the P of single superphosphate retained in the minus soluble fractions may be available if the SSP is used with P-depleting crops combined with a no-tillage system under a cover of leguminous residues.
Acknowledgments
We thank the CNPq (Brazilian National Coun-cil for Scientific and Technological Development), CAPES
(Coordination for the Improvement of Higher Level Per-sonnel)and FAPEMA (Foundation of Research and De-velopment Scientific and Technological of Maranhão) for their financial support.
References
Aguiar, A.C.F.; Bicudo, S.J.; Costa Sobrinho, J.R.S.; Martins, A.L.S.; Coelho, K.P.; Moura, E.G. 2010. Nutrient recycling and physical indicators of an alley cropping system in a sandy loam soil in the Pre-Amazon region of Brazil. Nutrient Cycling in Agroecosystems 86: 189-198.
Aguiar, A.C.F.; Freitas, I.C.; Carvalho, C.S.; Monroe, P.H.M.; Moura, E.G. 2011. Efficiency of an agrosystem designed for family farming in Pre-Amazon region. Renewable Agriculture and Food Systems 26: 24-30.
Ali, J.; Bakht, J.; Shafi, M.; Khan, W.A. 2002. Uptake nitrogen as affected by various combinations of nitrogen and phosphorus. Asian Journal of Plant Science 1: 367-369.
Alkama, N.; Bolou, B.; Bolou, E.; Vailhe, H.; Roger, L.; Ounane, S.M.; Drevon, J.J. 2009. Genotypic variability in P use efficiency for symbiotic nitrogen fixation is associated with variation of proton efflux in cowpea rhizosphere. Soil Biology and Biochemistry 41: 1814-1823.
Barros, M.A.; Rocha, M.M.; Gomes, R.L.F.; Damasceno-Silva, K.J.; Neves, A.C. 2013. Yield adaptability and stability of semi-prostrate cowpea genotypes. Pesquisa Agropecuária Brasileira 48: 403-410 (in Portuguese, with abstract in English).
Becher, H.H.; Breuer, J.; Klinger, B. 1997. An index value for characterizing hardsetting soils by fall-cone penetration. Soil Technology 10: 47-56.
Condron, L.M.; Goh, K.M.; Newman, R.H. 1985. Nature and distribution of soil phosphorus as revealed by a sequential extraction method followed by 31P nuclear magnetic resonance
analysis. Journal of Soil Science 36: 199-207.
Cottenie, A. 1980. Soil and Plant Testing as a Basis of Fertilizer Recommendations. FAO, Rome, Italy. (FAO Soil Bulletin). Dick, W.A.; Tabatabai, M.A. 1977. Determination of
Graciano, C.; Goya, J.F.; Frangi, J.L.; Guiamet, J.J. 2006. Fertilization with phosphorus increases soil nitrogen absorption in young plants of Eucalyptus grandis. Forest Ecology and Management 236: 202-210.
Guardani, R.; Drahos, J.; Giulietti, M.; Schugerl, K. 1989. Studies on calcinations of aluminium phosphate rock in fluidized bed reactors. Fertilizer Research 20: 181-191.
Guppy, C.N.; Menzies, N.W.; Moody, P.W.; Blamey, F.P.C. 2005. Competitive sorption reactions between phosphorus and organic matter in soil: a review. Soil Research 43: 189-202. Hedley, M.J.; Steward, W.B.; Chuauhan, B.S. 1982. Changes in
inorganic and organic soil phosphorus fraction induced by cultivation practices and laboratory incubation. Soil Science American Journal 46: 970-976.
Hongqing, H.; Chunying, T.; Chongfa, C.; Jizheng, H.; Xueyuan, L. 2001. Availability and residual effects of phosphate rock and inorganic P fraction in a red soil of Central China. Nutrient Cycling in Agroecosystems 59: 251-258.
Howeler, R.H.; Cadavid, L.F. 1990. Short- and long-term fertility trials in Colombia to determine the nutrient requirements of cassava. Fertilizer Research 26: 61-80.
Jemo, M.; Abaidoo, R.C.; Nolte, C.; Horst, W. 2006. Genotypic variation for phosphorus uptake and dinitrogen fixation in cowpea on low-phosphorus soils of southern Cameroon. Journal of Plant Nutrition and Soil Science 169: 816-825. Moura, E.G.; Moura, N.G.; Marques, E.S.; Pinheiro, K.M.; Costa
Sobrinho, J.R.S. 2009. Evaluating chemical and physical quality indicators for a structurally fragile tropical soil. Soil Use and Management 25: 368-375.
Moura, E.G.; Serpa, S.S.; Santos, J.G.D.; Costa Sobrinho, J.R.S.; Aguiar, A.C.F. 2010. Nutrient use efficiency in alley cropping systems in the Amazonian periphery. Plant and Soil 335: 363-371.
Moura, E.G.; Oliveira, A.K.C.; Pinheiro, K.M.; Aguiar, A.C.F. 2012. Management of a cohesive tropical soil to enhance rootability and increase the efficiency of nitrogen and potassium use. Soil Use and Management 28: 370-377.
Mullins, C.E. 1999. Hardsetting soils. p. G65-G87. In: Summer, M.E., ed. Handbook of soil science. CRC Press, Boca Raton, FL, USA.
Murphy, J.; Riley, J.P. 1962. A modified single solution method for the determination of phosphate in natural waters. Analytica Chimica Acta 27: 31-36.
Mweta, D.E.; Akinnifesi, F.K.; Saka, J.D.K.; Makumba, W.; Chokotho, N. 2007. Green manure from phosphorus adsorption and uptake by maize crop in a gliricidia-maize intercropping. Science Research Essays 2: 446-453.
Okon, I.E. 2011. Field response of two cassava genotypes inoculated with arbuscular mycorrhizal fungus to Gliricidia sepium mulch in a tropical Alfisol. Botany Research International 4: 4-8. Raij, B.; Quaggio, J.A.; Silva, N.M. 1986. Extraction of phosphorus,
potassium, calcium, and magnesium from soils by an ion-exchange resin procedure. Communications in Soil Science and Plant Analysis 17: 547-566.
Ramesh, T.; Chinnusamyand, C.; Jayanthi, C. 2003. Green manuring in sugarcane: a review. Agriculture Research 24: 130-135.
Ribeiro, A.C.; Guimarães, P.T.G.; Alvarez, V.H.V. 1999. Recommendations for the Use of Lime and Fertilizer in Minas Gerais: 5th Approach = Recomendações para o Uso de Corretivos e Fertilizantes em Minas Gerais: 5ª Aproximação. CFSEMG, Lavras, MG, Brazil (in Portuguese).
Rivaie, A.A.; Loganathan, P.; Graham, J.D.; Tillman, R.W.; Payn, T.W. 2008. Effect of phosphorus rock and triple superphosphate on soil phosphorus fractions and their plant-availability and downward movement in two volcanic ash soils under Pinus
radiate plantations in New Zealand. Nutrient Cycling in
Agroecosystems 82: 75-88.
Shepherd, M.A.; Harrison, R.; Webb, J. 2002. Managing soil organic matter: implications for structure on organic farms. Soil Use and Management 18: 284-292.
Singh, C.P.; Amberger, A. 1990. Humic substances in straw compost with rock phosphate. Biological Wastes 31: 165-174. Thomasson, A.J. 1978. Towards an objective classification of soil