Triiodothyronine modulates the expression of leptin
and adiponectin in 3T3-L1 adipocytes
Triiodotironina modula a expressão de leptina e adiponectina em adipócitos 3T3-L1
Miriane de Oliveira1, Maria Teresa De Síbio1, Regiane Marques Castro Olimpio1, Fernanda Cristina Fontes Moretto1,
Renata de Azevedo Melo Luvizotto2, Celia Regina Nogueira1
ABSTRACT
Objective: To study the effect of different doses of triiodothyronine on gene expression of the adipokines leptin and adiponectin, at different times, and to evaluate the difference in expression between the two adipokines in each group. Methods: 3T3-L1 adipocytes were incubated with triiodothyronine at physiological dose (10nM) and supraphysiological doses (100nM or 1,000nM), or without triiodothyronine (control, C) for 0.5, 6, or 24 hours. Leptin and adiponectin mRNA was detected using real-time polymerase chain reaction (RT-PCR). One-way analyses of variance, Tukey’s test or Student’s t test, were used to analyze data, and significance level was set at 5%. Results: Leptin levels decreased in the 1,000nM-dose group after 0.5 hour. Adiponectin levels dropped in the 10nM-dose group, but increased at the 100nM dose. After 6 hours, both genes were suppressed in all hormone concentrations. After 24 hours, leptin levels increased at 10, 100 and 1,000nM groups as compared to the control group; and adiponectin levels increased only in the 100nM group as compared to the control group. Conclusion: These results demonstrated fast actions of triiodothyronine on the leptin and adiponectin expression, starting at 0.5 hour, at a dose of 1,000nM for leptin and 100nM for adiponectin. Triiodothyronine stimulated or inhibited the expression of adipokines in adipocytes at different times and doses which may be useful to assist in the treatment of obesity, assuming that leptin is increased and adiponectin is decreased, in obesity cases.
Keywords: Leptin; Adiponectin; Triiodothyronine; Adipocytes
RESUMO
Objetivo: Examinar o efeito de diferentes doses de triiodotironina sobre a expressão gênica das adipocinas leptina e adiponectina,
em diferentes períodos de tempo, além de avaliar a diferença de expressão entre as duas adipocinas em cada grupo. Métodos: Adipócitos 3T3-L1 foram incubados com triiodotironina nas doses fisiológica (10nM) e suprafisiológicas (100nM ou 1.000nM), ou na ausência de triiodotironina (controle, C) durante 0,5, 6 ou 24 horas. O mRNA das adipocinas foi analisado em tempo real, utilizando a reação em cadeia de polimerase. Para as análises dos dados, foi utilizada a análise de variância, complementada com o teste de Tukey, ou o teste t de Student com 5% de significância. Resultados: Os níveis de leptina diminuíram no grupo com dose de 1.000nM em 0,5 hora. A adiponectina também diminuiu no grupo com dose de 10nM, porém se elevou com a dose de 100nM. Após 6 horas, ambos os genes foram suprimidos em todas concentrações de hormônio. Em 24 horas, os níveis de leptina foram elevados em 10, 100 e 1.000nM, em relação ao grupo controle. No que concerne à adiponectina, observou-se aumento apenas no grupo cuja dose foi de 100nM, em comparação ao controle. Conclusão: Foram demonstradas ações rápidas da triiodotironina sobre a expressão da leptina e da adiponectina, iniciando em 0,5 hora na dose de 1.000nM, para a primeira, e na dose de 100nM, para a segunda. A triiodotironina estimulou ou inibiu a expressão de adipocinas em adipócitos em diferentes tempos e doses, o que pode auxiliar no tratamento da obesidade, levando em consideração que, nesta, a leptina está aumentada e adiponectina, diminuída.
Descritores: Leptina;Adiponectina; Tri-Iodotironina; Adipócitos
INTRODUCTION
The effects of thyroid hormones (THs) are especially important during development, since they regulate the growth and maturation of different organs and tissues
during fetal and neonatal life.(1,2) Many tissues are
1 Universidade Estadual Paulista “Júlio de Mesquita Filho”, Botucatu, SP, Brazil. 2 Universidade Federal de Mato Grosso, Cuiabá, MT, Brazil.
Corresponding author: Miriane de Oliveira – Distrito de Rubião Jr., s/n – Distrito Rubião Jr – Zip code: 18618-000 – Botucatu, SP, Brazil – Phone: (55 14) 3881-6213 – E-mail: [email protected] Received on: Feb 16, 2014 – Accepted on: Jan 12, 2015
regulated by THs to their full development, including effects on gene groups involved in the differentiation process. Like other tissues, the adipose tissue (AT) is
an important target for THs,(3) because it specializes in
transport, synthesis, storage and mobilization of lipids. Its primary function is the storage of energy in the form of triglycerides, providing a reserve of energy to be used
in times of caloric deprivation.(4) The AT is the largest
endocrine organ in the whole body, secreting hormones, chemokines and adipokines, which are important paracrine/
endocrine regulators.(5)
THs, especially triiodothyronine (T3), modulate
the proliferation and differentiation of adipocytes(6)
and are involved in cellular processes such as signal transduction, apoptosis, and inflammatory response.
Leptin and adiponectin are adipokines synthesized and secreted by the AT. Leptin acts mainly on the central nervous system, producing anorectic effects and
stimulating energy expenditure.(7) Adiponectin is involved
in important metabolic effects, such as stimulating fatty acid oxidation, reducing gluconeogenesis and increasing thermogenesis.(8-11)
Obese humans have high serum levels of leptin. Leptin concentrations are directly proportional to body
fat mass, specifically the volume of adipocytes.(12,13)
Regarding THs, there is evidence indicating that human obesity is usually associated with increased levels of
thyroid stimulating hormone (TSH) and T3.(14,15) As
in mice, human studies came to conflicting results on the effect of THs on leptin concentrations. In subjects
with hypothyroidism, leptin was found increased,(16,17)
decreased(18,19) or unchanged(20,21) when compared with
euthyroid individuals. The same controversial results
are found in studies with hyperthyroidism patients.(16-22)
The administration of T3 in hypothyroid rats decreased the messenger RNA (mRNA) expression of leptin in the
AT and circulating levels of leptin.(23) However, in other
studies, THs increased leptin in adipocytes differentiated
from 3T3-L1 cells.(24) Studies in humans did not show
conclusive evidence on the relationship between THs and leptin levels.(25,26)
Adiponectin shares some physiological effects with THs, such as reducing body fat, increasing thermogenesis
and promoting lipid oxidation.(27)
The interaction between THs and adiponectin concentrations is still undefined. Some studies suggest that thyroid function has influence on its serum levels. Some authors have reported that the concentration of this adipokine is higher in hyperthyroidism, when compared with hypothyroidism in patients with Graves’
disease(28) and in euthyroid patients with Basedow’s
disease.(29)
Studies on a possible relation between adiponectin and deviations in lipid metabolism associated with thyroid dysfunction are scarce. Patients with hyperthyroidism showed increased body weight, cholesterol and body mass index after controlling for thyrotoxicosis. After adjusting adiponectin levels for body mass index, no significant change was observed in patients with hyper- and hypothyroidism, suggesting that THs play a small
role in the modulation of adiponectin levels.(30)
THs act by increasing the metabolic rate and oxygen consumption, regulating heat production and energy supply; leptin and adiponectin are involved in the
regulation of energy balance.(31)
Conflicting results may be explained by the existence of many factors influencing the levels of leptin, adiponectin and THs, and more studies are needed to fully explain the relation between leptin, adiponectin and THs.
The biological roles of THs, leptin and adiponectin intersect at regulation of energy expenditure, and this provides a way to study the response of the AT to T3 without the interference of systemic factors. Therefore, we evaluated the effects of different doses of T3 at different timepoints on the levels of gene
expression of leptin and adiponectin, in vitro, in 3T3-L1
cells differentiated into adipocytes. Both adipokines are modulated by T3 over short or long periods, increasing or decreasing, according to the dose of this hormone.
Our study aims to demonstrate that physiological doses of T3 act by decreasing gene expression of adiponectin and increasing that of leptin. However, supraphysiological doses of T3 act over longer time frames, increasing the concentration of leptin and decreasing that of adiponectin. Our results confirm the action of T3 on the AT at the physiological dose and allow for further studies on the use of T3 in the treatment of obese patients. As shown in the literature, after losing 5-10% of weight, weight loss becomes
more difficult,(32) and patients show low serum T3
levels.(33) Therefore, our findings could warrant the
administration of physiological doses of the hormone at this stage of the treatment.
OBJECTIVE
METHODS
Cell culture and differentiation
The experimental protocol was approved by the Ethics
Committee for Animal Studies of the Faculdade de
Medicina de Botucatu da Universidade Estadual Paulista
“Júlio de Mesquita Filho”, under number 752.
For the in vitro study, we used the cell line 3T3-L1.
These cells were obtained from the Cell Bank of the
Universidade Federal do Rio de Janeiro (UFRJ) and
cultured as described in the literature,(34) in Dulbecco’s
modified medium (DMEM; Gibco®) supplemented
with 10% fetal bovine serum (FBS; Gibco®), 1%
antibiotic/antimycotic (Sigma®), under an atmosphere
of 5% carbon dioxide (CO2) at 37°C. The cells were
kept under culture in said conditions until reaching a confluence of approximately 100%, and then were transferred to six-well plates for the experiments. After reaching 100% confluence in the wells, the cells were subjected to differentiation. They were kept for 3 days in DMEM containing 10% FBS, 100mM
1-methyl-3-isobutylxanthine (IBMX; Sigma®), 1mM dexamethasone
(Sigma®) and 5mg/L insulin (Sigma®). After this period,
the cells were left for 7 days in DMEM containing 10% FBS and 5mg/mL insulin. After cell differentiation, adipocytes were subjected to TH depletion for 36 hours in DMEM supplemented with Charcoal-Stripped Fetal
Bovine Serum (Sigma®). After TH depletion, the cells
were treated with T3 at the physiological dose (10nM, designated F) or supraphysiological doses (100nM and 1,000nM, designated SI and SII, respectively) for 0.5, 6 and 24 hours. The group not treated with T3 was used as control (C).
Oil Red O
Staining
After 10 days of differentiation, the culture medium was removed from the cells and they were washed twice
with phosphate-buffered saline (PBS). Thereafter, we
added 1mL formaldehyde, in which the cells were left for 30 minutes at room temperature. After this time, the cells were washed three times with PBS. Then we
added 300μL Oil Red O (Sigma®), and the cells were
incubated for 2 hours at 37°C. After this period, they were again washed three times with distilled water and placed in oven to dry. The cells were observed under a microscope for verification of the differentiation by red
stainingof adipose cells.
Gene expression
Total RNA was extracted from 3T3-L1 cells using TRIzol®
(Invitrogen®) as reagent, according to the manufacturer’s
instructions. The High Capacity cDNA kit for reverse transcription in real-time polymerase chain reaction (RT-PCR, Invitrogen, São Paulo, Brazil) was used for the synthesis of 20μL complementary DNA (cDNA) from 1,000ng total RNA.
The levels of adiponectin (Applied Biosystems assay Mm00456425_m1) and leptin (Applied Biosystems assay Mm00434759_m1) were analyzed by real-time
PCR (RT-PCR). Analyzes were performed on Applied
Biosystems StepOne Plus, a detection system that uses the Taqman qPCR commercial kit (Invitrogen) according to the manufacturer’s instructions. The amplification conditions were as follows: enzyme activation at 50°C for 2 minutes; denaturation at 95°C for 10 minutes; cDNA products amplified with 40 denaturation cycles at 95°C for 15 seconds; and annealing/extension at 60°C for 1 minute.
After normalization to the internal control, cyclophilin
(assay Mm00434759_m1),(34) using the 2-ΔΔCt method as
previously described,(35) the mRNA expression of leptin
or adiponectin was evaluated for comparison between the values of Group C and the treatment groups (F, SI, SII), or comparison of the difference between expression of leptin and adiponectin within the same group. Relative quantification of gene expression was performed with
the comparative Cq method.(35)
Statistical analysis
The differences between mRNA levels of leptin and adiponectin in each group, whether or not treated,
were analyzed by the Student t test. The differences
in expression of the gene for leptin or adiponectin, at different T3 doses in each timepoint were assessed by analysis of variance (ANOVA) followed by Tukey’s test. Data were expressed as mean±standard deviation. The level of significance was set at 5%.
RESULTS
3T3-L1 Cell culture and differentiation
Figure 1A shows 3T3-L1 cells prior to differentiation. In the presence of the differentiation solution (insulin, dexamethasone and IBMX), preadipocytes developed the morphology of mature adipocytes (Figures 1B and 1C), with primary features, including a large number of cytoplasmic lipid droplets. Staining
with Oil Red O highlighted the lipid droplets in red
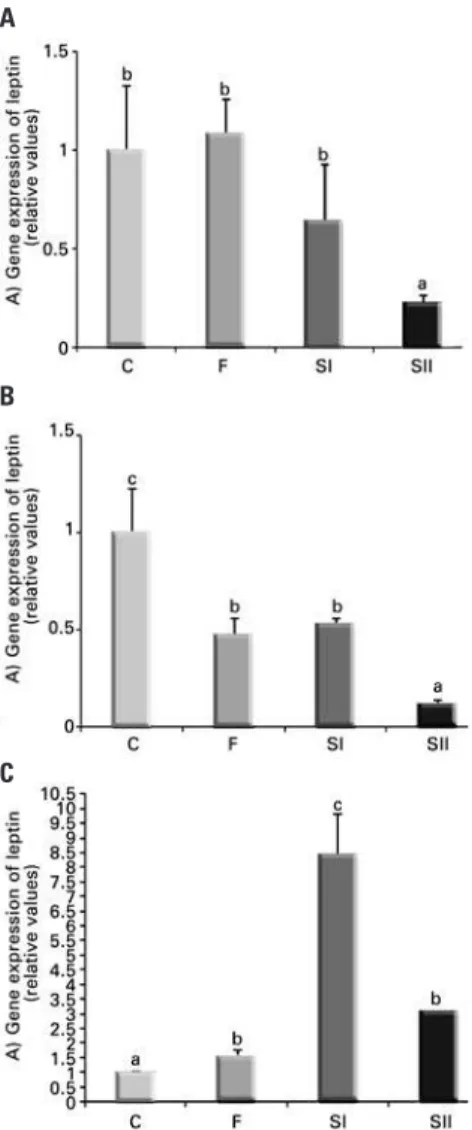
Different doses of triiodothyronine suppress mRNA
levels for leptin at 0.5 and 6 hours, but supraphysiological
doses increase levels at 24 hours
Figure 2 shows the modulation of mRNA levels for leptin in 3T3-L1 adipocytes, in the absence (C) or presence (F, SI, SII, respectively) of T3 at different timepoints (0.5, 6 and 24 hours) by RT-PCR.
Table 1. Adiponectin versus leptin at different timepoints within each group in the absence (control) or presence (10nM, 100nM and 1,000nM) of triiodothyronine
Groups according to timepoints
Adiponectin M ± SD
Leptin
M ± DP p value
0.5hr C 1.00±0.18 0.000034±0.000003 <0.001
F 0.28±0.08 0.000032±0.000005 0.005
SI 3.08±0.24 0.000017±0.000003 <0.001
SII 1.35±0.10 0.000007±0.000001 <0.001
6hr C 1.00±0.15 0.000033±0.000008 <0.001
F 0.23±0.05 0.000016±0.000003 0.002
SI 0.27±0.03 0.000018±0.000001 <0.001
SII 0.28±0.05 0.000004±0.0000008 <0.001
24hr C 1.00±0.17 0.000029±0.000001 <0.001
F 1.18±0.12 0.000045±0.000007 <0.001
SI 1.75±0.45 0.000248±0.000042 0.003
SII 0.71±0.14 0.000089±0.000001 <0.001
The mRNAs for adiponectin and leptin were analyzed by real-time polymerase chain reaction. Data expressed as mean ± standard deviation. Comparison of adiponectin versus leptin levels, within each group, with the Student t test. All assays were performed in triplicate (n = 3 for each treatment). M: mean; SD: standard deviation; C: control; F: triiodo-thyronine at 10nM; SI: triiodotriiodo-thyronine at 100nM; SII: triiodotriiodo-thyronine at 1,000nM.
Level of expression of adipokines in 3T3-L1 adipocytes
Table 1 shows the difference in expression levels between adipokines leptin and adiponectin for all groups at different timepoints. Adiponectin, whether with or without treatment, showed higher expression levels than leptin.
Figure 2. Effect of different doses of triiodothyronine on gene expression of leptin at 0.5 hour (A), 6 hours (B) and 24 hours (C). Data expressed as mean±standard deviation. We used analysis of variance, followed by Tukey’s test. Same letters represent p>0.05; different letters represent p<0.05. Comparisons of Groups F, SI or SII versus C, and F versus SI; F versus SII; SI versus SII. n=3 for each treatment. C: Control; F: triiodothyronine at 10nM; SI: triiodothyronine at 100nM; SII: triiodothyronine at 1,000 nM
A
B
C
Figure 2A shows the suppression of mRNA levels for leptin by T3 starting at 0.5 hour in SII compared with Groups C, F and SI. At 6 hours of incubation, there was a decrease in leptin mRNA in all treatment groups and this suppression was more pronounced in SII, compared with F and SI (Figure 2B). At 24 hours of incubation, leptin was increased in F, SI and SII compared with C, and the increase in SI was more pronounced than in F or SII (Figure 2C).
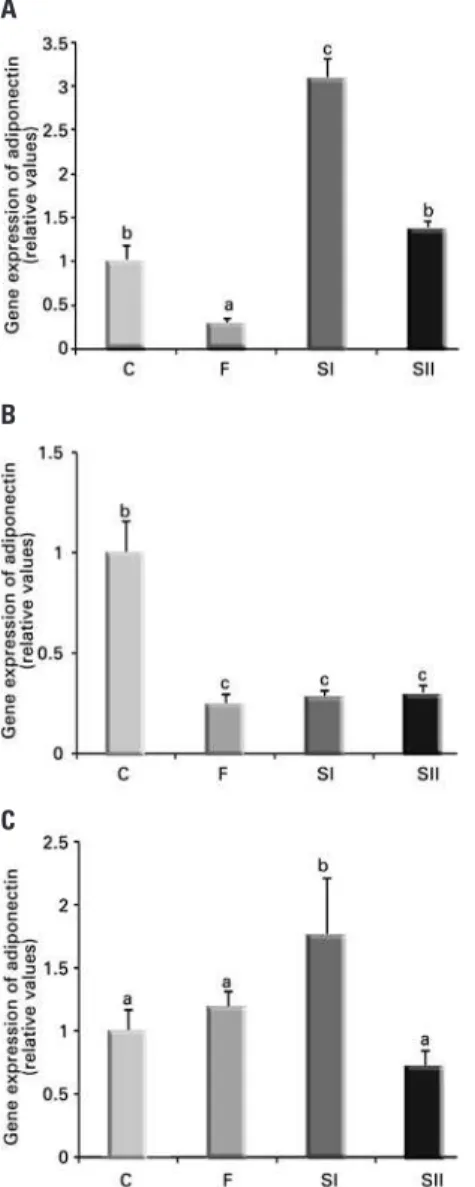
T3 modulates mRNA levels for adiponectin starting at
0.5 hour at different doses
Figure 3 shows the modulation of mRNA levels for adiponectin in 3T3-L1 adipocytes, in the absence (C) or presence (F, SI, SII, respectively) of T3 at different
Figure 1. 3T3-L1 cells before and after differentiation into adipocytes. (A) Non-differentiated cells. (B) Cells after 10 days of differentiation. (C) Cells stained with
Oil Red O after 10 days of differentiation. The arrows show the adipocyte with cytoplasmic lipid droplets
A
C
timepoints (0.5, 6 and 24 hours) by RT-PCR. At 0.5 hour, there was suppression of adiponectin expression in F and increase in SI when compared to C (Figure 3A). At 6 hours of incubation, the adiponectin gene expression was decreased by all doses (F, SI and SII) when compared with the control group (Figure 3B) At 24 hours, adiponectin returned to Group C levels in groups F and SII, and was increased in SI (Figure 3C).
DISCUSSION
Leptin and adiponectin differ from most other adipokines, because they are secreted exclusively by adipocytes. Although the details on all factors regulating
their synthesis, secretion and clearance are not entirely known, plasma leptin levels increase in proportion to fat mass, while adiponectin levels decrease with weight
gain.(36) Leptin and adiponectin are involved in the
regulation of energy balance, just like THs.(31)
We observed that adiponectin had higher expression than leptin in 3T3-L1 adipocytes, irrespective of the presence or absence of T3. This result can be explained by the fact that the 3T3-L1 adipocytes in this study did not represent a state of obesity. Obesity is based on an inflammatory process beginning with the increase of AT reserves, with hypertrophy and hyperplasia of this tissue, leading to the production of different proinflammatory molecules by both adipocytes themselves and the extracellular matrix that surrounds them. This, in turn, leads to the development of
systemic low-grade inflammation.(37) In obesity, leptin
production is also increased(38,39) while adiponectin
expression is decreased, and consequently so are its anti-inflammatory, anti-atherogenic and
insulin-sensitivity-promoting properties.(40,41)
Some studies have found a negative correlation
between THs and leptin(42,43) while others have found
an association.(44) Wang et al.(45) reported that although
leptin and THs can act through the same pathways to regulate energy metabolism, the effects of leptin on metabolism do not depend on the presence of THs. However, leptin and THs may share some target sites and, therefore, have additive effects.
Our findings are in agreement with Yoshida et
al.,(24) who observed modulation of leptin by T3 at
24 hours in 3T3-L1 adipocytes for all doses tested; however, our results showed that starting at 0.5 hour, T3 was already affecting the mRNA levels of this gene, which was suppressed by supraphysiological doses in SII. Previous studies by our group demonstrated an increase in leptin, both mRNA and protein, at 1 hour
of incubation.(34) Interestingly, at 6 hours of incubation,
leptin is suppressed by the different doses of T3 administered to Groups F, SI and SII. This decrease is more pronounced for the 1,000nM dose, at which leptin expression decreases as the T3 concentration increases,
just as observed in studies by Zabrocka et al.(43) and
Pinkney et al.(16)
In previous studies we demonstrated in rats subjected to food restriction that the physiological dose of T3 (0.5μg/100g) increased leptin expression, which translates into this being the dose required for proper expression of leptin in obese animals treated with
caloric restriction.(46) However, obese animals in a state
of hyperthyroidism (25μg T3 per 100g weight) showed decreased leptin levels, as well as animals subjected to
Figure 3. Effect of different doses of triiodothyronine on gene expression of adiponectin at 0.5 hour (A), 6 hours (B) and 24 hours (C). Data expressed as mean±standard deviation. We used analysis of variance, followed by Tukey’s test. Same letters represent p>0.05; different letters represent p<0.05. Comparisons of Groups F, SI or SII versus C, and F versus SI; F versus SII; SI
versus SII. n=3 for each treatment. C: Control; F: triiodothyronine at 10nM; SI: triiodothyronine at 100nM; SII: triiodothyronine at 1,000nM
A
B
food restriction in the same hyperthyroid conditions.(47) These results are in line with the findings of this study for the SII dose (1,000nM T3) at 0.5 hour, and for the tested treatments at 6 hours.
As for adiponectin, some studies suggest that thyroid function may influence its serum levels. Some authors reported that the concentration of this adipokine was higher in hyperthyroidism, compared to euthyroid and
hypothyroid conditions.(28,29) This corroborates the results
of our study, demonstrating that T3 affects the levels of adiponectin starting at 0.5 hour, with an increase in SI and decrease in F.
Just like leptin at 6 hours, adiponectin was suppressed by all doses tested and, at 24 hours, levels returned to C values or exceeded normal values, such as in Group SI.
Fasshauer et al.,(48) using the same experimental model,
observed no change in adiponectin levels at 16 hours of incubation with the same dose administered to Group SII, which demonstrated that T3 effects fluctuate over time.
Our results corroborate those of Saito et al.(29)
and Yaturu et al.(28) Adiponectin was found increased
in the groups receiving supraphysiological doses of
T3, mimicking hyperthyroidism. Cabanelas et al.(49)
concluded in their study that THs regulate mRNA expression of adiponectin in a tissue-specific fashion, without changing its secretion in the white AT.
Previous studies by our group showed that obese animals had decreased serum adiponectin and AT mRNA, and decreased leptin when compared with the control. Interestingly, the administration of supraphysiological T3 (25μg/100g) decreased body fat mass, serum levels
of adiponectin and leptin, and mRNA.(50) However, in
contrast, an experimental study in rats with hyperthyroidism
showed a significant increase in serum adiponectin.(51)
The findings of this in vitro study indicated that increase
or decrease in leptin or adiponectin expression by T3 are dose- and time-dependent.
The results presented are important for understanding at which dose (physiological or supraphysiological) and over which period of time the modulation of adipokines leptin and adiponectin is triggered by T3 in mature adipocytes. It is now possible to aim for further studies focusing on the treatment of obesity with TH analogs, considering their ability to modulate the genes approached in this study.
CONCLUSION
Our results demonstrated rapid effects of triiodothyronine on the expression of leptin and adiponectin, starting at 0.5 hour at 1,000nM for leptin, and 100nM for adiponectin.
Triiodothyronine stimulated or inhibited the expression of adipokines in adipocytes at different timepoints and doses, which can be helpful to assist in the treatment of obesity, considering that in this condition, leptin is increased and adiponectin decreased.
ACKNOWLEDGEMENTS
This study had financial support from Fundação de
Amparo à Pesquisa do Estado de São Paulo (FAPESP), [The State of São Paulo Research Foundation] under protocol number 2010/16911-4, for the development
of the project. The Coordenação de Aperfeiçoamento
de Pessoal de Nível Superior (CAPES), [Coordination for the Improvement of Higher Education Personnel] granted scholarship for development of the project by the author. The funders did not take part in study design, data collection and analysis, decision to publish or manuscript preparation.
REFERENCES
1. Bernal J. Action of thyroid hormone in brain. J Endocrinol Invest. 2002;25(3): 268-88. Review.
2. Morreale de Escobar G, Obregon MJ, Escobar del Rey F. Role of thyroid hormone during early brain development. Eur J Endocrinol. 2004;151 Suppl 3:U25-U37. Review.
3. Viguerie N, Millet L, Avizou S, Vidal H, Larrouy D, Langin D. Regulation of human adipocyte gene expression by thyroid hormone. J Clin Endocrinol Metab. 2002;87(2):630-4.
4. Obregon MJ. Thyroid hormone and adipocyte differentiation. Thyroid. 2008; 18(2):185-95. Review.
5. Gregor MF, Hotamisligil GS. Inflammatory mechanisms in obesity. Annu Rev Immunol. 2011;29:415-45. Review.
6. Darimont C, Gaillard D, Ailhaud G, Negrel R. Terminal differentiation of mouse preadipocyte cells: adipogenic and antimitogenic role of triiodothyronine. Mol Cell Endocrinol. 1993;98(1):67-73.
7. Flier JS. Clinical review 94: What’s in a name? In Search of leptin’s physiologic role. J Clin Endocrinol Metab. 1998;83(5):1407-13. Review.
8. Fruebis J, Tsao TS, Javorschi S, Ebbets-Reed D, Erickson MR, Yen FT, et al. Proteolytic cleavage product of 30-kDa adipocyte complement-related protein increases fatty acid oxidation in muscle and causes weight loss in mice. Proc Natl Acad Sci USA. 2001;98(4):2005-10.
9. Tomas E, Tsao TS, Saha AK, Murrey HE, Zhang CC, Itani SI, et al. Enhanced muscle fat oxidation and glucose transport by ACRP30 globular domain: acetyl-CoA carboxylase inhibition and AMP-activated protein kinase activation. Proc Natl Acad Sci USA. 2002;99(25):16309-13.
10. Yamauchi T, Kamon J, Minokoshi Y, Ito Y, Waki H, Uchida S, et al. Adiponectin stimulates glucose utilization and fatty acid oxidation by activating AMP-activated protein Kinase. Nat Med. 2002;8(11):1288-95.
11. Qi Y, Takahashi N, Hileman SM, Patel HR, Berg AH, Pajvani UB, et al. Adiponectin acts in the brain to decrease body weight. Nat Med. 2004; 10(5):524-9. Erratum in: Nat Med. 2004;10(6):649.
13. Hamilton BS, Paglia D, Kwan AY, Deitel M. Increased obese mRNA expression in omental fat cells from massively obese humans. Nat Med. 1995;1(9):953-6. 14. Reinehr T, Isa A, de Sousa G, Dieffenbach R, Andler W. Thyroid hormones and
their relation to weight status. Horm Res. 2008;70(1):51-7.
15. Kok P, Roelfsema F, Langendonk JG, Frölich M, Burggraaf J, Meinders AE, et al. High circulating thyrotropin levels in obese women are reduced after body weight loss induced by caloric restriction. J Clin Endocrinol Metab. 2005;90(8):4659-63.
16. Pinkney JH, Goodrick SJ, Katz J, Johnson AB, Lightman SL, Coppack SW, et al. Leptin and the pituitary-thyroid axis: a comparative study in lean, obese, ypothyroid and hyperthyroid subjects. Clin Endocrinol (Oxf). 1998;49(5):583-8. 17. Chen MD, Song YM, Tsou CT, Lin WH, Sheu WH. Leptin concentration and the
Zn/Cu ratio in plasma in women with thyroid disorder. Biol Trace Elem Res. 2000;75(1-3):99-105.
18. Valcavi R, Zini M, Peino R, Casanueva FF, Dieguez C. Influence of thyroid status on serum immunoreactive leptin levels. J Clin Endocrinol Metab. 1997;82(5):1632-4.
19. Diekman MJ, Romijn JA, Endert E, Sauerwein H, Wiersinga WM. Thyroid hormones modulate serum leptin levels: observations in thyrotoxic and hypothyroid women. Thyroid. 1998;8(12):1081-6.
20. Sreenan S, Caro JF, Refetoff S. Thyroid dysfunction is not associated with alterations in serum leptin levels. Thyroid. 1997;7(3):407-9.
21. Matsubara M, Yoshizawa T, Morioka T, Katayose S. Serum leptin and lipids in patients with thyroid dysfunction. J Atheroscler Thromb. 2000;7(1):50-4. 22. Pinkney JH, Goodrick SJ, Katz JR, Johnson AB, Lightman SL, Coppack SW,
et al. Thyroid and sympathetic influences on plasma leptin in hypothyroidism and hyperthyroidism. Int J Obes Relat Metab Disord. 2000;24 Suppl 2:S165-6. 23. Fain JN, Bahouth SW. Effect of tri-iodothyronine on leptin release and leptin
mRNA accumulation in rat adipose tissue. Biochem J. 1998;332(Pt 2):361-6. 24. Yoshida T, Monkawa T, Hayashi M, Saruta T. Regulation of expression of
leptin mRNA and secretion of leptin by thyroid hormone in 3T3-L1 adipocytes. Biochem Biophys Res Commun. 1997;232(3):822-6.
25. Simó R, Hernández C, Zafon C, Galofré P, Castellanos JM, Mesa J. Short-term hypothyroidism has no effect on serum leptin concentrations. Diabetes Obes Metab. 2000;2(5):317-21.
26. Obermayer-Pietsch BM, Frühauf GE, Lipp RW, Sendlhofer G, Pieber TR. Dissociation of leptin and body weight in hyperthyroid patients after radioiodine treatment. Int J Obes Relat Metab Disord. 2001;25(1):115-20.
27. Ahima RS, Flier JS. Adipose tissue as an endocrine organ. Trends Endocrinol Metab. 2000;11(8):327-32. Review.
28. Yaturu S, Prado S, Grimes SR. Changes in adipocyte hormones leptin, resistin, and adiponectin in thyroid dysfunction. J Cell Biochem. 2004;93(3):491-6. 29. Saito T, Kawano T, Saito T, Ikoma A, Namai K, Tamemoto H, et al. Elevation of
serum adiponectin levels in Basedow disease. Metabolism. 2005;54(11):1461-6. 30. Iglesias P, Alvarez Fidalgo P, Codoceo R, Díez JJ. Serum concentrations of
adipocytokines in patients with hyperthyroidism and hypothyroidism before and after control of thyroid function. Clin Endocrinol (Oxf). 2003;59(5):621-9. 31. Vendrell J, Broch M, Vilarrasa N, Molina A, Goméz JM, Gutiérrez C, et
al. Resistin, adiponectin, ghrelin, leptin, and proinflammatory cytokines: relationships in obesity. Obes Res. 2004;12(6):962-71.
32. Moore R, Grant AM, Howard AN, Mills IH. Treatment of obesity with triiodothyronine and a very-low-calorie liquid formula diet. Lancet. 1980; 1(8162):223-6.
33. Moreira-Andrés MN, Del Cañizo-Gómez FJ, Black EG, Hoffenberg R. Long-term evaluation of thyroidal response to partial calorie restriction in obesity. Clin Endocrinol (Oxf). 1981;15(6):621-6.
34. de Oliveira M, Luvizotto Rde A, Olimpio RM, De Sibio MT, Conde SJ, Biz Rodrigues Silva C, et al. Triiodothyronine increases mRNA and protein leptin levels in short time in 3T3-L1 adipocytes by PI3K pathway activation. PLoS One. 2013;18;8(9):e74856.
35. Livak KJ, Schmittgen TD. Analysis of relative gene expression data using real-time quantitative PCR and the 2(-Delta Delta C(T))Method. Methods. 2001;25(4):402-8.
36. Gray SL, Vidal-Puig AJ. Adipose tissue expandability inthe maintenance of metabolic homeostasis. Nutr Rev. 2007;65(6 Pt 2):S7-12.
37. Hansen D, Dendale P, Beelen M, Jonkers RA, Mullens A, Corluy L, et al. Plasma adipokine and inflammatory marker concentrations are altered in obese, as opposed to non-obese, type 2 diabetes patients. Eur J Appl Physiol. 2010;109(3):397-404.
38. Ahima RS. Adipose tissue as an endocrine organ. Obesity (Silver Spring). 2006;14 Suppl 5:242S-249S. Review.
39. Fain J. Release of inflammatory mediators by human adipose tissue is enhanced in obesity and primarily by the nonfat cells: a review. Mediators Inflamm. 2010;2010:513948. Review.
40. Engeli S, Feldpausch M, Gorzelniak K, Hartwig F, Heintze U, Janke J, et al. Association between adiponectin and mediators of inflammation in obese women. Diabetes. 2003;52(4):942-7.
41. Simpson KA, Singh MA. Effects of exercise on adiponectin: a systemic review. Obesity (Silver Spring). 2008;16(2):241-56. Review.
42. Escobar-Morreale HF, Escobar del Rey F, Morreale de Escobar G. Thyroid hormones influence serum leptin concentrations in the rat. Endocrinology. 1997;138(10):4485-8.
43. Zabrocka L, Klimek J, Swierczynski J. Evidence that triiodothyronine decreases rat serum leptin concentration by down-regulation of leptin gene expression in white adipose tissue. Life Sci. 2006;79(11):1114-20.
44. Näslund E, Andersson I, Degerblad M, Kogner P, Kral JG, Rössner S, et al. Associations of leptin, insulin resistance and thyroid function with long-term weight loss in dieting obese men. J Intern Med. 2000;248(4):299-308. 45. Wang JL, Chinookoswong N, Yin S, Shi ZQ. Calorigenic actions of leptin are
additive to, but not dependent on, those of thyroid hormones. Am J Physiol Endocrinol Metab. 2000;279(6):E1278-85.
46. Luvizotto RA, Conde SJ, Síbio MT, Nascimento AF, Lima-Leopoldo AP, Leopoldo AS, et al. Administration of physiologic levels of triiodothyronine increases leptin expression in calorie-restricted obese rats, but does not influence weight loss. Metabolism. 2010;59(1):1-6.
47. Luvizotto RA, Síbio MT, Olímpio RM, Nascimento AF, Lima-Leopoldo AP, Leopoldo A, et al. Supraphysiological triiodothyronine doses diminish leptin and adiponectin gene expression, but do not alter resistin expression in calorie restricted obese rats. Horm Metab Res. 2011;43(7):452-7.
48. Fasshauer M, Klein J, Neumann S, Eszlinger M, Paschke R. Hormonal regulation of adiponectin gene expression in 3T3–L1 adipocytes. Biochem Biophys Res Comm. 2002;290(3):1084-9.
49. Cabanelas A, Cordeiro A, Santos Almeida NA, Monteiro de Paula GS, Coelho VM, Ortiga-Carvalho TM, et al. Effect of triiodothyronine on adiponectin expression and leptin release by white adipose tissue of normal rats. Horm Metab Res. 2010;42(4):254-60.
50. Luvizotto Rde A, do Nascimento AF, Síbio MT, Olímpio RM, Conde SJ, Lima-Leopoldo AP, et al. Experimental hyperthyroidism decreases gene expression and serum levels of adipokines in obesity. Scientific World Journal. 2012; 2012:780890.