332
A SHORT ANALYSIS ON THE SENSITIVITY OF TAX REVENUES IN
ROMANIA DURING 2000 - 2009
Bunescu Liliana
Lucian Blaga University of Sibiu
Faculty of Economics
Mihaiu Diana Marieta
Lucian Blaga University of Sibiu
Faculty of Economics
From a temporal perspective, the collected tax revenues for the public budget know a number of changes in terms of flow and collection rates due to changes in factors of influence. The most used method to measure the response, the sensitivity of tax revenue to any changes of a variable is elasticity. This paper seeks to briefly examine the sensitivity of tax revenues to changes occurring in terms of gross domestic product and tax burden in Romania during 2000 to 2009. After analysis, we believe that a pattern regarding the sensitivity of tax revenues to the modification of a factor can not be created, tax elasticity developments and alternations of elasticity / inelasticity are not based on a uniform rule, they differ from country to country, and even in the same country from one period to another.
Keywords: tax elasticity, tax burden, tax revenues
JEL Classification: H 23, H 30
1. Introduction
Taxes generate the biggest part of public resources and that is not a novelty. Currently, both theorists and practitioners` concerns are increasingly focusing on the question of the relative sizing of tax compared to its base of calculation and also compared to the source of taxes, source which is ultimately reduced and expressed in the purchasing power of taxpayers. Taxpayers are more interested in the net incomes and the extent to which these are affected by taxes. Tax burden indicates the degree of taxation, meaning the extent to which taxpayers as a whole, society, economy supports a range of taxes, such as compulsory levies, imposed and charged by the state through legal compulsion. Tax burden and the degree of taxation is a way of sizing the tax incidence.
2. Sensitivity of tax revenues based on GDP
From a time perspective (short or long), tax revenues collected by the national public budget know a number of changes in terms of flow and collection rates due to changes of factors of influence. The analysis of the impact of changes in the factors of influence can be made by studying their magnitude. The most frequently used method of measuring the response, the sensitivity of tax revenue to the change of a variable, is elasticity. It can be measured by a coefficient of elasticity of tax revenues based on GDP and the tax rate, considering other factors unchanged (caeteris paribus).
333
authors: Singer (1968), Chand and Wolf (1973), Khan (1973), Artus (1974) or Ehdaie Jaber (1990), each one developing an econometric model of measurement.
The coefficient of elasticity of tax revenues (Ef/PIB) indicates the degree, fraction or percentage of changes in compulsory levies based on the changes in GDP or other conditions of tax revenues (eg. tax rate). The general form of the coefficient of tax elasticity based on GDP is as follows:
Where: Vf – tax revenues Ef/PIB= PIB – GDP (gross domestic product)
Tax elasticity based on GDP calculates how strongly tax revenues collected fot the national public budget reacts to a change of one percentage of the GDP, tax revenues being characterized by elasticity or inelasticity, depending on the result of the calculated coefficient of elasticity. It may tend to infinity, may be higher, lower or equal to 1 or may tend to zero causing the framing tax revenue in a particular category of elasticity.
Let’s consider the following table where budget executions in matter of public revenues in
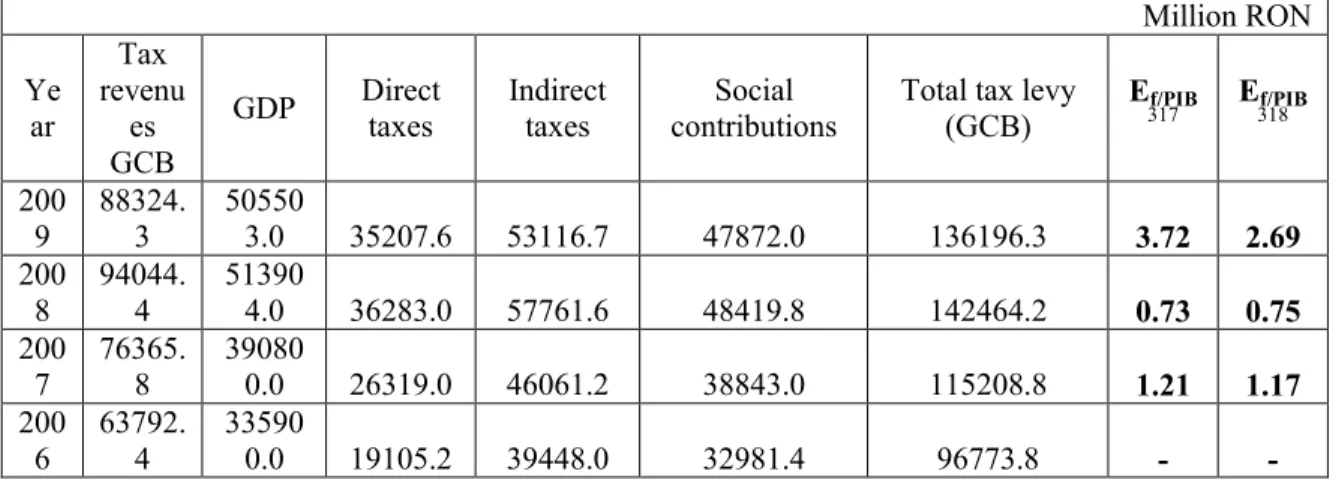
Romania during 2006 – 2009 are centralized. Data was collected from the General Consolidated Budget, which is why the heading "tax income" does not include contributions owed by taxpayers for state social security, health or unemployment, but only taxes levied by the state budget or local budgets. Considering that the taxpayer, individual or legal person, has to burden of not only levies in the form of taxes, bur also social contributions, we will analyze tax elasticity based on GDP, differentiated by tax levies in the form of taxes and by total tax levies, including social contributions.
Table no.1 Evolution of budgetary indicators of the General Consolidated Budget of Romania 2006-2009
Million RON Ye ar Tax revenu es GCB
GDP Direct taxes
Indirect taxes
Social contributions
Total tax levy (GCB)
Ef/PIB
317 E318f/PIB
200 9
88324. 3
50550
3.0 35207.6 53116.7 47872.0 136196.3 3.72 2.69
200 8
94044. 4
51390
4.0 36283.0 57761.6 48419.8 142464.2 0.73 0.75
200 7
76365. 8
39080
0.0 26319.0 46061.2 38843.0 115208.8 1.21 1.17
200 6
63792. 4
33590
0.0 19105.2 39448.0 32981.4 96773.8 - -
Source: http://www.mfinante.ro/execbug.html, Romanian Ministry of Finance Provisional Execution of Consolidated General Budget
The analysis of the sensitivity of tax revenues to changes of 1% of GDP in 2006-2009 showed an elasticity coefficient with a positive sign, regardless of the the considered amounts included in the numerator, which reflects a directly proportional relationship between GDP and compulsory levies. In other words, the two indicators moved in the same direction but not in the same rhythm.
317
Elasticity coefficient of tax revenue (excluding social contributions) based on GDP. 318
Elasticity coefficient of tax revenue (including social contributions) based on GDP.
334
A positive economic growth is followed by the same effect of tax levies, while decreasing the amount of GDP resulted in a decrease in the amount of tax liabilities collected by the state. The type of tax elasticity is not monotonous, but it varies from year to year, alternating phases in which tax revenues are elastic or inelastic in relation to GDP. In 2008-2009 tax liabilities collected by public authorities are characterized by elasticity, with a coefficient of elasticity above the figure 1, of 2,69. This indicates that the decrease of GDP in 2009 compared to 2008, of 1,63 percent, generated an even wider change, also negative, of tax liabilities (taxes, fees, contributions) collected at the aggregate level, of 4,4 percent. In 2007-2008 the calculations show a subunit coefficient of tax elasticity based on GDP, of 0,75, therefore mandatory levies are inelastic, an increase of 31.5% of GDP generated a smaller increase of fiscal public revenues, of 23,66%. The period 2007-2006 is characterized by an almost monotonous tax elasticity, the two indicators evolved at about the same pace, but in the same direction.
Differentiated analysis of tax elasticity, including or excluding social contributions, determines us to say that taxes have a higher degree of flexibility, they are more sensitive to changes in GDP. The coefficient of elasticity in 2008-2009 of 3,72, indicates that a decrease of 1.7% of GDP generated in 2009 a deeper reduction of the amounts collected as taxes by 7.1%, ie 4 times
higher. The deficiency of statistical public information regarding Romania’s General
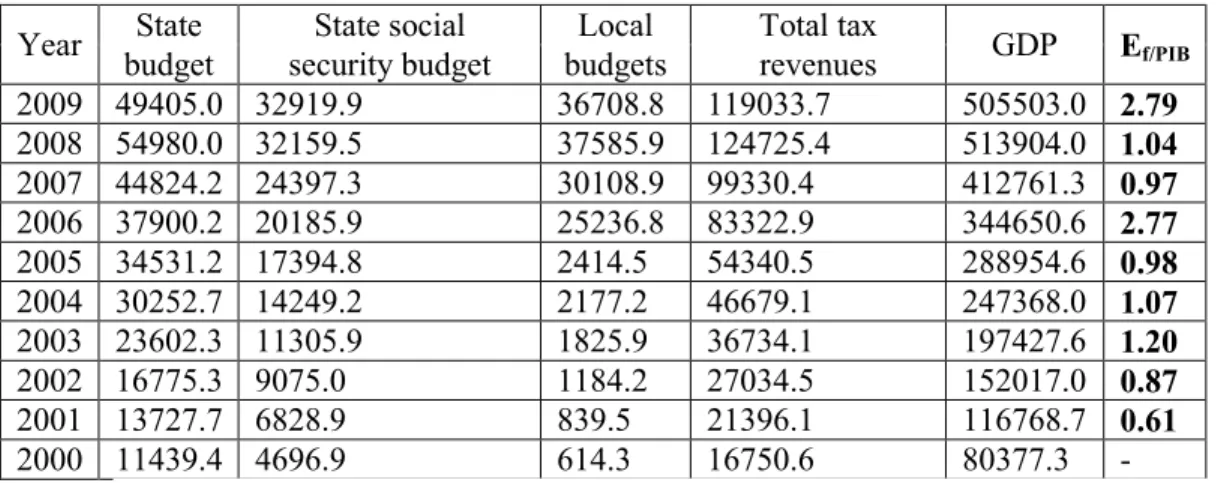
Consolidated Budget in the last 10 years, but especially their delayed publication, determines us to analyze tax sensitivity based on tax levies made by the three components of the National Public Budgets.
Table no. 2 Evolution of tax revenue from National Public Budget and tax elasticity in Romania between 2000 and 2009
million RON
Year State State social Local Total tax GDP Ef/PIB
budget security budget budgets revenues
2009 49405.0 32919.9 36708.8 119033.7 505503.0 2.79
2008 54980.0 32159.5 37585.9 124725.4 513904.0 1.04
2007 44824.2 24397.3 30108.9 99330.4 412761.3 0.97
2006 37900.2 20185.9 25236.8 83322.9 344650.6 2.77
2005 34531.2 17394.8 2414.5 54340.5 288954.6 0.98
2004 30252.7 14249.2 2177.2 46679.1 247368.0 1.07
2003 23602.3 11305.9 1825.9 36734.1 197427.6 1.20
2002 16775.3 9075.0 1184.2 27034.5 152017.0 0.87
2001 13727.7 6828.9 839.5 21396.1 116768.7 0.61
2000 11439.4 4696.9 614.3 16750.6 80377.3 -
Source: Statistical Yearbook of Romania from 2001-2008 and Provisional Execution of Consolidated Budget for 2008 and 2009, Ministry of Finance and own calculations
As can be seen in the table above, tax obligations in Romania are characterized by the predominance of unitary tax elasticity (2008, 2007, 2005, 2004), but there are years with high sensitivity to tax (2009, 2006, 2003) and years with inelastic tax obligations(2007, 2002, 2001). Highest degree of elasticity in the last 10 years in Romania was registered in 2009 compared to 2008, recession brought with it a more rapid decrease of tax levies for the National Public Budget compared with that of gross domestic product in the same period. Highest degree of tax inelasticity occurred in 2001, of 0,61, a 45,2% increase in GDP generated an increase of only 27,7% of compulsory levies made on behalf of the National Public Budget.
335
average recorded in the 27 member states of the European Union. The average tax elasticity of tax liability based on GDP in the EU-27 was 0,17 during 2008/2007, ie we face inelasticity. The positive sign of the tax sensitivity coefficient indicates a trend in the same sense of aggregate GDP in the European community and of taxes and contributions owed by all taxpayers, individuals or legal people, community residents. The increase of GDP of the European Union in 2008 with 1% to 12.506.778,5 million EURO, generated a positive development of tax levies of only 0,2% to 5.026.047 million EURO. From a structural point of view we can see a strong inelasticity in the case of direct taxes, which tend to zero in 2008 (0,15). A change in the GDP of the EU-27 generates an evolution in the same direction, but much smaller, of levies from direct taxes. EU-27 is characterized by a high degree of sensitivity between GDP and social security taxes collected by member countries, namely between GDP and indirect taxes. A change of 1% of GDP generally results of the European Union countries to collect with more than 1% of social contributions in their social security system. Noteworthy is the negative sign of the coefficient of tax elasticity of indirect taxes, which means that the increase of GDP by 1% resulted in the reduction of consumption taxes by 2,4%.
Romania presents a situation opposite to the European Union average in 2007-2008. In the of our country indirect taxes are the most sensitive to GDP changes, recording a unitary elasticity (1,01). Instead, tax inelasticity is specific for indirect taxes, the people being tempted to make long-term savings, than to consume.
3. Sensitivity of tax revenues based on fiscal pressure
Tax elasticity can also pe approached in terms of the relationship of tax revenues – tax burden. The coefficient of elasticity of tax revenue based on tax rate (Ef/RF) is calculated as a ratio between the percentage of changes in direct and indirect tax revenues and the percentage of changes in tax rate, while the other factors that influence tax revenues remain unchanged (caeteris paribus).
Where: Vf- tax revenues Ef/RF = RF – tax rate (tax burden)
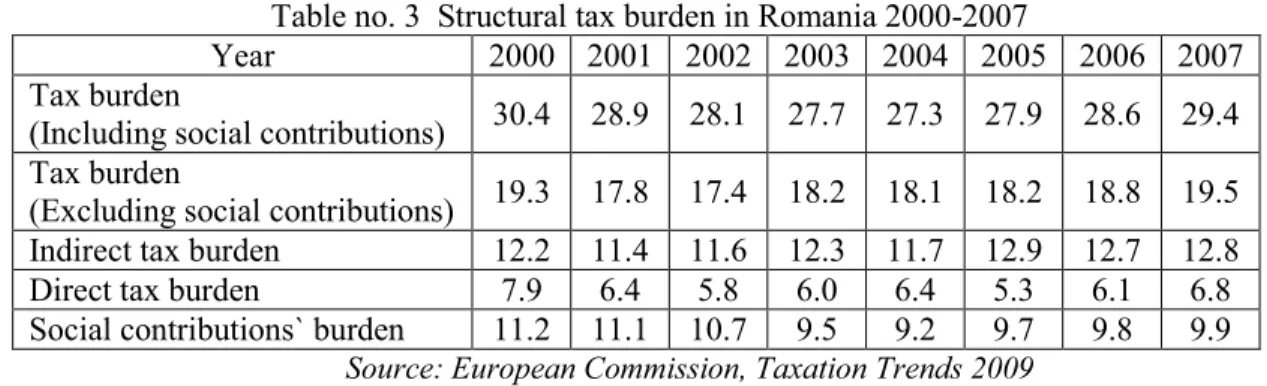
It should be noted that the tax elasticity measures the change in percentages, not absolute value (monetary unit), which allows comparisons across time and space. To determine the tax elasticity we need to know the evolution in time of the amounts collected by the public budget as taxes and contributions. During 2000-2007 all European Union member states have experienced an upward trend of compulsory levies on taxpayers. Is this due to the increase of tax burden?
Table no. 3 Structural tax burden in Romania 2000-2007
Year 2000 2001 2002 2003 2004 2005 2006 2007
Tax burden
(Including social contributions) 30.4 28.9 28.1 27.7 27.3 27.9 28.6 29.4 Tax burden
(Excluding social contributions) 19.3 17.8 17.4 18.2 18.1 18.2 18.8 19.5 Indirect tax burden 12.2 11.4 11.6 12.3 11.7 12.9 12.7 12.8
Direct tax burden 7.9 6.4 5.8 6.0 6.4 5.3 6.1 6.8
Social contributions` burden 11.2 11.1 10.7 9.5 9.2 9.7 9.8 9.9 Source: European Commission, Taxation Trends 2009
After analyzing the relationship between tax burden and the dynamic of tax revenues (including social contributions) in the EU-27 and Romania, we find that there may be a double correlation between the two indicators: a direct relationship - increase of tax burden is followed by the
0 0 0
0 100 0
100 0 %
%
Vf RF RF
Vf RF
RF Vf
Vf
RF RF Vf
Vf
RF Vf
´ D
D = D ¸ D = ´ D
´ D
= D
336
increase of the amount of collected tax revenues, which corresponds to the economic zone of the Laffer Curve (since 2003 for the EU-27 and in Romania after 2005), indirect relationship - increasing the tax burden creates a self defense reaction of taxpayers who are no longer willing to pay tax obligations and restrict their activities, thus revenues collected by authorities decrease, which corresponds to the non-economic area of the Laffer Curve, (EU-27 in 2001-2002, Romania in 2001-2004).
In the 27 European Union member states, during 2005-2007, there were recorded coefficients of elasticity higher than one and with a positive sign, indicating a directly proportional evolution of tax burden and tax liabilities collected on average by the 27 member states, a change of 1,4% of the first indicator causes a broader change of the second one, of over 5%. The most striking development was recorded in 2006 compared with 2005, when an increase in the tax burden of 0,3% from 36,9% in 2005 to 37% in 2006, was accompanied by an increase in tax revenue of 6,93%.
The evolution of tax revenue elasticity based on tax burden in Romania has achieved the same trend with the EU average, the years 2001-2004 were characterized by reductions in tax burdens that have resulted in additional sums to the public budget, while during 2005 - 2007 we witnessed an evolution in the same sense of tax burden and the amounts collected. It should be noted that Romania recordes very high values of elasticity coefficients when compared with the average of the EU-27, which leads us to say that compulsory levies in Romania are extremely sensitive to changes of tax burden, much more sensitive than in other cases, the Romanian taxpayer quickly reacting to any change of the tax burden he has to bear. The period of inversely proportional relationship of the two indicators in Romania, between2001-2004, stands out through a spectacular evolution in 2003, and 2004, when the gradual reductions with a few percents of the tax burden were accompanied by increases of the amounts collected to the budget of over 20%. In 2003, for example, a reduction of tax burden by 1,4% resulted in a positive response of taxpayers, they payed with 28,21% more tax liability to the public budget than the previous year, a situation favorable to Romania. These developments can be explained by the fact that in the same period Romania saw a record number of newly established companies on the fund of the law of microenterprises. We must also note tax elasticity after 2005 when, although tax burden started to rise, Romanians continued to bear it. In this case we deal with a high sensitivity to changes in two indicators (coefficients with values above one), but slightly lower than in the previous cases of
reverse evolution of the two indicators. For example, in 2007, an increase of Romanians’ tax
burden of 2,8% generated a positive reaction of the amounts levied by the state of 22,31%, 8 times more sensitive.
To summarize the ideas above, we can not create patterns regarding the sensitivity of tax revenues to the modification rates of tax burden , developments of elasticity coefficients and alternations of elasticity / inelasticity are not based on a uniform rule, they differ from country to country, and even in the same country from one period to another. Compared to Europeans who react favorably to a tightening tax burden rather than tax relaxation, Romanians react favorably to tax relaxation rather than a tighten one.
4. Conclusions
337
Tax burden may be regarded as the part of income that taxpayers surrender to the State as mandatory levies. Looking at tax burden as a mathematical expression of the ratio between tax and aggregate economic indicators is in fact designed to express tax return. The increase of taxes above certain limits incentives not work, investments and savings, but prelongs a crisis, already installed. Also, the increase of tax burden is a prerequisite for conflict and doens't generate motivation to work. Most tax liability encourages illegal employment and tax evasion. Reduced tax burden can be obtained on the basis of tax reforms which should aim at increasing the tax base while reducing tax rates without depriving the state budget of the revenues it needs.
Bibliography
1. Corduneanu Carmen, Sistemul fiscal în stiinţa finanţelor, Editura Codecs, Bucuresti, 1998. 2. Brezeanu Petre, Fiscalitatea – concepte, metode, practici, Editura Economică, Bucureşti,
1999.
3. Manolescu, G., (Coord.), Politici Economice, Academia Română, Institutul de cercetări financiare şi monetare Victor Slăvescu, Editura Economică, Bucureşti, 1997.
4. Popescu Dan (coord.), Economie politica, Editura Universităţii „Lucian Blaga” din Sibiu,
Sibiu, 2000.
5. Văcărel I. (coord.), Finanţe publice, Editia a VI-a, Editura Didactică şi pedagogică,
Bucuresti, 2006.
6. Vintilă, G., Fiscalitate. Metode şi tehnici fiscale, Ediţia a II-a, Editura Economică, Bucureşti,
2006.
7. European Commission, Taxation trends in the European Union, Luxemburg, 2009. 8.