TENDENCIES IN THE DEVELOPMENT OF BUDGET REVENUES UNDER
THE IMPACT OF TAX POLICY OF ROMANIA
DOBROTĂ GABRIELA
PROF. Phd. CONSTANTIN BRÂNCUȘI UNIVERSIY OF TÂRGU JIU, e-mail:[email protected]
Abstract
Currently, the need to ensure sustainable development has become a central point of debates and of the economic policies. Obviously, the influence of the level of financial resources mobilized at the state level is crucial, reason for it is necessary to promote a sustainable fiscal policy. The purpose of this paper is to analyze the influence of fiscal policy measures on budget revenues, in terms of volume and their structure in Romania. Empirical researchs realised, reflected a longitudinal study that targeted budget income trends between 2006-2015, both in terms of total volume and in terms of revenues for each category of taxation. The results of this study demonstrate the use of a pro-cyclical fiscal policy, with negative effects in terms of the impact on the budget deficit and a poor correlation with other components of macroeconomic policy.
Keywords:budget revenues, fiscal policy, direct and indirect taxes
ClassificationJEL: H 20, H21
1. Introduction
The role of taxes in formation of the budget revenues is undeniable, regardless of the degree of development of an economy. as a result, the implementation of fiscal policy measures, appropriate to the milestones traveled and of the level of economic development, is a goal of any governance. unfortunately, measures insufficiently grounded and weakly rooted in economic reality caused disturbances in the economic environment and boosting tax evasion trends, especially in the emerging countries. romania was not an exception in this sense, but rather an example of tax inefficiency in the context of use of a cyclical policies. Practically, fiscal policy can become a useful tool in the overall policy promoted by the state as long as the response at adopted measures is favorable. In addition, only a correlation with budgetary policy (also with other components of the general policy of the state) can generate the desired results. For example, during a period of unfavorable of economic point of view, one can opt to reduce tax rates and increasing of public spending (and vice versa if excessive increase in aggregate demand). Most studies relate to finding correlations between measures of fiscal policy and economic growth and less on their effect on budget revenues. As a result, the highlighting of the level and structure of tax revenues to mobilized at the general consolidated budget, under the impact of fiscal policy measures, can be a support to substantiate an appropriate strategy in the field of taxation. Further paper is structured as follows: literature review, presentation and analysis of data, conclusions and discussions.
2. Literature review
studies have highlighted a intuitive correlation between economic development and indicators relating to fiscal policy (incomes achieved) and the budgetary(expenditures made), fiscal multipliers are considered causes of GDP change (Romer, 2011). However, different measures tax applied in different countries, to mitigate the negative effects of economic and financial crisis that started in 2008, have highlighted the absence of clear evidence of this link (results of studies were contradictory, corresponding to the two points of view literature, expressed by Keynesian theory and the classical theory) or a weak correlation between fiscal shocks and macroeconomic variables (Boiciuc, 2015). In this context, it is obvious that the effects of fiscal policy applied in different periods are influenced and by the uncorrelated errors with the components of macroeconomic policy (eg. the monetary policy) and also by the gap of time between applying and the time of the manifestation of first results.
3. Presentation and analysis of data
Fiscal policy measures adopted after 1990 have influenced the dynamics and structure of tax revenue and the level of taxation. To identify the impact of measures adopted, research was carried out based on a stepwise analysis of the general consolidated budget collected revenues and their
correlation with the gross domestic product, so that it can be spotlighted trends generated. Synthesized data relating to the period 2006-2015 so as to be able to observe both the development in
a period of economic boom and also after starting economic crisis - financial 2008. The main categories of budgetary revenues have shown a trend of increase in nominal, except for 2009 (table 1).
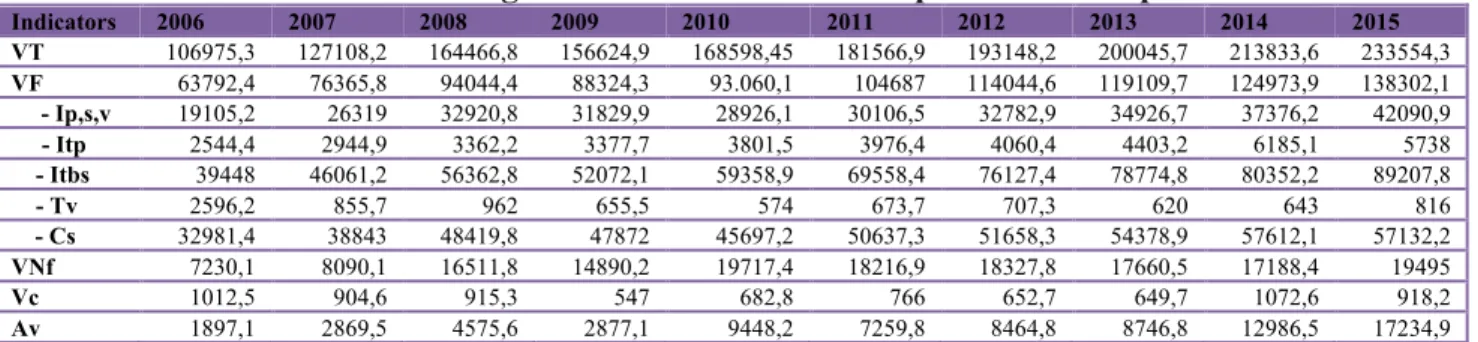
Table 1 The evolution of budget revenues and their components in the period 2006-2015
Indicators 2006 2007 2008 2009 2010 2011 2012 2013 2014 2015
VT 106975,3 127108,2 164466,8 156624,9 168598,45 181566,9 193148,2 200045,7 213833,6 233554,3
VF 63792,4 76365,8 94044,4 88324,3 93.060,1 104687 114044,6 119109,7 124973,9 138302,1
- Ip,s,v 19105,2 26319 32920,8 31829,9 28926,1 30106,5 32782,9 34926,7 37376,2 42090,9
- Itp 2544,4 2944,9 3362,2 3377,7 3801,5 3976,4 4060,4 4403,2 6185,1 5738
- Itbs 39448 46061,2 56362,8 52072,1 59358,9 69558,4 76127,4 78774,8 80352,2 89207,8
- Tv 2596,2 855,7 962 655,5 574 673,7 707,3 620 643 816
- Cs 32981,4 38843 48419,8 47872 45697,2 50637,3 51658,3 54378,9 57612,1 57132,2
VNf 7230,1 8090,1 16511,8 14890,2 19717,4 18216,9 18327,8 17660,5 17188,4 19495
Vc 1012,5 904,6 915,3 547 682,8 766 652,7 649,7 1072,6 918,2
Av 1897,1 2869,5 4575,6 2877,1 9448,2 7259,8 8464,8 8746,8 12986,5 17234,9 Source: www.mfinante.ro, MFP Bulletin 2006-2015
Legend: TR - total revenues general consolidated budget; VF - tax revenues; Ip, s, v - income tax, payroll, income and capital earnings; Itp- property taxes; ITBS - taxes and duties on goods and services TV - customs duties; Cs - insurance contributions; VNF - incomes non-tax; Vc - income from capital; Av - other income.
An important aspect of the analysis is the highlighting of the structure the general consolidated budget revenues collected. In terms of the two major categories of taxes (direct and indirect) it is found that revenues from indirect taxes generate the largest tax revenues table.
As a result, Romania fall into the category of less developed countries, where the volume of economic activity is not sufficient to ensure significant revenues from taxes placed upon it. For comparison, in Denmark 60% of revenue comes from direct taxes. Breakdown of revenues from direct taxes is reflected in Table 2.
Table 2 The structure of tax revenue collected at the general consolidated budget from direct taxes between 2006-2015 -% -
Indicators 2006 2007 2008 2009 2010 2011 2012 2013 2014 2015
Vid 21649,6 29263,9 36283 35207,6 32727,6 34082,9 36843,3 39329 43561,3 47828,9
Vid (%VF) 33,94 38,32 38,58 39,86 35,17 32,56 32,31 33,01 34,85 34,58 Ip,s,v %Vid 88,25 89,94 90,73 90,41 88,38 88,33 88,98 88,81 85,80 88,01 Ipsv % VF 29,95 34,46 35 36,03 31,08 28,76 28,75 29,32 29,9 30,43 Itp %Vid 11,75 10,06 9,27 9,59 11,62 11,67 11,02 11,1 14,19 11,99 Itp %VF 3,98 3,85 3,57 3,82 4,08 3,79 3,56 3,69 4,95 4,14
Source: own calculation on table 1 Legend: Vid – revenues from direct taxes
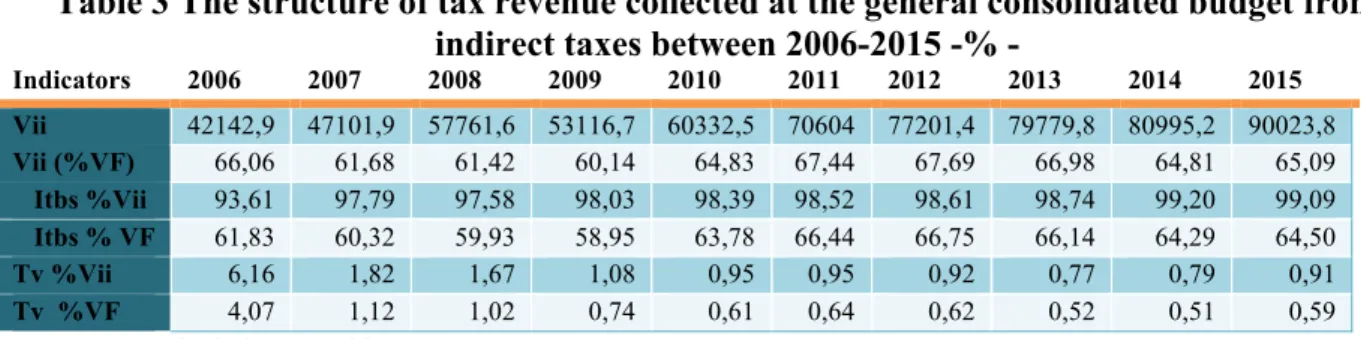
It is noted that the share of revenue generated by direct taxes in the overall tax revenue recorded a growth trend between 2006-2009, after which there was a decrease by 2013, with a level lower than that of 2006, followed again a slight increase, demonstrating the correlation between this category of taxes and economic position in the economic cycle. It should also be noted that tax profit generated lower revenues than in 2008 on the interval 2009-2014, corresponding restricting the activity volume and of the obligation to pay minimum tax. Instead, the increase in the minimum wage led to increased revenues from the payroll tax and income. Thus, if in 2007 the revenues from the profit tax have had a share of 72% of related revenues of indirect taxes and those in the income tax 19%, in 2015 ratio became 57% versus 38% (in the context of significant economic growth in interval 2013 - 2015). In comparison, can follow and indirect tax structure, in terms of share of components in total revenues from indirect taxes (Table 3).
Table 3 The structure of tax revenue collected at the general consolidated budget from indirect taxes between 2006-2015 -% -
Indicators 2006 2007 2008 2009 2010 2011 2012 2013 2014 2015
Vii 42142,9 47101,9 57761,6 53116,7 60332,5 70604 77201,4 79779,8 80995,2 90023,8
Vii (%VF) 66,06 61,68 61,42 60,14 64,83 67,44 67,69 66,98 64,81 65,09 Itbs %Vii 93,61 97,79 97,58 98,03 98,39 98,52 98,61 98,74 99,20 99,09 Itbs % VF 61,83 60,32 59,93 58,95 63,78 66,44 66,75 66,14 64,29 64,50 Tv %Vii 6,16 1,82 1,67 1,08 0,95 0,95 0,92 0,77 0,79 0,91 Tv %VF 4,07 1,12 1,02 0,74 0,61 0,64 0,62 0,52 0,51 0,59
Source: own calculation on table 1 Legend: Vii – revenues from indirect taxes
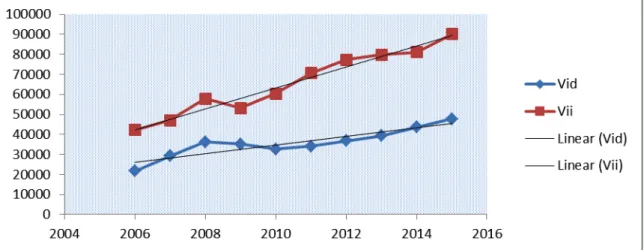
Chart 1 The evolution of revenues from direct and indirect taxes
Clear orientation towards indirect taxes is evidenced by Graph 2.
Chart 2 Structure of tax revenue in the range of 2006-2015
Regarding the share of revenues of general consolidate budget and its components to GDP, can be synthesized following data (Table 4):
Table 4 The share of budgetary revenues in GDP in the period 2006-2015 Indicators 2006 2007 2008 2009 2010 2011 2012 2013 2014 2015
VT 31,8 32,5 32 31 33 33,1 33 32 31,7 33,1
VF 19 19,5 18,3 17,5 18,2 19,1 19,5 19 18,5 19,6
- Ip,s,v 5,7 6,7 6,4 6,3 5,7 5,5 5,6 5,6 5,5 6,0
- Itp 0,8 0,8 0,7 0,7 0,7 0,7 0,7 0,7 1,8 0,8
- Itbs 11,7 11,8 11 10,3 11,6 12,7 13 12,6 11,9 12,7
- Tv 0,8 0,2 0,2 0,4 0,1 0,1 0,1 0,1 0,1 0,1
Cs 9,8 9,9 9,4 9,5 8,9 9,2 8,8 8,7 8,5 8,2
VNf 2,2 2,1 3,2 2,9 3,9 3,3 3,1 2,7 2,5 2,8
Vc 0,3 0,2 0,2 0,1 0,1 0,1 0,1 0,1 0,2 0,1
Av 0,6 0,7 0,5 0,6 1,9 1,3 1,5 1,3 1,92 2,5
www.mfinante.ro, MFP Bulletin 2006-2015
to countries with comparable levels of GDP. In this regard, between 2006-2014, the EU tax revenues (including social net contributions) have a share of between 38% and 40% of GDP.
Can be remarked levels above average in Denmark (50.8% in 2014) France and Belgium (47.9%), Sweden and Italy (43.7%). Romania is part of the echelon of countries with the lowest share, together with Bulgaria, Latvia, Lithuania. In addition, the share of indirect taxes in total tax revenues increased, in the context of the increase in VAT from 19% to 24% in 2010 (amid deepening budget deficit).
According to the identified data, the level of taxation in Romania was below the average level recorded in the EU, the difference being much greater compared to different countries. However, taxpayers considers that the tax burden is high. Supporting this is complicated by the fact that it charge a large number of taxes and frequently changing of the tax laws have caused hardship in the economic environment and at the level of investors (Dobrotă and Chirculescu, 2010).
In accordance with Doing Business report (2016), the number of payments per year is 14, time allocated is 159 hours / year, while the total tax rate (% profit) was 42%. A high level of taxation generates a series of negative effects. Thus, foreign and domestic capital for investment are diminishes, work is not stimulated, the tendency towards tax evasion is pronounced, the competitiveness of products in internationally plane is reduced, it can cause social instability etc.
4. Conclusions
Analysis of the volume and structure of tax revenues in last 10 years allow identification of distinctive characteristics, namely: share of tax revenues to GDP remains among the lowest in the EU, with a difference of about 10 percent compared to the European average; central government, in budget revenue collection, relies mainly on indirect taxes and contributions paid by employers and employees; collection process is facing difficulties; level of tax evasion remains high, especially in certain sectors; fiscal policy aimed mainly setting up financial resources in a large amount, often the measures taken in this respect generating negative effects in economic plan; Trends of tax revenues can be explained mainly by changes in economic plane but and in fiscal legislation plan. Thus, the contraction of the economic environment in times of crisis, transmits its influence through various channels, such as reducing the activity of companies and thereby shrinking the volume of tax obligations; increasing of unemployment; reducing consumption. The tax law changes can relate to the tax rates, the tax base, granting exemptions to stimulate certain activities, etc. and can affect tax revenues significantly. It should be noted however that the impact of environmental measures or economic progress is visible in the volume and structure of income with a certain lag. As a result, application of budgetary and fiscal consolidation strategy - in which of reducing the tax evasion must occupy a central place, along with improving the absorption of European funds and improve the efficiency of public spending should be a goal of any governance. In addition, to offset the effects of diminishing of revenues, generated by changes in the Tax Code, implemented since 2016, it is necessary to improve the level of voluntary compliance in meeting their obligations to declare and pay tax obligations.
5. Bibliography
[1] Boiciuc I., The effects of fiscal policy shocks in Romania. A SVAR Approach, Procedia Economics and Finance, 32, 1131 – 1139, 2015;
[2] Dobrotă G., Direct taxation in Romania and European Union, Annals of Constantin Brâncusi University of Târgu Jiu, Economy series, volume 3, pp. 21-30, 2010;
[4] Gupta, S., Keen, M., Clements, D., Fletcher, K., de Mello, L., Mani, M., „Fiscal Dimensions of Sustainable Development”, Pamphlet Series, No. 54, Fiscal Affairs Department, International Monetary Fund, 2002;
[5] Lobont, O. R., A question about significance of fiscal decisions in the design of Romanian Economic Performances. Metalurgia International, Vol. 18 (Issue 2), pp. 175–178, 2013
[6] Molănesc G., Aceleanu G., Consecințele deficitului bugetar în România în contextul crizei actuale. Implicații asupra pieței muncii, Economie teoretică și aplicată, vol. XVIII, no. 2(555), pp. 58-74, 2011;
[7] Moșteanu N.R., Implication of fiscal policy for the Romanian economy during 2000-2015, Ecoforum, volume 4, Special Issue 1, pp. 70-77, 2015;
[8] Romer, D. What have we learned about fiscal policy from the crisis. Paper presented at the International Monetary Fund Conference on Macro and Growth Policies in the Wake of the Crisis, 2011
http://www.imf.org/external/np/seminars/eng/2011/res/pdf/DR3presentation.pdf.
[9] Roșoiu I., The impact of the government revenues and expenditures on the economic growth, Procedia Economics and Finance 32, 526 – 533, 2015
[10] Văcărel I., Tendinţe în evoluţia sistemelor fiscale ale ţărilor membre ale OCDE, Uniunii Europene şi României, Revista Calitatea vieţii, XVIII, nr. 3–4, pp. 339–381, 2007
[11] Zai P., Considerente privind componentele politicilor bugetare, Revista Transilvană de Științe administrative 1(21), 2008, pp. 141 – 158;
[12] ***Doing Business Report 2016, world bank report, http://www.doingbusiness.org