ACPD
14, 28885–28917, 2014Chemical and stable carbon isotopic composition of PM2.5
S. Dai et al.
Title Page
Abstract Introduction
Conclusions References
Tables Figures
◭ ◮
◭ ◮
Back Close
Full Screen / Esc
Printer-friendly Version Interactive Discussion
Discussion
P
a
per
|
Discussion
P
a
per
|
Discussion
P
a
per
|
Discussion
P
a
per
|
Atmos. Chem. Phys. Discuss., 14, 28885–28917, 2014 www.atmos-chem-phys-discuss.net/14/28885/2014/ doi:10.5194/acpd-14-28885-2014
© Author(s) 2014. CC Attribution 3.0 License.
This discussion paper is/has been under review for the journal Atmospheric Chemistry and Physics (ACP). Please refer to the corresponding final paper in ACP if available.
Chemical and stable carbon isotopic
composition of PM
2.5
from on-road vehicle
emissions in the PRD region and
implication for vehicle emission control
policy
S. Dai1,2, X. Bi1, L. Y. Chan1, J. He1,3, B. Wang3, X. Wang1, G. Sheng1, and J. Fu1
1
State Key Laboratory of Organic Geochemistry, Guangzhou Institute of Geochemistry, Chinese Academy of Sciences, Guangzhou 510640, China
2
University of Chinese Academy of Sciences, Beijing 100049, China
3
Atmospheric Environment Institute of Safety and Pollution Control, Jinan University, Guangzhou 510632, China
Received: 21 August 2014 – Accepted: 28 October 2014 – Published: 20 November 2014
Correspondence to: X. Bi ([email protected])
ACPD
14, 28885–28917, 2014Chemical and stable carbon isotopic composition of PM2.5
S. Dai et al.
Title Page
Abstract Introduction
Conclusions References
Tables Figures
◭ ◮
◭ ◮
Back Close
Full Screen / Esc
Printer-friendly Version Interactive Discussion
Discussion
P
a
per
|
Discussion
P
a
per
|
Discussion
P
a
per
|
Discussion
P
a
per
|
Abstract
Vehicle emission is a major source of urban air pollution. In recent decade, the Chi-nese government has introduced a range of policies to reduce the vehicle emission. In order to understand the chemical characteristics of PM2.5 from on-road vehicle emission in the Pearl River Delta (PRD) region and to evaluate the effectiveness of
5
control policies on vehicles emission, the emission factors of PM2.5 mass,
elemen-tal carbon (EC), organic carbon (OC), soluble organic carbon (WSOC), water-soluble inorganic ions (WSII), metal elements, organic compounds and stable carbon isotopic composition were measured in the Zhujiang Tunnel of Guangzhou, the PRD region of China in 2013. Emission factors of PM2.5 mass, OC, EC, and WSOC were
10
92.4, 16.7, 16.4, and 1.31 mg vehicle−1km−1 respectively. Emission factors of WSII were 0.016 (F−)∼4.17 (Cl−) mg vehicle−1km−1, totally contributing about 9.8 % to the
PM2.5emissions. The sum of 27 measured metal elements accounted for 15.2 % of the PM2.5emissions. Fe was the most abundant metal element, with an emission factor of
3.91 mg vehicle−1km−1. Emission factors of organic compounds including n-alkanes,
15
PAHs, hopanes, and steranes were 91.9, 5.02, 32.0 and 7.59 µg vehicle−1
km−1
, re-spectively. Stable carbon isotopic composition δ13C value was measured and it was
−25.0 ‰ on average. An isotopic fractionation of 3.2 ‰ was found during fuel
com-bustion. Compared with a previous study in Zhujiang Tunnel in year 2004, emission factors of PM2.5 mass, EC, OC, WSII except Cl−, and organic compounds decreased
20
by 16.0–93.4 %, which could be attributed to emission control policy from 2004 to 2013. However, emission factors of most of the metal elements increased significantly, which could be partially attributed to the changes in motor oil additives and vehicle condi-tion. There are no mandatory national standards to limit metal content from vehicle emission, which should be a concern of the government. A snapshot of the 2013
char-25
acteristic emission of PM2.5and its constituents from on-road vehicular fleet in the PRD
ACPD
14, 28885–28917, 2014Chemical and stable carbon isotopic composition of PM2.5
S. Dai et al.
Title Page
Abstract Introduction
Conclusions References
Tables Figures
◭ ◮
◭ ◮
Back Close
Full Screen / Esc
Printer-friendly Version Interactive Discussion
Discussion
P
a
per
|
Discussion
P
a
per
|
Discussion
P
a
per
|
Discussion
P
a
per
|
1 Introduction
Vehicle emission is a major source of urban air pollution and it accounts for approxi-mately 14∼50 % of total fine particle mass in urban areas (Sheesley et al., 2007; Wang
et al., 2008; Yu et al., 2013). The environmental and health effects of vehicle emissions are of our concern during the last decades. Numerous studies have been conducted to
5
characterize vehicular particulate matter (PM) emission in many countries, with respect to emission factors, chemical composition, and size distribution (Chiang and Huang, 2009; Laschober et al., 2004; Pio et al., 2013). The characteristics of vehicle emission in China were studied by tunnel experiments, dynamometer tests or road monitoring (He et al., 2008; Jin et al., 2014; Song et al., 2012). Because of the differences in fuel
10
qualities, engine conditions, and operation practices, the PM emission from vehicles varied from region to region and time to time.
The Pearl River Delta (PRD) region is located in the southern coast of China, noted for its rapid urbanization and industrialization in the last few decades, has experienced serious atmospheric pollution. Vehicle emission accounts for approximately 25–30 %
15
of total fine PM in the PRD region (http://epaper.southcn.com/nfdaily/html/2014-01/ 03/content_7261687.htm). Peer reviewed papers had reported emission factors and chemical characteristic of PM2.5 from vehicle emission in the PRD region, by means
of tunnel studies in Zhujiang Tunnel (Guangzhou) and Wutong Tunnel (Shenzhen) (He et al., 2006, 2008; Huang et al., 2006). However, the sampling in these studies was
20
conducted in 2004. During the past decade, the Environment Protect Agency of Guang-dong Province revised the “Motor vehicle exhaust pollution prevention and control reg-ulations of Guangdong Province” in 2008 and released the “PRD Regional Air Quality Management Plan” and “A Clean Air Plan” in 2010, to improve the relevant air quality through policies and measures. The emission standards for newly registered vehicles
25
ACPD
14, 28885–28917, 2014Chemical and stable carbon isotopic composition of PM2.5
S. Dai et al.
Title Page
Abstract Introduction
Conclusions References
Tables Figures
◭ ◮
◭ ◮
Back Close
Full Screen / Esc
Printer-friendly Version Interactive Discussion
Discussion
P
a
per
|
Discussion
P
a
per
|
Discussion
P
a
per
|
Discussion
P
a
per
|
Tunnel experiments and chassis dynamometer tests were widely used to measure various pollutants emitted from vehicles (He et al., 2006; Heeb et al., 2003). However, dynamometer test has the defect that it can not account for vehicle fleet composition and emissions characteristics related to break and tire wear and re-suspension of road dust (Thorpe and Harrison, 2008). Tunnel studies have been demonstrated to be a
suit-5
able setup to measure PM emissions from on-road mixed fleets (Chiang and Huang, 2009; Laschober et al., 2004; Pio et al., 2013).
This study was carried out in a roadway tunnel located in the PRD region. We re-port here the emission factors of PM2.5mass, organic carbon (OC), elemental carbon (EC), water-soluble inorganic ions (WSII), metal elements, water-soluble organic
car-10
bon (WSOC), organic compounds and stable carbon isotopic composition. WSOC has the potential to modify the hygroscopicity of particles, PM size and cloud condensation nuclei activities (Shulman et al., 1996), but it is often ignored in previous studies ow-ing to the hydrophobic nature of the organic aerosol from primary vehicle emissions. Stable carbon isotope (δ13C) is very useful for tracing sources (Lopez-Veneroni, 2009;
15
Widory, 2006), and it was also less reported for vehicular exhaust emissions (Ancelet et al., 2011; Widory, 2006). The objectives of this study are: (1) to obtain compre-hensive information on the chemical and stable carbon isotopic composition of PM2.5 emission from on-road vehicles in the PRD region, (2) to compare our results with the previous study conducted in the same tunnel in 2004, (3) to evaluate the effectiveness
20
of the implementation of vehicle emission control policies from 2004 to 2013 in the PRD region.
2 Experimental
2.1 Tunnel sampling
PM2.5 samples were collected during 10 to 14 August 2013 from the roadway tunnel
25
ACPD
14, 28885–28917, 2014Chemical and stable carbon isotopic composition of PM2.5
S. Dai et al.
Title Page
Abstract Introduction
Conclusions References
Tables Figures
◭ ◮
◭ ◮
Back Close
Full Screen / Esc
Printer-friendly Version Interactive Discussion
Discussion
P
a
per
|
Discussion
P
a
per
|
Discussion
P
a
per
|
Discussion
P
a
per
|
has three lanes with traffic in the same direction, as shown in Fig. 1. Two high-volume PM2.5samplers (GUV-15HBL1, Thermo, USA) were placed at a distance of 75 m from
the entrance and 75 m from the exit, respectively. The vehicle speed in the Zhujiang Tunnel was 18 to 45 km h−1, with an average vehicle speed of 33.4 km h−1 during the sampling. The air samples were drawn at about 1.13 m3min−1through the quartz fiber
5
filters (QFFs, 20.3 cm×25.4 cm, Whatman). Field blank samples were also collected by
loading filters into the samplers but without pulling air through. The sampled filters were wrapped with annealed aluminum foil and stored in a refrigerator at−40◦C till analysis.
The meteorological parameters were synchronously recorded. A video camera was placed at the exit to record the passing vehicles during the sampling periods. The
10
videotapes were then used to determine the vehicle counts and to classify the vehicles into three categories, namely, diesel vehicles (DV) (heavy-duty trucks, light-duty trucks and large passenger cars), gasoline vehicles (GV) (small cars and motorcycles), and liquefied petroleum gas vehicles (LPGV) (bus and taxies). The average traffic density during sampling was 1797 per hour with DV, GV and LPGV proportion of 13.7, 59.8 and
15
26.5 % respectively. More details of the vehicle counts and meteorological conditions are summarized in Table S1 of the Supplement.
2.2 Chemical analysis
The PM2.5 mass concentrations were determined gravimetrically by weighing the
quartz filters before and after sampling in an electronic hygrothermost for 24 h at 25◦C
20
and 50 % relative humidity (RH). Then, samples were analyzed for OC/EC, WSOC, WSII, metal elements, organic compounds and stable carbon isotopic composition. The experimental methods of the chemical analysis are available of the Supplement.
2.3 Calculation of emission factors
Average emission factors were calculated for each sampling period on the basis of the
25
ACPD
14, 28885–28917, 2014Chemical and stable carbon isotopic composition of PM2.5
S. Dai et al.
Title Page
Abstract Introduction
Conclusions References
Tables Figures
◭ ◮
◭ ◮
Back Close
Full Screen / Esc
Printer-friendly Version Interactive Discussion
Discussion
P
a
per
|
Discussion
P
a
per
|
Discussion
P
a
per
|
Discussion
P
a
per
|
equation (Handler et al., 2008): EF=(Cout−Cin)V/NL
where EF is the emission factor of a species in unit of mg vehicle−1km−1, N is the number of vehicles passing through the tunnel, L is the distance between inlet and outlet sampling locations,CoutandCinare the measured species concentrations at the
5
tunnel outlet and inlet, respectively, andV is the corresponding air volume calculated from the cross-sectional area of the tunnel, the average wind speed, and the sampling duration of each filter. The average concentrations of all measured species at the inlet and outlet sampling locations and the corresponding emission factors in this study are presented in Table S2 of the Supplement and Tables 1–2.
10
3 Results and discussion
3.1 Characteristics of PM2.5emissions from vehicles in the PRD region
3.1.1 PM2.5mass, OC, EC, WSOC, WSII, metal elements
The PM2.5 mass emission factors ranged from 79.8 to 107 mg vehicle−1km−1, with an average of 92.4±8.9 mg vehicle−1km−1. Average OC and EC emission factors were
15
16.7±1.9 and 16.4±2.1 mg vehicle−1km−1, respectively, and they accounted for 19±2
and 18±2 % of PM2.5 mass emission. The ratio of OC to EC in the Zhujiang Tunnel
ranged from 0.77 to 1.35, with an average of 1.03. Previous studies have shown that the OC/EC ratio is useful to separate gasoline engine emissions from diesel emissions. Higher values (>2) are associated with GV and LPGV exhaust and lower values (0.3 to
20
∼0.9) associated with DV exhaust (Cadle et al., 1999; Cheng et al., 2010; Gillies and
ACPD
14, 28885–28917, 2014Chemical and stable carbon isotopic composition of PM2.5
S. Dai et al.
Title Page
Abstract Introduction
Conclusions References
Tables Figures
◭ ◮
◭ ◮
Back Close
Full Screen / Esc
Printer-friendly Version Interactive Discussion
Discussion
P
a
per
|
Discussion
P
a
per
|
Discussion
P
a
per
|
Discussion
P
a
per
|
emissions although the proportion of DV was only 13.7 % during the sampling. Addi-tionally, it should be noted that emissions of EC from heavy duty trucks are expected to be relatively low under the low speed operating conditions in the tunnel (Kweon et al., 2002). Therefore, the ratio could be lower at the actual driving condition of ve-hicle fleet with a higher speed on the road. The concentration of WSOC in the inlet
5
location was 6.21 µg m−3 (Table S2 of the Supplement) with a percentage of 31.1 % of OC, which is close to that of ambient air (Ding et al., 2008; Ho et al., 2006). While in the outlet location, the concentration of WSOC was 8.00 µg m−3 (Table S2 of the Supplement), with a percentage of 17.9 % of OC. The WSOC had been reported to contribute on average 20 % to OC in the exit of Marseille roadway tunnel (El Haddad
10
et al., 2009), in which background influence was included. The calculated emission factor of WSOC in this study ranged from 0.5 to 2.8 mg vehicle−1km−1, with an average of 1.31 mg vehicle−1km−1, which consisted of 7.84 % of OC. Such a WSOC fraction is considerably lower than that previously measured for biomass burning particle (71 %) (Mayol-Bracero et al., 2002). However, it could influence the hygroscopicity of particles
15
and the formation of secondary aerosols (Ho et al., 2006; Rogge et al., 1993b; Weber et al., 2007) and is worthy of more attention and in-depth research.
The sum of WSII comprised about 9.8 % of the PM2.5 emission, with emission
fac-tors of 4.17, 0.104, 0.609, 2.88, 0.165, 0.177 and 0.953 mg vehicle−1km−1 for Cl−, NO−3, SO24−, Na+, NH+4, Mg2+ and Ca2+, respectively. The other WSII had a
mi-20
nor contribution (<0.1 mg vehicle−1km−1). Totally 27 measured metal elements con-tributed 15.2 % to the PM2.5 emission. Fe was the most abundant element, with an
emission factor of 3.91 mg vehicle−1
km−1
, followed by Na 3.53 mg vehicle−1
km−1
, Al 3.15 mg vehicle−1km−1, Ca 1.93 mg vehicle−1km−1, Mg 0.496 mg vehicle−1km−1, and K 0.338 mg vehicle−1km−1, which accounted for 4.2, 3.8, 3.4, 2.1, 0.5, and 0.4 % of
25
ACPD
14, 28885–28917, 2014Chemical and stable carbon isotopic composition of PM2.5
S. Dai et al.
Title Page
Abstract Introduction
Conclusions References
Tables Figures
◭ ◮
◭ ◮
Back Close
Full Screen / Esc
Printer-friendly Version Interactive Discussion
Discussion
P
a
per
|
Discussion
P
a
per
|
Discussion
P
a
per
|
Discussion
P
a
per
|
than that of their corresponding water-soluble part (see Table 1). The differences can attribute to the water-insoluble matter with these metal elements, such as organic com-pound chelated metal elements.
PM2.5mass was also obtained by summing chemical species including organic mat-ter (OM), EC, inorganic ions (Cl−, NO−3, SO24−, and NH+4) and metal elements. OC was
5
multiplied by 1.4 to estimate mass of OM (He et al., 2008). Metal elements were as-sumed to exist as oxides and the concentrations of these elements were multiplied by the corresponding factors, to account for the oxygen mass (Almeida et al., 2006). The gravimetric measurements exhibited excellent agreement with the reconstructed mass values. The average PM2.5 reconstructed mass was 69.5 % of the gravimetric value.
10
The uncertain component can be attributed to some important elements which have not been analyzed in this study, such as elements Si, S and their compounds.
3.1.2 Organic compounds
The average emission factors and abbreviated names of 67 individual organic com-pounds identified in the Zhujiang Tunnel, includingn-alkanes, polycyclic aromatic
hy-15
drocarbons (PAHs), hopanes, and steranes are listed in Table 2. These organic com-pounds accounted for 0.59 % of the OM and 0.11 % of the PM2.5 mass emissions,
The distributions of organic molecular markers associated with PM2.5 are known to be source indicative despite of their small mass fractions (Schauer et al., 1996; Si-moneit, 1986).n-Alkanes are an important class of organic compounds in atmospheric
20
aerosols, and their homologue distribution may indicate different pollution sources (Rogge et al., 1993a). In this study, then-alkane traces were dominated by C11-C36 with no odd-even carbon number predominance and the maximum was at C24, con-sistent with the characteristics of vehicle emissions reported by Simoneit (1984, 1985). The emission factors of individual n-alkanes were in the range of 0.22 (C13)∼13.3
25
(C24) µg vehicle−1km−1(Table 2).
ACPD
14, 28885–28917, 2014Chemical and stable carbon isotopic composition of PM2.5
S. Dai et al.
Title Page
Abstract Introduction
Conclusions References
Tables Figures
◭ ◮
◭ ◮
Back Close
Full Screen / Esc
Printer-friendly Version Interactive Discussion
Discussion
P
a
per
|
Discussion
P
a
per
|
Discussion
P
a
per
|
Discussion
P
a
per
|
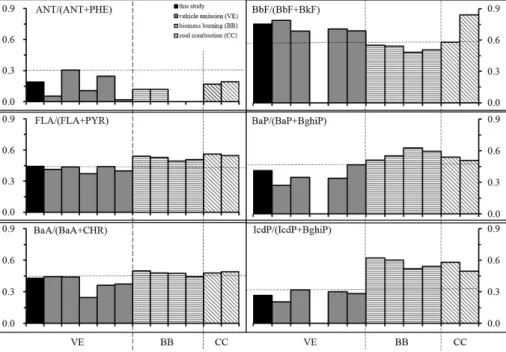
Totally 15 priority PAHs (the results of naphthalene have not been discussed in this study due to low recovery) were identified and quantified. The emission factor of to-tal PAHs varied from 4.56 to 5.54 µg vehicle−1km−1 in this study. The emission factor of benzo[a]pyrene (BaP), which is often used as an indicator of PAHs and regarded by World Health Organization as a good index for whole PAHs carcinogenicity, was in
5
the range of 0.37 to 0.46 µg vehicle−1km−1. The emission factors for other compounds ranged from 0.006 (acenaphthene) to 0.89 (pyrene) µg vehicle−1km−1(Table 2). Pyrene was the most abundant compound, followed by chrysene (CHR), benzo[ghi]perylene (BghiP) and benz[a]anthracene (BaA), which is different from biomass burning and coal combustion (Huang et al., 2014; Shen et al., 2012). PAHs diagnostic ratios have been
10
used as a tool for identifying pollution emission sources including ANT/(ANT+PHE), FLA/(FLA+PYR), BaA/(BaA+CHR), BbF/(BbF+BkF), IcdP/(IcdP+BghiP) and BaP/(BaP+BghiP) (Tobiszewski and Namiesnik, 2012; Yunker et al., 2002; Zhang et al., 2005). We summarized PAHs ratios mentioned above in Fig. 2 from three bustion sources including vehicle emission (VE), biomass burning (BB) and coal
com-15
bustion (CC). On the whole, the six ratios in this study are similar to the other tunnel experiments, though environmental conditions of tunnels are different to some extent. It is also suggested that the ratio of FLA/(FLA+PYR) and IcdP/(IcdP+BghiP) might be more suitable to distinguish VE PAHs emission with BB and CC.
Hopanes and steranes are known molecular markers of aerosol emissions from
fos-20
sil fuel utilization (Simoneit, 1985). Rogge et al. (1993a) and Schauer et al. (1996) had shown that these petroleum biomarkers can be used to trace motor vehicle ex-haust contributions to airborne PM in southern California atmosphere. Fourteen major hopanes homologues with emission factors ranging from 0.46∼9.14 µg vehicle−1km−1
and twelve steranes homologues ranging from 0.31∼0.97 µg vehicle−1km−1 were
25
cor-ACPD
14, 28885–28917, 2014Chemical and stable carbon isotopic composition of PM2.5
S. Dai et al.
Title Page
Abstract Introduction
Conclusions References
Tables Figures
◭ ◮
◭ ◮
Back Close
Full Screen / Esc
Printer-friendly Version Interactive Discussion
Discussion
P
a
per
|
Discussion
P
a
per
|
Discussion
P
a
per
|
Discussion
P
a
per
|
responding R pairs. All these characteristics of hopanes in the Zhujiang Tunnel are consistent with those in gasoline and diesel exhausts (Rogge et al., 1993a; Simoneit, 1985) and in other tunnel studies (see Fig. S1 of the Supplement). Emission factors of steranes ranged from 0.31 to 0.97 ng vehicle−1km−1, and the sum of their emis-sion factors was 7.58 µg vehicle−1km−1. The most abundant homologue was C29αββ
5
stigmastane (20R) (29αββR), followed by 29αααS and 29αββS.
3.1.3 Stable carbon isotopic composition
Stable carbon isotope analysis of vehicle emissions in Zhujiang Tunnel yielded δ13C values ranging from−25.5 to −24.7 ‰ with an average value of −25.0±0.2 ‰, and
is comparable to previously reported ranges of−29 to−24.6 ‰ (Table 3) for vehicular
10
fuel emission. Generally, the variation inδ13CFuelcould affect theδ13C of hydrocarbons (Keppler et al., 2004; Yamada et al., 2009). In the PRD region, theδ13C value of gaso-line was on average−28.6±0.6 ‰, and the δ13C value of diesel was −27.8±0.2 ‰,
and small variation of fuel δ13C was observed (Hu et al., 2014). We calculated the isotopic differences between δ13CPM2.5 and δ
13
CFuel, which represents the apparent
15
isotopic fractionation occurring during fuel burning. It expressed as ∆13C (‰), and is defined by the following equation (Yamada et al., 2009).
∆13CPM2.5-Fuel=
δ13CPM2.5+1000
δ13C
Fuel+1000 −1
×1000
In this study, the value of∆13CPM2.5-Fuelwas from 2.7 to 3.5 ‰, with an average of 3.2 ‰,
indicating an isotopic fractionation occurred during fuel combustion. Comparing the
20
ACPD
14, 28885–28917, 2014Chemical and stable carbon isotopic composition of PM2.5
S. Dai et al.
Title Page
Abstract Introduction
Conclusions References
Tables Figures
◭ ◮
◭ ◮
Back Close
Full Screen / Esc
Printer-friendly Version Interactive Discussion
Discussion
P
a
per
|
Discussion
P
a
per
|
Discussion
P
a
per
|
Discussion
P
a
per
|
heaviestδ13C value was −19∼ −13 ‰ for biomass burning of C4 plant, followed by −21∼ −16.4 ‰ for street dust and−23.9∼ −23.3 ‰ for coal combustion, while stable
isotopic carbon values of charcoal combustion (−27.4 ‰) and biomass burning of C3
plant (−34.7∼ −27 ‰) are lighter than that of vehicle emissions from the tunnel studies.
These significant differences between emission sources indicated thatδ13C value is an
5
effective marker of motor vehicle emission, and could be very useful for tracing sources.
3.2 Comparison with previous study conducted in the same tunnel
To investigate the variation of chemical emission characteristics from vehicles in the PRD region over the past decade, we compared the chemical emission characteris-tics of this study with that of previous study (He et al., 2008) for the same tunnel in
10
2004 (see Figs. 3 and 4). Figure 3 shows that PM2.5mass, OC, EC decreased
signif-icantly from 2004 to 2013. The reason can be partly attributed to the implementation of pollution control measures for Chinese vehicle emission. During this 9 year period, vehicle emission standard have raised two levels (from China II in 2004 to China IV in 2013) (Table 4). Additionally, comparing the fleet composition of 2013 with 2004 in
15
Zhujiang Tunnel, we found that the proportion of DV and GV decreased while that of LPGV increased. LPG is a type of clean energy, and LPGV is known to emit much less PM mass than GV and DV, while DV emits the most PM mass (Allen et al., 2001; Myung et al., 2014; Yang et al., 2007). LPG could be combusted more completely than gasoline and diesel. Changes mentioned above contributed greatly to the decrease of
20
emission factors of OC and EC (31.3 and 66.9 %) and PM2.5mass (16.0 %) from 2004
to 2013. However, the emissions of PM2.5mass, OC and EC are still quite higher than those measured in other countries (see Table S3 of the Supplement). The implication of these high emission factors levels is that both the fuel quality and engine technologies in the PRD region need to be further improved.
25
de-ACPD
14, 28885–28917, 2014Chemical and stable carbon isotopic composition of PM2.5
S. Dai et al.
Title Page
Abstract Introduction
Conclusions References
Tables Figures
◭ ◮
◭ ◮
Back Close
Full Screen / Esc
Printer-friendly Version Interactive Discussion
Discussion
P
a
per
|
Discussion
P
a
per
|
Discussion
P
a
per
|
Discussion
P
a
per
|
crease from 3.18 to 0.61 mg vehicle−1km−1, since the amount of sulfur in fuel is slashed by 81.5∼95 % in China IV (2013) when compared that in China II (2004) (Table 5). The
emission levels of nitrate and ammonium were about one-tenth of those observed in 2004, possibly because NOx emission standard is tightened from 2004 to 2013
(Ta-ble 4) leading to the less production of ammonium nitrate. Emission factor of chloride is
5
quite higher than that obtained from Zhujiang Tunnel in 2004 and other tunnels. Chlo-ride was found up to 74 mg vehicle−1km−1 in PM10 in the Howell Tunnel, due to the
application of salt to melt ice on roadways in the winter (Lough et al., 2005). How-ever, it is not applicable in Guangzhou City. The good correlation between Cl−and Na+
(r2=0.992) indicates the re-suspension of sea salt particles combined with vehicle
10
emission PM might be a major source (He et al., 2008).
Emission factors of most of the metal elements increased in Zhujiang Tunnel from 2004 to 2013 except Cd and Pb. Na emission increased 3.18 mg vehicle−1km−1in 2013 than in 2004. Na correlated weakly with Cl− (r2=0.374) and Na+(r2=0.429), and Na emission was 23 % higher than Na+ emission. This indicated that Na emission has
15
other sources and it was not only from the re-suspension of sea salt particles. The other four most abundant elements including Fe, Ca, Mg, K increased by 1 to 3 times. Their weak correlations (except Fe) with EC (Table S4 of the Supplement), suggest that direct tailpipe emissions were not a major source. As they are major components of crustal material, and correlated well with each other (Table S4 of the Supplement),
20
a significant source could be the resuspension of road dust caused by traffic. There-fore, their increase of emission factors can be attributed to higher wind speed of the traffic (3.8 m s−1in this study, while 3.0 m s−1in 2004) which resulted in more road dust distributed into PM. Fe correlated weakly with other crustal element, indicating other sources, such as oil additive and the wear of engines, brakes, and tires (Cadle et al.,
25
ACPD
14, 28885–28917, 2014Chemical and stable carbon isotopic composition of PM2.5
S. Dai et al.
Title Page
Abstract Introduction
Conclusions References
Tables Figures
◭ ◮
◭ ◮
Back Close
Full Screen / Esc
Printer-friendly Version Interactive Discussion
Discussion
P
a
per
|
Discussion
P
a
per
|
Discussion
P
a
per
|
Discussion
P
a
per
|
Lower emission factor of Pb (0.01±0.0007 mg vehicle−1km−1) in 2013 than in 2004,
could be a result of the phase out of leaded gasoline across China in the late 1990s. Figure 4 shows comparison of organic compounds emission in Zhujiang Tunnel be-tween 2004 and 2013. Then-alkane homologues exhibited a smooth hump-like dis-tribution with the most abundance at C24, as shown in Fig. 4a. Such a disdis-tribution
5
pattern was similar to patterns observed in Zhujiang Tunnel 2004. However, there are some differences. Firstly, the highest abundant n-alkane shifted from C23 in 2004 to C24 in 2013. It was reported that then-alkane in the highest abundance was C20 for DV and C25 or C26 for GV in dynamometer tests (Rogge et al., 1993a; Schauer et al., 1999, 2002). As the emissions collected in tunnel studies present a composite result
10
of emissions from a mixed vehicle fleet, the lower fraction of DV in 2013 was more likely the cause for the shift of the Cmax. Secondly, emission factors of C16–C26 in 2013 were quite lower than that in 2004, while this trend reverses gradually after C27. Emission factors of the PAHs decreased significantly and the percentage of decrease reached up to 67.6 %∼93.4 %. BaP equivalents (BaPeq) emission factors decreased
15
by 88.1 % from 2004 to 2013 (Table S5 of the Supplement). This could be attributed to the variation of fleet composition between 2004 and 2013. PAHs emitted from LPGV are about one-third of that from GV (Yang et al., 2007), while DV emit more PAHs than GV (Phuleria et al., 2006). Therefore, higher proportion of LPGV and lower proportion of DV resulted in the lower emission factor of PAHs in 2013 than that in 2004. Emission
20
factors of hopanes also decreased from 2004 to 2013, the percentage of decrease ranged from 56.2 to 68.7 %. However, the percentage distributions of hopane series derived from different tunnel studies including Zhujiang Tunnel 2004 and Zhujiang Tun-nel 2013 were very similar (see Fig. S2 of the Supplement). This seems to suggest that the hopane emission characteristic might be independent of the fleet composition.
25
ACPD
14, 28885–28917, 2014Chemical and stable carbon isotopic composition of PM2.5
S. Dai et al.
Title Page
Abstract Introduction
Conclusions References
Tables Figures
◭ ◮
◭ ◮
Back Close
Full Screen / Esc
Printer-friendly Version Interactive Discussion
Discussion
P
a
per
|
Discussion
P
a
per
|
Discussion
P
a
per
|
Discussion
P
a
per
|
et al., 2006). Reduction of the proportion of heavy-duty vehicle (bus, heavy-duty truck, large passenger cars) proportion in fleet composition in 2013 (11.3 %) compared that in 2004 (20 %) might be the reason that emission factors of hopanes decreased.
3.3 Implication for vehicle emission control policy
Vehicle emission control strategies and policies adopted by Guangdong Province can
5
be classified as follow: (1) Emission control on vehicles: the PM emission standards for newly registered vehicles were tightened from emission limits ranging from 0.08∼
0.20 g km−1 for light duty vehicle and 0.15 g kWh−1 for compression ignition and gas
fuelled positive ignition engines of vehicles for China II in 2004 to 0.025∼0.060 g km−1
for light duty vehicle and 0.02∼0.03 g kWh−1for compression ignition and gas fuelled
10
positive ignition engines of vehicles for China IV in 2013 (Table 4). There was a large reduction in PM emission limit from China II through China III to China IV. Commercial “yellow-label” vehicles, which emits vehicle exhaust out of limit of emission standards, were phased out step by step through more rigorous inspection and maintenance pro-grams after 2012. A considerable percentage of vehicles made in early 2000s which
15
could not comply with limit values at the time of inspection test was deregistered. The reduction of on road high PM emiting vehicles and the phasing in of lower PM emit-ing vehicles with the implementation of China III and IV were effective for decreasing PM emission. Emission factors of PM decreased by 16 % from 2004 to 2013. Also for NOx, the emission limit was reduced to half from China II to China IV for heavy
20
duty vehicle, and about half from China III to China IV for light duty vehicle. This change in emission standard which limit NOx emission was a major factor for
emis-sion factors of nitrate and ammonium decreased by about 90 %. (2) Fuel quality im-provements: National Standard has been revised several times to improve fuel qual-ity to adapt to stringent vehicle emission standards (Table 5). Vehicle fuel with 1000,
25
500 and 270 mg m−3 limit of sulfur content for gasoline, diesel and LPG was used in 2004, while for 2013 it was 50 mg kg−1 for all types of fuels. The significant result is
ACPD
14, 28885–28917, 2014Chemical and stable carbon isotopic composition of PM2.5
S. Dai et al.
Title Page
Abstract Introduction
Conclusions References
Tables Figures
◭ ◮
◭ ◮
Back Close
Full Screen / Esc
Printer-friendly Version Interactive Discussion
Discussion
P
a
per
|
Discussion
P
a
per
|
Discussion
P
a
per
|
Discussion
P
a
per
|
decreasing in fuel. Also, to comply with the China III and China IV emission stan-dard, new vehicles in the country will need to go through tougher tests. For example, the durable requirements were advanced from 80 000 km for China III to 100 000 km for China IV, similar to the European standard Euro III and Euro IV. The result was that there are more environmental friendly vehicles on road with better advanced
en-5
gines following the implementation of these emission standards. (3) Alternative fuel and vehicles: LPG is gradually taking the place of diesel and gasoline as the fuel of taxi and bus after 2004, and now seldom taxi and bus use diesel and gasoline as fuel (http://www.southcn.com/news/gdnews/nanyuedadi/200707040173.htm). The other clean fuel, liquefied natural gas (LNG), was also becoming common. The
ap-10
plication of clean fuel led to closer complete combustion, and resulted in much less emission from taxis and buses. As a result, the decrease in emission factors of OC and EC (31.3 and 66.9 %) was much higher than the decrease in PM2.5 (16.0 %). In
gen-eral, our results suggest that these strategies are effective to reduce emission factors of PM2.5mass, as well as OC, EC, WSII, and organic compounds in PM2.5. However, the
15
total vehicle population increased year by year. As shown in Fig. 5a, the total vehicle population increased by 49.1 % from 2004 to 2013. Total emission of vehicle exhaust of PM2.5mass (calculated as emission factors multiply by annual average driving
dis-tance per car and vehicle population (Wu et al., 2012)) increased by 25.2 % from 2004 to 2013 (Fig. 5b). Consequently, we have demonstrated that more stringent emission
20
standards, higher quality of fuel, cleaner fuel used for more vehicles, quicker replace-ment of high emission vehicles to environreplace-ment-friendly ones are effective and will be necessary to offset the impacts on the growth in vehicle population and to improve air quality in the PRD region. Additionally, owing to no mandatory national standards to limit metal content from vehicle emission, both emission factors and total emission
25
ACPD
14, 28885–28917, 2014Chemical and stable carbon isotopic composition of PM2.5
S. Dai et al.
Title Page
Abstract Introduction
Conclusions References
Tables Figures
◭ ◮
◭ ◮
Back Close
Full Screen / Esc
Printer-friendly Version Interactive Discussion
Discussion
P
a
per
|
Discussion
P
a
per
|
Discussion
P
a
per
|
Discussion
P
a
per
|
of metal elements should raise the awareness of the government due to their health concern.
4 Conclusions
PM2.5samples were collected between 10 and 14 August 2013 in Guangzhou Zhujiang Tunnel to acquire a comprehensive snapshot of the chemical characteristics of vehicle
5
emission. The average emission factors of PM2.5mass, EC, OC, WSOC, WSII, metal
elements, organic compounds and stable carbon isotopic composition were measured. Stable carbon isotopic compositionδ13C value indicated an isotopic fractionation oc-curred during fuel combustion. The significant difference between vehicle emission and other emission sources indicate thatδ13C value is an effective marker of motor vehicle
10
emission. Compared with a previous study in Zhujiang Tunnel in year 2004, emission factors of PM2.5 mass, EC, OC, and major WSII decreased due to control policy
in-duced changes throughout the nine years from 2004 to 2013, that is, change of fleet composition, implementation of more stringent gasoline and diesel emission standards and improvement in fuel quality, clean fuel used for taxi and buses, and enforced
re-15
placement of high emission vehicles to environmental friendly ones that can attain to the more stringent standards. The shift inn-alkanes distribution and the overall lower homologousn-alkanes and PAHs in PM2.5emission are due to the lower proportion of
DV in 2013 than in 2004, and the decrease in emission factor of hopanes were due to the reduction of proportion of heavy duty vehicles. Our analysis show that control
20
polices for vehicles emission by the government were effective to decrease the emis-sion factors of PM2.5, EC, OC, and WSII from on-road vehicular fleets. However, the
increase in emission of most metal elements should raise the awareness of the govern-ment, since metal elements, especially heavy metals could affect human health. Also, to offset the impacts in the growth of vehicle population and to improve air quality in the
25
ACPD
14, 28885–28917, 2014Chemical and stable carbon isotopic composition of PM2.5
S. Dai et al.
Title Page
Abstract Introduction
Conclusions References
Tables Figures
◭ ◮
◭ ◮
Back Close
Full Screen / Esc
Printer-friendly Version Interactive Discussion
Discussion
P
a
per
|
Discussion
P
a
per
|
Discussion
P
a
per
|
Discussion
P
a
per
|
The Supplement related to this article is available online at doi:10.5194/acpd-14-28885-2014-supplement.
Acknowledgements. This work was supported by “Strategic Priority Research Program (B)” of the Chinese Academy of Sciences (XDB05010200), and Youth Innovation Promotion Associ-ation, CAS. J. Fu thanked support from “The Team Project for Natural Science Foundation of
5
Guangdong Province, China” (S2012030006604).
References
Allen, J. O., Mayo, P. R., Hughes, L. S., Salmon, L. G., and Cass, G. R.: Emissions of size-segregated aerosols from on-road vehicles in the Caldecott Tunnel, Environ. Sci. Technol., 35, 4189–4197, 2001.
10
Almeida, S. M., Pio, C. A., Freitas, M. C., Reis, M. A., and Trancoso, M. A.: Approaching PM2.5 and PM2.5–10source apportionment by mass balance analysis, principal component analysis and particle size distribution, Sci. Total Environ., 368, 663–674, 2006.
Ancelet, T., Davy, P. K., Trompetter, W. J., Markwitz, A., and Weatherburn, D. C.: Carbonaceous aerosols in an urban tunnel, Atmos. Environ., 45, 4463–4469, 2011.
15
Boutton, T. W.: Stable carbon isotope ratios of natural materials II, atmospheric, terrestial, ma-rine, and freshwater environments, in: Carbon Isotope Techniques, Coleman D. C. and Fry B.. Academic Press, San Diego, 173–186, 1991.
Cadle, S. H., Mulawa, P. A., Ball, J., Donase, C., Weibel, A., Sagebiel, J. C., Knapp, K. T., and Snow, R.: Particulate emission rates from in use high emitting vehicles recruited in Orange
20
County, California, Environ. Sci. Technol., 31, 3405–3412, 1997.
Cadle, S. H., Mulawa, P. A., Hunsanger, E. C., Nelson, K., Ragazzi, R. A., Barrett, R., Gal-lagher, G. L., Lawson, D. R., Knapp, K. T., and Snow, R.: Composition of light-duty motor vehicle exhaust particulate matter in the Denver, Colorado area, Environ. Sci. Technol., 33, 2328–2339, 1999.
25
ACPD
14, 28885–28917, 2014Chemical and stable carbon isotopic composition of PM2.5
S. Dai et al.
Title Page
Abstract Introduction
Conclusions References
Tables Figures
◭ ◮
◭ ◮
Back Close
Full Screen / Esc
Printer-friendly Version Interactive Discussion
Discussion
P
a
per
|
Discussion
P
a
per
|
Discussion
P
a
per
|
Discussion
P
a
per
|
Chiang, H. L. and Huang, Y. S.: Particulate matter emissions from on-road vehicles in a freeway tunnel study, Atmos. Environ., 43, 4014–4022, 2009.
Ding, X., Zheng, M., Yu, L. P., Zhang, X. L., Weber, R. J., Yan, B., Russell, A. G., Edgerton, E. S., and Wang, X. M.: Spatial and seasonal trends in biogenic secondary organic aerosol tracers and water-soluble organic carbon in the southeastern United States, Environ. Sci. Technol.,
5
42, 5171–5176, 2008.
El Haddad, I., Marchand, N., Dron, J., Temime-Roussel, B., Quivet, E., Wortham, H., Jaf-frezo, J. L., Baduel, C., Voisin, D., Besombes, J. L., and Gille, G.: Comprehensive primary particulate organic characterization of vehicular exhaust emissions in France, Atmos. Envi-ron., 43, 6190–6198, 2009.
10
Garg, B. D., Cadle, S. H., Mulawa, P. A., Groblicki, P. J., Laroo, C., and Parr, G. A.: Brake wear particulate matter emissions, Environ. Sci. Technol., 34, 4463–4469, 2000.
Gidney, J. T., Twigg, M. V., and Kittelson, D. B.: Effect of organometallic fuel additives on nanoparticle emissions from a gasoline passenger car, Environ. Sci. Technol., 44, 2562–2569, 2010.
15
Gillies, J. A. and Gertler, A. W.: Comparison and evaluation of chemically speciated mobile source PM2.5particulate matter profiles, J. Air Waste Manage., 50, 1459–1480, 2000. Handler, M., Puls, C., Zbiral, J., Marr, I., Puxbaum, H., and Limbeck, A.: Size and composition
of particulate emissions from motor vehicles in the Kaisermuhlen-Tunnel, Vienna, Atmos. Environ., 42, 2173–2186, 2008.
20
He, L. Y., Hu, M., Huang, X. F., Zhang, Y. H., Yu, B. D., and Liu, D. Q.: Chemical character-ization of fine particles from on-road vehicles in the Wutong tunnel in Shenzhen, China, Chemosphere, 62, 1565–1573, 2006.
He, L. Y., Hu, M., Zhang, Y. H., Huang, X. F., and Yao, T. T.: Fine particle emissions from on-road vehicles in the Zhujiang Tunnel, China, Environ. Sci. Technol., 42, 4461–4466, 2008.
25
Heeb, N. V., Forss, A. M., Saxer, C. J., and Wilhelm, P.: Methane, benzene and alkyl benzene cold start emission data of gasoline-driven passenger cars representing the vehicle technol-ogy of the last two decades, Atmos. Environ., 37, 5185–5195, 2003.
Ho, K. F., Lee, S. C., Cao, J. J., Li, Y. S., Chow, J. C., Watson, J. G., and Fung, K.: Variability of organic and elemental carbon, water soluble organic carbon, and isotopes in Hong Kong,
30
ACPD
14, 28885–28917, 2014Chemical and stable carbon isotopic composition of PM2.5
S. Dai et al.
Title Page
Abstract Introduction
Conclusions References
Tables Figures
◭ ◮
◭ ◮
Back Close
Full Screen / Esc
Printer-friendly Version Interactive Discussion
Discussion
P
a
per
|
Discussion
P
a
per
|
Discussion
P
a
per
|
Discussion
P
a
per
|
Ho, K. F., Ho, S. S. H., Lee, S. C., Cheng, Y., Chow, J. C., Watson, J. G., Louie, P. K. K., and Tian, L.: Emissions of gas- and particle-phase polycyclic aromatic hydrocarbons (PAHs) in the Shing Mun Tunnel, Hong Kong, Atmos. Environ., 43, 6343–6351, 2009.
Hu, P., Wen, S., Liu, Y. L., Bi, X. H., Chan, L. Y., Feng, J. L., Wang, X. M., Sheng, G. Y., and Fu, J. M.: Carbon isotopic characterization of formaldehyde emitted by vehicles in
5
Guangzhou, China, Atmos. Environ., 86, 148–154, 2014.
Huang, L., Brook, J. R., Zhang, W., Li, S. M., Graham, L., Ernst, D., Chivulescu, A., and Lu, G.: Stable isotope measurements of carbon fractions (OC/EC) in airborne particulate: a new dimension for source characterization and apportionment, Atmos. Environ., 40, 2690–2705, 2006.
10
Huang, W., Huang, B., Bi, X. H., Lin, Q. H., Liu, M., Ren, Z. F., Zhang, G. H., Wang, X. M., Sheng, G. Y., and Fu, J. M.: Emission of PAHs, NPAHs and OPAHs from residential honey-comb coal briquette honey-combustion, Energ. Fuel., 28, 636–642, 2014.
Huang, X. F., Yu, J. Z., He, L. Y., and Hu, M.: Size distribution characteristics of elemental car-bon emitted from Chinese vehicles: results of a tunnel study and atmospheric implications,
15
Environ. Sci. Technol., 40, 5355–5360, 2006.
Jin, T. S., Qu, L., Liu, S. X., Gao, J. J., Wang, J., Wang, F., Zhang, P. F., Bai, Z. P., and Xu, X. H.: Chemical characteristics of particulate matter emitted from a heavy duty diesel engine and correlation among inorganic and PAH components, Fuel, 116, 655–661, 2014.
Kawashima, H. and Haneishi, Y.: Effects of combustion emissions from the Eurasian continent
20
in winter on seasonal delta C-13 of elemental carbon in aerosols in Japan, Atmos. Environ., 46, 568–579, 2012.
Keppler, F., Kalin, R. M., Harper, D. B., McRoberts, W. C., and Hamilton, J. T. G.: Carbon isotope anomaly in the major plant C1pool and its global biogeochemical implications, Bio-geosciences, 1, 123–131, doi:10.5194/bg-1-123-2004, 2004.
25
Kweon, C. B., Foster, D. E., Schauer, J. J., and Okada, S.: Detailed chemical composition and particle size assessment of diesel engine exhaust, SAE Technical Paper Series, No. 2002-01-2670, doi:10.4271/2002-2002-01-2670, 2002.
Laschober, C., Limbeck, A., Rendl, J., and Puxbaum, H.: Particulate emissions from on-road ve-hicles in the Kaisermühlen-tunnel (Vienna, Austria), Atmos. Environ., 38, 2187–2195, 2004.
30
ACPD
14, 28885–28917, 2014Chemical and stable carbon isotopic composition of PM2.5
S. Dai et al.
Title Page
Abstract Introduction
Conclusions References
Tables Figures
◭ ◮
◭ ◮
Back Close
Full Screen / Esc
Printer-friendly Version Interactive Discussion
Discussion
P
a
per
|
Discussion
P
a
per
|
Discussion
P
a
per
|
Discussion
P
a
per
|
Lough, G. C., Schauer, J. J., Park, J. S., Shafer, M. M., Deminter, J. T., and Weinstein, J. P.: Emissions of metals associated with motor vehicle roadways, Environ. Sci. Technol., 39, 826–836, 2005.
Mayol-Bracero, O. L., Guyon, P., Graham, B., Roberts, G., Andreae, M. O., Decesari, S., Fac-chini, M. C., Fuzzi, S., and Artaxo, P.: Water-soluble organic compounds in biomass burning
5
aerosols over Amazonia – 2. Apportionment of the chemical composition and importance of the polyacidic fraction, J. Geophys. Res., 107, 8091, doi:10.1029/2001JD000522, 2002. Myung, C. L., Ko, A., Lim, Y., Kim, S., Lee, J., Choi, K., and Park, S.: Mobile source air toxic
emissions from direct injection spark ignition gasoline and LPG passenger car under various in-use vehicle driving modes in Korea, Fuel Process. Technol., 119, 19–31, 2014.
10
Oda, J., Nomura, S., Yasuhara, A., and Shibamoto, T.: Mobile sources of atmospheric polycyclic aromatic hydrocarbons in a roadway tunnel, Atmos. Environ., 35, 4819–4827, 2001.
Phuleria, H. C., Geller, M. D., Fine, P. M., and Sioutas, C.: Size-resolved emissions of organic tracers from light-and heavy-duty vehicles measured in a California roadway tunnel, Environ. Sci. Technol., 40, 4109–4118, 2006.
15
Pio, C., Mirante, F., Oliveira, C., Matos, M., Caseiro, A., Oliveira, C., Querol, X., Alves, C., Martins, N., Cerqueira, M., Camoes, F., Silva, H., and Plana, F.: Size-segregated chemical composition of aerosol emissions in an urban road tunnel in Portugal, Atmos. Environ., 71, 15–25, 2013.
Rogge, W. F., Hildemann, L. M., Mazurek, M. A., Cass, G. R., and Simoneit, B. R. T.: Sources
20
of fine organic aerosol. 2. Noncatalyst and catalyst-equipped automobiles and heavy-duty diesel trucks, Environ. Sci. Technol., 27, 636–651, 1993a.
Rogge, W. F., Mazurek, M. A., Hildemann, L. M., Cass, G. R., and Simoneit, B. R. T.: Quantifica-tion of urban organic aerosols at a molecular-level – identificaQuantifica-tion, abundance and seasonal-variation, Atmos. Environ. A-Gen., 27, 1309–1330, 1993b.
25
Schauer, J. J., Kleeman, M. J., Cass, G. R., and Simoneit, B. R. T.: Measurement of emissions from air pollution sources. 2. C-1 through C-30 organic compounds from medium duty diesel trucks, Environ. Sci. Technol., 33, 1578–1587, 1999.
Schauer, J. J., Kleeman, M. J., Cass, G. R., and Simoneit, B. R. T.: Measurement of emissions from air pollution sources. 5. C-1–C-32 organic compounds from gasoline-powered motor
30
ACPD
14, 28885–28917, 2014Chemical and stable carbon isotopic composition of PM2.5
S. Dai et al.
Title Page
Abstract Introduction
Conclusions References
Tables Figures
◭ ◮
◭ ◮
Back Close
Full Screen / Esc
Printer-friendly Version Interactive Discussion
Discussion
P
a
per
|
Discussion
P
a
per
|
Discussion
P
a
per
|
Discussion
P
a
per
|
Schauer, J. J., Rogge, W. F., Hildemann, L. M., Mazurek, M. A., Cass, G. R., and Si-moneit, B. R. T.: Source apportionment of airborne particulate matter using organic com-pounds as tracers, Atmos. Environ., 30, 3837–3855, 1996.
SEPA: State Environmental Protection Administration, Air And Waste Gas Monitor Analysis Method, China Environmental Science Press, Beijing, 2003.
5
Sheesley, R. J., Schauer, J. J., Chowdhury, Z., Cass, G. R., and Simoneit, B. R. T.: Charac-terization of organic aerosols emitted from the combustion of biomass indigenous to South Asia, J. Geophys. Res., 108, 4285, doi:10.1029/2002JD002981, 2003.
Sheesley, R. J., Schauer, J. J., Zheng, M., and Wang, B.: Sensitivity of molecular marker-based CMB models to biomass burning source profiles, Atmos. Environ., 41, 9050–9063, 2007.
10
Shen, G. F., Tao, S., Wang, W., Yang, Y. F., Ding, J. N., Xue, M. A., Min, Y. J., Zhu, C., Shen, H. Z., Li, W., Wang, B., Wang, R., Wang, W. T., Wang, X. L., and Russell, A. G.: Emission of oxygenated polycyclic aromatic hydrocarbons from indoor solid fuel combustion, Environ. Sci. Technol., 45, 3459–3465, 2011.
Shen, G. F., Tao, S., Wei, S. Y., Zhang, Y. Y., Wang, R., Wang, B., Li, W., Shen, H. Z., Huang, Y.,
15
Chen, Y. C., Chen, H., Yang, Y. F., Wang, W., Wang, X. L., Liu, W. X., and Simonich, S. L. M.: Emissions of parent, nitro, and oxygenated polycyclic aromatic hydrocarbons from residential wood combustion in rural China, Environ. Sci. Technol., 46, 8123–8130, 2012.
Shulman, M. L., Jacobson, M. C., Carlson, R. J., Synovec, R. E., and Young, T. E.: Dissolution behavior and surface tension effects of organic compounds in nucleating cloud droplets,
20
Geophys. Res. Lett., 23, 277–280, 1996.
Simoneit, B. R. T.: Organic-Matter of the troposphere. 3. Characterization and sources of petroleum and pyrogenic residues in aerosols over the western United States, Atmos. Envi-ron., 18, 51–67, 1984.
Simoneit, B. R. T.: Application of molecular marker analysis to vehicular exhaust for source
25
reconciliations, Int. J. Environ. An. Ch., 22, 203–233, 1985.
Simoneit, B. R. T.: Characterization of organic-constituents in aerosols in relation to their origin and transport – a review, Int. J. Environ. An. Ch., 23, 207–237, 1986.
Song, S. J., Wu, Y., Jiang, J. K., Yang, L., Cheng, Y., and Hao, J. M.: Chemical characteristics of size-resolved PM2.5 at a roadside environment in Beijing, China, Environ. Pollut., 161,
30
215–221, 2012.
ACPD
14, 28885–28917, 2014Chemical and stable carbon isotopic composition of PM2.5
S. Dai et al.
Title Page
Abstract Introduction
Conclusions References
Tables Figures
◭ ◮
◭ ◮
Back Close
Full Screen / Esc
Printer-friendly Version Interactive Discussion
Discussion
P
a
per
|
Discussion
P
a
per
|
Discussion
P
a
per
|
Discussion
P
a
per
|
Thorpe, A. and Harrison, R. M.: Sources and properties of non-exhaust particulate matter from road traffic: a review, Sci. Total Environ., 400, 270–282, 2008.
Tobiszewski, M. and Namiesnik, J.: PAH diagnostic ratios for the identification of pollution emis-sion sources, Environ. Pollut., 162, 110–119, 2012.
Wang, H. L., Zhuang, Y. H., Wang, Y., Sun, Y., Yuan, H., Zhuang, G. S., and Hao, Z. P.:
Long-5
term monitoring and source apportionment of PM2.5/PM10in Beijing, China, J. Environ. Sci.-China, 20, 1323–1327, 2008.
Weber, R. J., Sullivan, A. P., Peltier, R. E., Russell, A., Yan, B., Zheng, M., de Gouw, J., Warneke, C., Brock, C., Holloway, J. S., Atlas, E. L., and Edgerton, E.: A study of secondary organic aerosol formation in the anthropogenic-influenced southeastern United States, J.
10
Geophys. Res., 112, D13302, doi:10.1029/2007JD008408, 2007.
Widory, D.: Combustibles, fuels and their combustion products: a view through carbon isotopes, Combust. Theor. Model., 10, 831–841, 2006.
Widory, D., Roy, S., Le Moullec, Y., Goupil, G., Cocherie, A., and Guerrot, C.: The origin of atmospheric particles in Paris: a view through carbon and lead isotopes, Atmos. Environ.,
15
38, 953–961, 2004.
Wu, Y. Y., Zhao, P., Zhang, H. W., Wang, Y., and Mao, G. Z.: Assessment for fuel consump-tion and exhaust emissions of China’s vehicles: future trends and policy implicaconsump-tions, Sci. World J., 591343, 1–8, 2012.
Yamada, K., Hattori, R., Ito, Y., Shibata, H., and Yoshida, N.: Carbon isotopic signatures of
20
methanol and acetaldehyde emitted from biomass burning source, Geophys. Res. Lett., 36, L18807, doi:10.1029/2009GL038962, 2009.
Yang, H. H., Chien, S. M., Cheng, M. T., and Peng, C. Y.: Comparative study of regulated and unregulated air pollutant emissions before and after conversion of automobiles from gasoline power to liquefied petroleum gas/gasoline dual-fuel retrofits, Environ. Sci. Technol.,
25
41, 8471–8476, 2007.
Yu, L. D., Wang, G. F., Zhang, R. J., Zhang, L. M., Song, Y., Wu, B. B., Li, X. F., An, K., and Chu, J. H.: Characterization and source apportionment of PM2.5in an urban environment in Beijing, Aerosol Air Qual. Res., 13, 574–583, 2013.
Yunker, M. B., Macdonald, R. W., Vingarzan, R., Mitchell, R. H., Goyette, D., and Sylvestre, S.:
30
ACPD
14, 28885–28917, 2014Chemical and stable carbon isotopic composition of PM2.5
S. Dai et al.
Title Page
Abstract Introduction
Conclusions References
Tables Figures
◭ ◮
◭ ◮
Back Close
Full Screen / Esc
Printer-friendly Version Interactive Discussion
Discussion
P
a
per
|
Discussion
P
a
per
|
Discussion
P
a
per
|
Discussion
P
a
per
|
Zhang, X. L., Tao, S., Liu, W. X., Yang, Y., Zuo, Q., and Liu, S. Z.: Source diagnostics of poly-cyclic aromatic hydrocarbons based on species ratios: a multimedia approach, Environ. Sci. Technol., 39, 9109–9114, 2005.
Zhang, Y. X., Schauer, J. J., Zhang, Y. H., Zeng, L. M., Wei, Y. J., Liu, Y., and Shao, M.: Charac-teristics of particulate carbon emissions from real-world Chinese coal combustion, Environ.
5
ACPD
14, 28885–28917, 2014Chemical and stable carbon isotopic composition of PM2.5
S. Dai et al.
Title Page
Abstract Introduction
Conclusions References
Tables Figures
◭ ◮
◭ ◮
Back Close
Full Screen / Esc
Printer-friendly Version Interactive Discussion
Discussion
P
a
per
|
Discussion
P
a
per
|
Discussion
P
a
per
|
Discussion
P
a
per
|
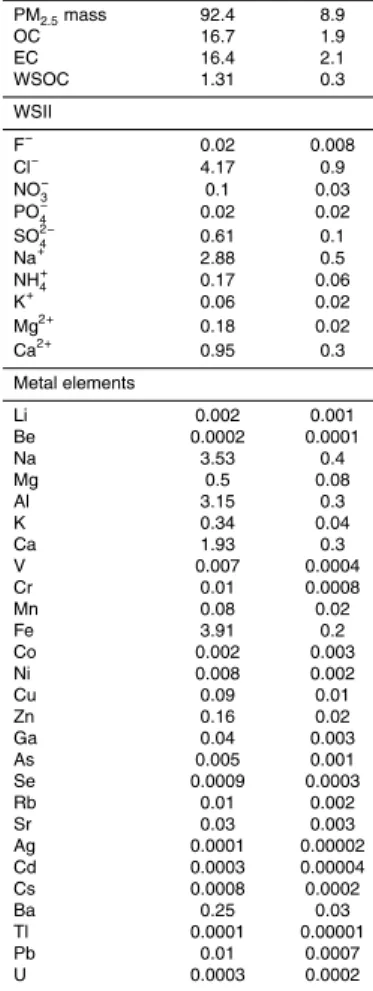
Table 1.Average emission factors (mg vehicle−1km−1) of species in PM2.5in the Zhujiang
Tun-nel.
Species Emission factor SD∗
PM2.5mass 92.4 8.9
OC 16.7 1.9
EC 16.4 2.1
WSOC 1.31 0.3
WSII
F− 0.02 0.008
Cl− 4.17 0.9
NO−
3 0.1 0.03
PO−
4 0.02 0.02
SO2−
4 0.61 0.1
Na+ 2.88 0.5
NH+
4 0.17 0.06
K+ 0.06 0.02
Mg2+ 0.18 0.02
Ca2+ 0.95 0.3
Metal elements
Li 0.002 0.001
Be 0.0002 0.0001
Na 3.53 0.4
Mg 0.5 0.08
Al 3.15 0.3
K 0.34 0.04
Ca 1.93 0.3
V 0.007 0.0004
Cr 0.01 0.0008
Mn 0.08 0.02
Fe 3.91 0.2
Co 0.002 0.003
Ni 0.008 0.002
Cu 0.09 0.01
Zn 0.16 0.02
Ga 0.04 0.003
As 0.005 0.001
Se 0.0009 0.0003
Rb 0.01 0.002
Sr 0.03 0.003
Ag 0.0001 0.00002
Cd 0.0003 0.00004
Cs 0.0008 0.0002
Ba 0.25 0.03
Tl 0.0001 0.00001
Pb 0.01 0.0007
U 0.0003 0.0002
ACPD
14, 28885–28917, 2014Chemical and stable carbon isotopic composition of PM2.5
S. Dai et al.
Title Page
Abstract Introduction
Conclusions References
Tables Figures
◭ ◮
◭ ◮
Back Close
Full Screen / Esc
Printer-friendly Version Interactive Discussion
Discussion
P
a
per
|
Discussion
P
a
per
|
Discussion
P
a
per
|
Discussion
P
a
per
|
Table 2.Average emission factors (EF, µg vehicle−1
km−1
) of organic compounds in PM2.5in the Zhujiang Tunnel.
Species Abbr.a EF SDb Species Abbr. EF SD
n-alkanes chrysene CHR 0.761 0.08
n-Hendecane C11 0.27 0.12 benzo[b]fluoranthene BbF 0.351 0.05
n-Dodecane C12 0.33 0.15 benzo[k]fluoranthene BkF 0.133 0.02
n-Tridecane C13 0.22 0.04 benzo[a]pyrene BaP 0.416 0.05
n-Tetradecane C14 0.50 0.15 indeno[cd]pyrene INcdP 0.209 0.04
n-Pentadecane C15 0.66 0.17 dibenzo[ah]anthrathene DBahA 0.023 0.003
n-Hexadance C16 1.10 0.33 benzo[ghi]perylene BghiP 0.622 0.09
n-Heptandecane C17 1.12 0.23 Hopanes
n-Octadecane C18 1.35 0.20 22,29,30-trisnorhopane Ts 1.25 0.09
n-Nonadecane C19 1.85 0.18 17αH-22,29,30-trisnorhopane Tm 1.49 0.11
n-Eicosane C20 2.84 0.24 Norhopane HP29 5.75 0.42
n-Heneicosane C21 4.46 0.40 Hopane HP30 9.14 0.68
n-Docosane C22 7.22 0.65 22S-Homohopane HP31S 3.13 0.22
n-Tricosane C23 10.6 0.91 22R-Homohopane HP31R 2.17 0.16
n-Tetracosane C24 13.3 1.11 22S-Bishomohopane HP32S 2.06 0.14
n-Pentacosane C25 10.9 0.87 22R-Bishomohopane HP32R 1.61 0.10
n-Hexacosane C26 7.98 0.54 22S-Trishomohopane HP33S 1.54 0.09
n-Heptacosane C27 7.94 0.62 22R-Trishomohopane HP33R 1.02 0.06
n-Octacosane C28 5.76 0.51 22S-Tetrahomohopane HP34S 1.02 0.07
n-Nonacosane C29 3.62 0.59 22R-Tetrahomohopane HP34R 0.65 0.04
n-Triacontane C30 3.36 0.45 22S-Pentahomohopane HP35S 0.73 0.04
n-Hentriacontane C31 1.35 0.88 22R-Pentahomohopane HP35R 0.46 0.03
n-Dotriacontane C32 2.10 0.36 Steranes
n-Tritriacontane C33 0.50 0.38 C27ααα-cholestane(20S) 27αααS 0.46 0.04
n-Tetratriacontane C34 1.63 0.24 C27αββ-cholestane(20R) 27αββR 0.69 0.05
n-pentatriacontane C35 0.68 0.14 C27αββ-cholestane(20S) 27αββS 0.55 0.04
n-Hexatriacontane C36 0.27 0.08 C27ααα-cholestane(20R) 27αααR 0.56 0.05
PAHs C28ααα-ergostane (20S) 28αααS 0.31 0.03
acenaphthylene ACY 0.028 0.01 C28αββ-ergostane (20R) 28αββR 0.60 0.05 acenaphthene ACE 0.006 0.001 C28αββ-ergostane (20S) 28αββS 0.49 0.05 fluorene FLO 0.047 0.004 C28ααα-ergostane (20R) 28αααR 0.55 0.05 phenanthrene PHE 0.374 0.04 C29ααα-stigmastane(20S) 29αααS 0.85 0.07 anthracene ANT 0.068 0.01 C29αββ-stigmastane(20R) 29αββR 0.97 0.07 fluoranthene FLA 0.523 0.06 C29αββ-stigmastane(20S) 29αββS 0.84 0.06 pyrene PYR 0.890 0.10 C29ααα-stigmastane(20R) 29αααR 0.72 0.06 benz[a]anthracene BaA 0.568 0.06
a
ACPD
14, 28885–28917, 2014Chemical and stable carbon isotopic composition of PM2.5
S. Dai et al.
Title Page
Abstract Introduction
Conclusions References
Tables Figures
◭ ◮
◭ ◮
Back Close
Full Screen / Esc
Printer-friendly Version Interactive Discussion
Discussion
P
a
per
|
Discussion
P
a
per
|
Discussion
P
a
per
|
Discussion
P
a
per
|
Table 3.δ13C values (‰) of PM from vehicle emission in this study and other emission sources.
Emission sources and Sampling site Particle types δ13C values Sampling time Reference
Vehicular fuel emission
Vehicle emissions (Zhujiang Tunnel, China) PM2.5/TC −25.0±0.3 Aug 2013 This study
Vehicle emissions (Tunnel of Rio de Janeiro, Brazil) PM/OC −25.4 Apr 1985 Tanner and Miguel (1989) Vehicle emissions (Tunnel of Rio de Janeiro, Brazil) PM/EC −24.8 Apr 1985 Tanner and Miguel (1989) Complete combustion of diesel PM/TC −29 N/A Widory (2006) Complete combustion of gasoline PM/TC −27 N/A Widory (2006) Vehicle emissions (Cassier Tunnel, Canada) PM2.5/OC −27.1 N/A L. Huang et al. (2006) Vehicle emissions (Cassier Tunnel, Canada) PM2.5/EC −26.9 N/A L. Huang et al. (2006) Diesel vehicle emissions (Central Camionera del Norte, Mexico) PM2.5/TC −24.6±0.3 Mar 2002 Lopez-Veneroni (2009) Gasoline vehicle emissions (Tunnel of Avenida Chapultepec, Mexico) PM2.5/TC −25.5±0.1 Mar 2002 Lopez-Veneroni (2009) Vehicle emissions (Mount Victoria Tunnel, New Zealand) PM2.5/TC −25.9±0.8 Dec 2008 to Mar 2009 Ancelet et al. (2011)
Non-vehicular fuel sources
Coal combustion (Paris, Franch) PM2.5/TC −23.9±0.5 May to Sep 2002 Widory et al. (2004)
Coal combustion (Yurihonjo City, Japan) PM2.5/EC −23.3 N/A Kawashima and Haneishi (2012) Charcoal combustion (Yurihonjo City, Japan) PM2.5/EC −27.4±1.7 N/A Kawashima and Haneishi (2012) Fireplace soot (Yurihonjo City, Japan) PM/EC −26.5±0.1 N/A Kawashima and Haneishi (2012) Fuel oil combustion (Paris, Franch) PM2.5/TC −26.0±0.5 May to Sep 2002 Widory et al. (2004) Dust particles
Street dust (Mexico City, Mexico) PM2.5/TC −21±0.2 Mar 2002 Lopez-Veneroni (2009)
Street dust (Yurihonjo City, Japan) PM2.5/EC −18.4∼ −16.4 Nov 2009 Kawashima and Haneishi (2012)
Biomass burning
C4 Plant PM/TC −13±4 N/A Boutton (1991)
C4 Plant (Yurihonjo City, Japan) PM2.5/EC −19.3∼ −16.1 Apr to Nov 2009 Kawashima and Haneishi (2012)
C3 Plant PM/TC −27±6 N/A Boutton (1991)
ACPD
14, 28885–28917, 2014Chemical and stable carbon isotopic composition of PM2.5
S. Dai et al.
Title Page
Abstract Introduction
Conclusions References
Tables Figures
◭ ◮
◭ ◮
Back Close
Full Screen / Esc
Printer-friendly Version Interactive Discussion
Discussion
P
a
per
|
Discussion
P
a
per
|
Discussion
P
a
per
|
Discussion
P
a
per
|
Table 4.Vehicle emission standard and limit for PM and NOximplemented in Guangzhou after
2000.
Emission standard Yeara Limit for PM Limit for NOx
g km−1b
g kWh−1c
g km−1b
g kWh−1c
China I 2001 0.14∼0.40 0.40∼0.68 – 8.0∼9.0
China II 2004 0.08∼0.20 0.15 – 7.0
China III 2007 0.05∼0.10 0.10∼0.21 0.15∼0.78 5.0 China IV 2010 0.025∼0.060 0.02∼0.03 0.08∼0.39 3.5
aYear of implementation;bfor light duty vehicle;cfor compression ignition and gas fuelled positive ignition
ACPD
14, 28885–28917, 2014Chemical and stable carbon isotopic composition of PM2.5
S. Dai et al.
Title Page
Abstract Introduction
Conclusions References
Tables Figures
◭ ◮
◭ ◮
Back Close
Full Screen / Esc
Printer-friendly Version Interactive Discussion
Discussion
P
a
per
|
Discussion
P
a
per
|
Discussion
P
a
per
|
Discussion
P
a
per
|
Table 5.Vehicle fuel standard and limit for sulfur content (mg kg−1
) implemented in Guangzhou after 2000.
Standard China I China II China III China IV
Limit Yeara Limit Year Limit Year Limit Year
Gasoline 1000 2001 500 2005 150 2006 50 2010
Diesel 2000 2002 500 2003 350 2010 50 2013
LPG – – 270b 2003 – 50 2013
ACPD
14, 28885–28917, 2014Chemical and stable carbon isotopic composition of PM2.5
S. Dai et al.
Title Page
Abstract Introduction
Conclusions References
Tables Figures
◭ ◮
◭ ◮
Back Close
Full Screen / Esc
Printer-friendly Version Interactive Discussion
Discussion
P
a
per
|
Discussion
P
a
per
|
Discussion
P
a
per
|
Discussion
P
a
per
|
Figure 2. ANT/(ANT+PHE), FLA/(FLA+PYR), BaA/(BaA+CHR), BbF/(BbF+BkF),