ACPD
11, 23573–23618, 2011Fossil vs. contemporary sources of fine EC
and OC
M. C. Minguill ´on et al.
Title Page
Abstract Introduction
Conclusions References
Tables Figures
◭ ◮
◭ ◮
Back Close
Full Screen / Esc
Printer-friendly Version Interactive Discussion
Discussion
P
a
per
|
Dis
cussion
P
a
per
|
Discussion
P
a
per
|
Discussio
n
P
a
per
Atmos. Chem. Phys. Discuss., 11, 23573–23618, 2011 www.atmos-chem-phys-discuss.net/11/23573/2011/ doi:10.5194/acpd-11-23573-2011
© Author(s) 2011. CC Attribution 3.0 License.
Atmospheric Chemistry and Physics Discussions
This discussion paper is/has been under review for the journal Atmospheric Chemistry and Physics (ACP). Please refer to the corresponding final paper in ACP if available.
Fossil versus contemporary sources of
fine elemental and organic carbonaceous
particulate matter during the DAURE
campaign in Northeast Spain
M. C. Minguill ´on1,2, N. Perron1,*, X. Querol2, S. Szidat3,4, S. M. Fahrni1,3,4,
A. Alastuey2, J. L. Jimenez5,6, C. Mohr1, A. M. Ortega5,7, D. A. Day5,6, V. A. Lanz1,
L. Wacker8, C. Reche2, M. Cusack2, F. Amato2, G. Kiss9, A. Hoffer9,
S. Decesari10, F. Moretti10, R. Hillamo11, K. Teinil ¨a11, R. Seco12, J. Pe ˜nuelas12,
A. Metzger13, S. Schallhart13, M. M ¨uller13, A. Hansel13, J. F. Burkhart14,
U. Baltensperger1, and A. S. H. Pr ´ev ˆot1
1
Paul Scherrer Institut, Laboratory of Atmospheric Chemistry, 5232 Villigen PSI, Switzerland 2
Institute of Environmental Assessment and Water Research (IDAEA), CSIC, 08034 Barcelona, Spain
3
Dept. of Chemistry and Biochemistry, University of Bern, 3012 Berne, Switzerland 4
Oeschger Centre for Climate Change Research, University of Bern, 3012 Berne, Switzerland 5
ACPD
11, 23573–23618, 2011Fossil vs. contemporary sources of fine EC
and OC
M. C. Minguill ´on et al.
Title Page
Abstract Introduction
Conclusions References
Tables Figures
◭ ◮
◭ ◮
Back Close
Full Screen / Esc
Printer-friendly Version Interactive Discussion
Discussion
P
a
per
|
Dis
cussion
P
a
per
|
Discussion
P
a
per
|
Discussio
n
P
a
per
|
6
Cooperative Institute for Research in the Environmental Sciences (CIRES), University of Colorado, Boulder, CO, USA
7
Dept. of Atmospheric and Oceanic Science, University of Colorado, Boulder, CO, USA 8
Laboratory of Ion Beam Physics, ETH H ¨onggerberg, 8093 Zurich, Switzerland 9
Air Chemistry Group of the Hungarian Academy of Sciences, 8201 Veszpr ´em, Hungary 10
Institute for Atmospheric Sciences and Climate (ISAC), CNR, Bologna, Italy 11
Finnish Meteorological Institute, Air Quality Research, 00101 Helsinki, Finland 12
Unitat d’Ecologia Global CREAF-CEAB-CSIC, Centre de Recerca Ecol `ogica i Aplicacions Forestals (CREAF), Universitat Aut `onoma de Barcelona, 08193 Bellaterra, Barcelona, Spain 13
Institute of Ion Physics and Applied Physics, Innsbruck University, 6020 Innsbruck, Austria 14
Norwegian Institute for Air Research (NILU), 2027 Kjeller, Norway
∗now at: Dept. of Nuclear Physics, University of Lund, 221 00 Lund, Sweden
Received: 26 July 2011 – Accepted: 5 August 2011 – Published: 19 August 2011 Correspondence to: M. C. Minguill ´on (mariacruz.minguillon@idaea.csic.es)
ACPD
11, 23573–23618, 2011Fossil vs. contemporary sources of fine EC
and OC
M. C. Minguill ´on et al.
Title Page
Abstract Introduction
Conclusions References
Tables Figures
◭ ◮
◭ ◮
Back Close
Full Screen / Esc
Printer-friendly Version Interactive Discussion
Discussion
P
a
per
|
Dis
cussion
P
a
per
|
Discussion
P
a
per
|
Discussio
n
P
a
per
Abstract
We present results from the international field campaign DAURE (Determination of the sources of atmospheric Aerosols in Urban and Rural Environments in the western Mediterranean), with the objective of apportioning the sources of fine carbonaceous aerosols. Submicron fine particulate matter (PM1) samples were collected during
5
February-March 2009 and July 2009 at an urban background site in Barcelona (BCN) and at a forested regional background site in Montseny (MSY). We present radiocarbon (14C) analysis for elemental and organic carbon (EC and OC) and source apportion-ment for these data. We combine the results with those from component analysis of aerosol mass spectrometer (AMS) measurements, and compare to
levoglucosan-10
based estimates of biomass burning OC, source apportionment of filter data with inor-ganic+EC+OC speciation, submicron bulk potassium (K) concentrations, and gaseous acetonitrile concentrations.
At BCN, 87 % and 91 % of the EC on average, in winter and summer, respectively, had a fossil origin, whereas at MSY these fractions were 66 % and 79 %. The
contri-15
bution of fossil sources to organic carbon (OC) at BCN was 40 % and 48 %, in winter and summer, respectively, and 31 % and 25 % at MSY. The combination of results ob-tained using the 14C technique, AMS data, and the correlations between fossil OC and fossil EC imply that the fossil OC at Barcelona is∼65 % primary whereas at MSY
the fossil OC is mainly secondary (∼85 %). Day-to-day variation in total carbonaceous 20
aerosol loading and the relative contributions of different sources predominantly de-pended on the meteorological transport conditions. The estimated biogenic secondary OC at MSY only increased by∼40 % compared to the order-of-magnitude increase
ob-served for biogenic volatile organic compounds (VOCs) between winter and summer, which highlights the uncertainties in the estimation of that component. Biomass
burn-25
ACPD
11, 23573–23618, 2011Fossil vs. contemporary sources of fine EC
and OC
M. C. Minguill ´on et al.
Title Page
Abstract Introduction
Conclusions References
Tables Figures
◭ ◮
◭ ◮
Back Close
Full Screen / Esc
Printer-friendly Version Interactive Discussion
Discussion
P
a
per
|
Dis
cussion
P
a
per
|
Discussion
P
a
per
|
Discussio
n
P
a
per
|
organic matter (not included in the primary biomass burning source estimates), and/or by an overestimation of the biomass burning OC contribution by the14C technique if the estimated biomass burning EC/OC ratio used for the calculations is too high for this region. Acetonitrile concentrations correlate well with the biomass burning EC determined by14C. K is a noisy tracer for biomass burning.
5
1 Introduction
Ambient aerosols have adverse effects on human health (e.g. Nel, 2005; Pope and Dockery, 2006; Krzyzanowski and Cohen, 2008). They also affect climate through their direct (absorption and scattering) and indirect (cloud interactions) effects on the Earth’s radiative balance (Forster et al., 2007), ecosystems and crops through their
10
deposition of acids, toxics, and nutrients (e.g. Matson et al. 2002; Grantz et al., 2003), and regional visibility (e.g. Watson, 2002).
Submicron particulate matter (PM1, particles with an aerodynamic diameter<1 µm) contains substantial fractions of carbonaceous aerosols (Murphy et al., 2006; Jimenez et al., 2009). Carbonaceous aerosols comprise a wide variety of organic compounds,
15
collectively referred to as organic matter (OM), elemental carbon (EC), also called black carbon (BC) as a consequence of its strong optical absorption, and carbonate mineral dust, the latter typically being negligible in submicron aerosol since it is mainly present in the coarse fraction (Sillanp ¨a ¨a et al., 2005).
Carbonaceous aerosols are responsible for some of the adverse effects on human
20
health produced by particles (Li et al., 2003; Mauderly and Chow, 2008). Some organic compounds are respiratory irritants (such as carbonyls and acids), carcinogens (such as polycyclic aromatic hydrocarbons (PAHs)), and toxins (Mauderly and Chow, 2008). EC induces respiratory and cardiovascular problems (Highwood and Kinnersley, 2006; and references therein) and may adsorb toxic or carcinogenic organic species which
25
ACPD
11, 23573–23618, 2011Fossil vs. contemporary sources of fine EC
and OC
M. C. Minguill ´on et al.
Title Page
Abstract Introduction
Conclusions References
Tables Figures
◭ ◮
◭ ◮
Back Close
Full Screen / Esc
Printer-friendly Version Interactive Discussion
Discussion
P
a
per
|
Dis
cussion
P
a
per
|
Discussion
P
a
per
|
Discussio
n
P
a
per
An accurate knowledge of the sources of EC and OM is necessary to design strate-gies aimed at mitigating the effects of aerosols. The most important sources of car-bonaceous aerosols are biomass, biofuel, and waste burning, residential heating, cook-ing, fossil-fuel combustion (including road traffic emissions), and biogenic emissions. Biogenic emissions contribute to primary organic aerosol (POA) and secondary organic
5
aerosol (SOA), which is formed from biogenic gases such as isoprene and monoter-penes. Biogenic POA is dominantly in the supermicron mode while biogenic SOA is concentrated in the submicron mode (P ¨oschl et al., 2010).
Radiocarbon (14C) analysis is a powerful tool used to help apportion the sources of carbonaceous aerosols (Currie, 2000; Szidat, 2009), due to its ability to differentiate
be-10
tween aerosol carbon arising from contemporary and fossil sources. In contemporary carbonaceous sources14C is found at levels similar to those in CO2in the present-day atmosphere, or higher for sources of “stored carbon” such as wood burning. In con-trast, in fossil sources, whose age greatly exceeds the half-life of 14C (5730 yr), 14C has completely decayed. The radiocarbon content of a carbonaceous sample is
ex-15
pressed as the “fraction of modern carbon” (fM), and is referenced to the ratio14C/12C in atmospheric CO2in the year 1950 (Stuiver and Polach, 1977):
fM= (
14
C/12C)sample (14C/12C)
AD1950
(1)
Values of fM range from zero for fossil sources to more than one for contemporary sources. The fM for contemporary sources exceeds unity due to the atmospheric
nu-20
clear weapon tests in the 1950s and 1960s that significantly increased the radiocarbon content of the atmosphere (Levin et al., 2010). Here we will use the term “modern carbon” only to refer to measurements relative to the 1950 standard, and the terms “contemporary” or “non-fossil,” and “fossil” carbon to refer to quantities after correction of the excess bomb radiocarbon. Since EC and OC may have different sources, source
25
ACPD
11, 23573–23618, 2011Fossil vs. contemporary sources of fine EC
and OC
M. C. Minguill ´on et al.
Title Page
Abstract Introduction
Conclusions References
Tables Figures
◭ ◮
◭ ◮
Back Close
Full Screen / Esc
Printer-friendly Version Interactive Discussion
Discussion
P
a
per
|
Dis
cussion
P
a
per
|
Discussion
P
a
per
|
Discussio
n
P
a
per
|
Several previous studies have reported contemporary and fossil fractions of car-bonaceous aerosols in urban and rural European areas in PM1, PM2.5, PM10and Total Suspended Particles (TSP, Table 1). In urban areas, EC was found to be 84–97 % fossil in summer or spring and 30–91 % fossil in winter or autumn, whereas the OC fraction was 28–47 % fossil in summer or spring and 32–45 % fossil in winter or autumn. In rural
5
areas, the ranges are very wide, EC was 27–97 % fossil and OC was 9–58 % fossil in any season. In general, the fossil contribution in rural areas was usually lower than the equivalent urban area for both EC and OC. For nearly all sites, the fossil contribution was larger in EC than in OC, and it was more important in summer than in winter for EC, whereas for OC the difference summer-winter was variable, probably due to the
10
different influences of biogenic emissions depending on the site. Other studies in Asian areas such as the Maldives, West India and Japan reported lower fossil contributions to BC (31–58 %, Table 1) and lower or similar fossil contributions to OC (6–38 %, Ta-ble 1). This is probably a consequence of the more common use of biomass burning for cooking in Asia with respect to Europe. Finally, in Mexico City the fossil contribution
15
to OC was higher than that found in European or Asian areas (49–62 %), even during high-fire periods (Table 1).
The present study is part of the international field campaign DAURE (Determina-tion of the sources of atmospheric Aerosols in Urban and Rural Environments in the western Mediterranean) (Pandolfi et al., 2011; Jorba et al., 2011; http://tinyurl.com/
20
daure09). The objective of DAURE is to study the causes of regional scale aerosol pol-lution episodes during winter and summer in the Western Mediterranean Basin (WMB). The WMB presents unique atmospheric dynamics regulated by complex climatic and orographic effects which control the concentration, composition and transport of PM (Mill ´an et al., 1997). In summertime, local circulation dominates the atmospheric
dy-25
ACPD
11, 23573–23618, 2011Fossil vs. contemporary sources of fine EC
and OC
M. C. Minguill ´on et al.
Title Page
Abstract Introduction
Conclusions References
Tables Figures
◭ ◮
◭ ◮
Back Close
Full Screen / Esc
Printer-friendly Version Interactive Discussion
Discussion
P
a
per
|
Dis
cussion
P
a
per
|
Discussion
P
a
per
|
Discussio
n
P
a
per
and valleys is accumulated due to thermal inversions persisting for a few days. After several days under anticyclonic conditions local upslope breezes can be driven by so-lar radiation pushing polluted air masses from the valley towards rural areas, thereby markedly increasing the PM levels in the rural areas (P ´erez et al., 2008a; Pey et al., 2009, 2010). Together with these transport scenarios, the large emissions from the
5
densely populated and industrialized areas, sporadic forest fires, and large shipping emissions give rise to a complex phenomenology for aerosol formation and transfor-mation.
In this context, the present work focuses on characterizing the sources of fine car-bonaceous aerosols, by using the14C method and comparing it to results from other
10
apportionment methods such as receptor modeling of filter PM measurements (inor-ganic composition, EC and OC concentrations) and Aerosol Mass Spectrometer (AMS) data, and biomass burning source estimates from levoglucosan measurements. This is the first time that these techniques have been applied simultaneously in the Mediter-ranean region.
15
2 Methodology
2.1 Sampling
Two sampling sites were selected: Barcelona (BCN), an urban background site (41◦23′24′′N 02◦06′58′′E, 80 m a.s.l.), and Montseny (MSY), a forested regional
back-ground site (41◦46′46′′N 02◦21′29′′E, 720 m a.s.l.), which is part of the European
Su-20
persite for Atmospheric Aerosol Research (EUSAAR) network (http://www.eusaar.net). Sampling was carried out during two different seasons: February–March 2009, called the DAURE winter campaign (DAURE-W), and July 2009, called the DAURE summer campaign (DAURE-S).
Submicron fine particulate matter (PM1) samples were collected on quartz fiber filters
25
ACPD
11, 23573–23618, 2011Fossil vs. contemporary sources of fine EC
and OC
M. C. Minguill ´on et al.
Title Page
Abstract Introduction
Conclusions References
Tables Figures
◭ ◮
◭ ◮
Back Close
Full Screen / Esc
Printer-friendly Version Interactive Discussion
Discussion
P
a
per
|
Dis
cussion
P
a
per
|
Discussion
P
a
per
|
Discussio
n
P
a
per
|
in DAURE-W and DHA-80 in DAURE-S) high volume (30 m3h−1) samplers with a PM 1
impactor inlet. Sampling periods were 48 h in winter and 24 h in summer. Samples were kept at−20◦C after sampling and prior to analysis. From all samples collected,
7 samples from each site were selected from DAURE-W and 6 from DAURE-S. These 28 samples were used for 14C analysis. Selection of the samples was based upon
5
simultaneous availability of samples at both sites, preliminary results (at the time of sample selection) from AMS measurements (only winter), and the EC and OC con-centrations, to investigate different atmospheric scenarios. All the concentrations are reported under ambient temperature and pressure conditions.
NOx concentrations were measured at both sites by conventional gas phase air
pol-10
lution monitors (Thermo Scientific, Model 42i) by the Department of the Environment of the Generalitat de Catalunya.
2.2 Analyses of EC and OC and intercomparison
EC and OC concentrations were determined using the 28 samples collected for14C analysis by a thermo-optical method with a Sunset OC/EC Field Analyzer (RT 3080,
15
Sunset Laboratory Inc., USA), which was used off-line (Bae et al., 2004). The EUSAAR2 protocol (Cavalli et al., 2010) was used. These results will be referred to as Sunset1. These concentrations of EC and OC were compared to other measure-ments:
– EC and OC concentrations measured by a different Sunset OC/EC analyzer
(lab-20
oratory model) using the EUSAAR2 protocol. In DAURE-S, the analysis was car-ried out on the same filters used for Sunset1. In DAURE-W, it was carcar-ried out on PM1 12 h samples collected on quartz fiber filters (Munktell) using high vol-ume (30 m3h−1) samplers (DIGITEL DHA-80). These results will be referred to
as Sunset2.
ACPD
11, 23573–23618, 2011Fossil vs. contemporary sources of fine EC
and OC
M. C. Minguill ´on et al.
Title Page
Abstract Introduction
Conclusions References
Tables Figures
◭ ◮
◭ ◮
Back Close
Full Screen / Esc
Printer-friendly Version Interactive Discussion
Discussion
P
a
per
|
Dis
cussion
P
a
per
|
Discussion
P
a
per
|
Discussio
n
P
a
per
– EC and OC concentrations measured by gauge pressure in a calibrated volume during the EC and OC separation and collection for subsequent14C analysis (Szi-dat et al., 2004b, see description in Sect. 2.3).
– OC concentrations calculated from OM concentrations measured by AMS (method details in Aiken et al., 2008) in DAURE-W. For BCN, the calculations were
5
done using OM/OC ratios depending on the type of OM analyzed as determined by PMF (1.3 for hydrocarbon-like organic aerosol (HOA) and cooking organic aerosol (COA), 2 for oxygenated organic aerosol (OOA), and 1.6 for biomass burning organic aerosol (BBOA); Aiken et al., 2008; Sun et al., 2011). For MSY, the calculations were done using OM/OC ratios determined by high-resolution
10
analysis of the AMS mass spectra.
– EC concentrations measured by the Sunset instrument during the CO2collection for14C measurements corresponding to the third stage of the thermal program, as explained in Sect. 2.3
– Black carbon concentrations measured by a Multi Angle Absorption Photometer
15
(MAAP) with a PM10inlet.
The results are generally consistent within the uncertainties in the different measure-ments, especially in terms of trends, while some differences in the absolute magnitudes are apparent (Fig. S1). At BCN the bulk OC from the AMS was substantially higher than that measured by the rest of the instruments (Fig. S1), which we attribute to higher than
20
usual uncertainties in the calibration of that instrument due to custom modifications of the ionization region. Therefore absolute concentrations of OC from different sources calculated based on these different measurements should be compared with caution, while fractional contributions should be more directly comparable. In the following, the EC and OC concentrations used are those measured by the Sunset1 instrument (using
25
ACPD
11, 23573–23618, 2011Fossil vs. contemporary sources of fine EC
and OC
M. C. Minguill ´on et al.
Title Page
Abstract Introduction
Conclusions References
Tables Figures
◭ ◮
◭ ◮
Back Close
Full Screen / Esc
Printer-friendly Version Interactive Discussion
Discussion
P
a
per
|
Dis
cussion
P
a
per
|
Discussion
P
a
per
|
Discussio
n
P
a
per
|
increased to 20 % to better reflect the uncertainty in the measurements, shown by the differences among different methods (Fig. S1) and based on round-robin tests within EUSAAR project (EUSAAR Deliverable NA2/D10new report).
2.3 Separation of carbonaceous fractions and14C measurements
The method for the separation of carbonaceous particle fractions is based on the
dif-5
ferent chemical and thermal behavior of OC and EC in the presence of oxygen gas as shown by Lavanchy et al. (1999). This separation is complicated by the fact that there is not a clear boundary between OC and EC, since OC compounds are less volatile and more optically absorptive with increasing molecular weight and functionality; and the least refractory part of EC may show similar chemical and physical behaviours than
10
high molecular weigh OC. The separation method has been described in detail else-where (Szidat et al., 2004a). Briefly, OC is oxidized on a filter at 340◦C in a stream of
pure oxygen for 10 min. Evolved CO2 is trapped cryogenically, quantified manometri-cally in a calibrated volume, and sealed in ampoules for14C measurement. Using this method, part of the OC pyrolyses on the filter to form refractory material (an artifact
15
known as “charring”) and is therefore not collected. This approach assumes identi-cal fM of the measured and the neglected fraction, which was shown to be correct for “Urban Dust” in NIST reference material SRM 1649a (Szidat et al., 2004b). The uncertainty due to this loss of OC can be estimated as 0.03 of fMOC. This is based on an estimation of ∼20 % of OC losses and fMEC measurements with and without 20
water extraction prior to collection and analysis (Szidat et al., 2004a). Therefore, the uncertainties reported here take into account the 14C measurement uncertainty and this 0.03.
Isolation of EC for accurate14C determination targets a complete removal of OC prior to EC collection with the best possible EC recovery. Since the modern fractions of EC
25
ACPD
11, 23573–23618, 2011Fossil vs. contemporary sources of fine EC
and OC
M. C. Minguill ´on et al.
Title Page
Abstract Introduction
Conclusions References
Tables Figures
◭ ◮
◭ ◮
Back Close
Full Screen / Esc
Printer-friendly Version Interactive Discussion
Discussion
P
a
per
|
Dis
cussion
P
a
per
|
Discussion
P
a
per
|
Discussio
n
P
a
per
our laboratory (Zhang et al., 2011) was used. A detailed description can be found in the Supplement (Sects. S1 and S2, Figs. S2, S3 and S4). Briefly, water extraction is carried out prior to separation and EC collection process, so that water soluble organic and inorganic compounds are removed (Szidat et al., 2004a, 2009). This minimizes a possible positive artifact due to the aforementioned OC charring during the first thermal
5
steps (to remove OC). This charring would produce additional EC-like material, which would be combusted and collected during the EC step at 650◦C. This new method includes the coupling of a Sunset instrument to the cryo-trap system (as opposed to an oven with a fixed temperature with the Szidat et al. (2004a) method), so that the thermal cycles are defined accurately (see Supplement). The combustion process is carried
10
out under pure oxygen. The thermal program is set to minimize a possible negative artifact resulting from removal of the least refractory part of EC in the first thermal steps prior to EC collection. This method allows us to collect more EC compared to 60–80 % recovery obtained with the Szidat et al. (2004a) method and the fM obtained are thus more representative of the complete EC fraction. The EC recovery was on
15
average 90 % and 86 % for DAURE-W and DAURE-S, respectively. A rough estimate of the uncertainty generated by the 10–14 % EC loss would be an underestimation of fMEC by 0.02–0.04 (Perron, 2010), which results in<5 % (absolute percent) possible underestimation of the biomass burning EC contribution. This possible bias in the fMEC should be taken only as an estimate and therefore it is discussed here but not included
20
in the calculations.
The samples from the MSY summer campaign had very low EC concentrations. Therefore six individual combustions of each of the samples were carried out and the CO2collected was combined for a single subsequent14C analysis.
After the separation and collection of OC and EC as CO2 samples, 14C analyses
25
ACPD
11, 23573–23618, 2011Fossil vs. contemporary sources of fine EC
and OC
M. C. Minguill ´on et al.
Title Page
Abstract Introduction
Conclusions References
Tables Figures
◭ ◮
◭ ◮
Back Close
Full Screen / Esc
Printer-friendly Version Interactive Discussion
Discussion
P
a
per
|
Dis
cussion
P
a
per
|
Discussion
P
a
per
|
Discussio
n
P
a
per
|
2.4 Source apportionment of EC and OC using14C data
Source apportionment of EC and OC is based on their concentrations, 14C isotopic ratios of these two components, and the expected fM of the corresponding sources. The reference values for the different sources used in the present study are fMf=0 (for fossil sources); fMbb=1.083 (for biomass burning), corresponding to emissions from
5
burning of 25-yr-old trees harvested in 2007–2008 as determined with a tree-growth model as reported by Mohn et al. (2008); and fMbio=1.045 (for biogenic sources), corresponding to 2008–2009 from the long-term series of atmospheric 14CO2 mea-surements at Jungfraujoch research station (Levin et al., 2010). In the case of EC, the fM of non-fossil sources (fMnf) equals fMbb given that biomass burning is the only
10
source of non-fossil EC. In the case of OC, fMnfis assumed to be the average of fMbb and fMbio, given that the fractions from biomass burning and from biogenic sources are not known a priori, and both sources are thought to play a role in this region. An iterative procedure could be used to refine the initial estimates, however the subse-quent differences in the results are small, especially compared to the measurement
15
and method uncertainties, and such a procedure is not used here.
EC is apportioned into ECf and ECnf, the former attributed to combustion of fossil fuels and the latter attributed to biomass burning (ECbb). ECf can be mainly attributed to road traffic according to previous studies that found that EC in Barcelona is mainly related to road traffic emissions (P ´erez et al., 2010). Residential heating as a source
20
of ECf is not expected to be very high in the study area due to moderate average tem-peratures during DAURE-W (13.3±2.8◦C in Barcelona and 9.5±4.0◦C in Montseny;
Pandolfi et al., 2011), and due to the fact that only 9 % of the residential heating in Barcelona uses solid or liquid fossil fuel, the rest natural gas (62 %), electricity (28 %), wood (0.4 %) and other minor systems (0.2 %) (INE, 2001). Other sources such as
25
ACPD
11, 23573–23618, 2011Fossil vs. contemporary sources of fine EC
and OC
M. C. Minguill ´on et al.
Title Page
Abstract Introduction
Conclusions References
Tables Figures
◭ ◮
◭ ◮
Back Close
Full Screen / Esc
Printer-friendly Version Interactive Discussion
Discussion
P
a
per
|
Dis
cussion
P
a
per
|
Discussion
P
a
per
|
Discussio
n
P
a
per
OC is separated into OCf and OCnf. OCf is attributed to POA and SOA from fossil fuel combustion. As per ECf, the contribution of residential heating to OCf is expected to be low. As discussed before, OCnf may have different origins, such as biomass burning POA and SOA, as well as biogenic SOA. However, some other sources such as cooking, biofuel combustion, brake lining dust, natural rubber in tire dust, and others
5
may account for a substantial fraction of the total contemporary carbon, especially in urban areas (Hildemann et al., 1994). In particular several recent studies report a high fraction of cooking aerosol in urban areas (Zheng et al., 2007; Allan et al., 2010; Sun et al., 2011; Huang et al., 2010). We first present results as OCnf, without differentiating between biomass burning OC (OCbb), biogenic OC (OCbio), and other OCnfsources.
10
In a second step, which allows for comparison with results from other methods, the contribution of biomass burning to OC is estimated based on an assumed ratio for EC/OC in biomass burning emissions (EC/OC)bbe, together with the ECbb determined by14C:
OCbb= ECbb
(EC/OC)bbe (2)
15
Nevertheless, the wide range of (EC/OC)bberatios found in literature (Table S1) leads to high uncertainties in the estimation of OCbb. The (EC/OC)bbe ratio depends on many factors, such as the biofuel type and the combustion method used. For calculations here, an average (EC/OC)bbe ratio of 0.3 was used, based upon the reported values for common biofuel species in the Mediterranean, with similar combustion methods to
20
those used in Spain (Fine et al., 2004; Gonc¸alves et al., 2010), and agricultural fires (Chow et al., 2010). SOA formation from biomass burning emissions is quite variable, and a recent summary of seven field studies reports that the net addition of OA mass due to SOA formation averages to 25 % of the POA (Cubison et al., 2011). Therefore SOA formation from biomass burning emissions may lead to a∼20 % underestimation
25
ACPD
11, 23573–23618, 2011Fossil vs. contemporary sources of fine EC
and OC
M. C. Minguill ´on et al.
Title Page
Abstract Introduction
Conclusions References
Tables Figures
◭ ◮
◭ ◮
Back Close
Full Screen / Esc
Printer-friendly Version Interactive Discussion
Discussion
P
a
per
|
Dis
cussion
P
a
per
|
Discussion
P
a
per
|
Discussio
n
P
a
per
|
2.5 Other source apportionment methods and biomass burning tracers
Results from three other methods are used here for comparison with the14C-based method for DAURE-W. First, measurements of levoglucosan, an organic tracer of biomass burning (Simoneit et al., 1999) are used. Four different data sets of lev-oglucosan concentrations are available, measured by four different laboratories.
Lev-5
oglucosan was determined using the same filters used for 14C analyses (PM1 48 h samples) by two methods: gas chromatography-mass spectrometry (Agilent 6890N gas chromatograph coupled to a mass spectrometer Agilent 5973N) by the Hungarian Academy of Sciences (lev-HAS), and by proton nuclear magnetic resonance (HNMR, Tagliavini et al., 2006) by the Institute of Atmospheric Sciences and Climate of the
10
Italian National Research Council (lev-ISAC). A third levoglucosan dataset was ana-lyzed by the Finish Meteorological Institute (lev-FMI) in 12 h PM2.5 samples collected on quartz fiber filters (Munktell) by high volume (30 m3h−1) samplers DIGITEL
DHA-80, by high-performance anion-exchange chromatography with electrospray ionization mass spectrometry detection (Saarnio et al., 2010). Finally, a fourth levoglucosan
15
dataset was analyzed in 12 h PM1 samples collected on quartz fiber filters (Munktell) by high volume (30 m3h−1) samplers DIGITEL DHA-80, by gas chromatography
cou-pled to mass spectrometry (van Drooge et al., 2009; van Drooge and Ballesta, 2010) by the Institute of Environmental Assessment and Water Research (lev-IDAEA). When simultaneously available, the different levoglucosan measurements agree reasonably
20
well (Fig. S5), especially those analyzed in the same filters (lev-ISAC and lev-HAS). The highest concentrations are reported by FMI, which can be partially due to the coarser fraction (PM2.5) analyzed. In this work, we used the average of the concentra-tions of lev-HAS and lev-ISAC as they are consistent with most of the measurements, and for maximum overlap with the14C dataset.
25
ACPD
11, 23573–23618, 2011Fossil vs. contemporary sources of fine EC
and OC
M. C. Minguill ´on et al.
Title Page
Abstract Introduction
Conclusions References
Tables Figures
◭ ◮
◭ ◮
Back Close
Full Screen / Esc
Printer-friendly Version Interactive Discussion
Discussion
P
a
per
|
Dis
cussion
P
a
per
|
Discussion
P
a
per
|
Discussio
n
P
a
per
OCbb= lev
(lev/OC)bbe (3)
However, the variability of (lev/OC)bberatio in the literature is large (Table S1), and the data available for Europe, compared to the US, is scarce (Szidat et al., 2009 and refer-ences therein), which results in substantial uncertainty for the results from this method. It is also known that levoglucosan can be oxidized photochemically in the atmosphere
5
(Hennigan et al., 2010; Cubison et al., 2011) and that it can evaporate due to its semi-volatile character (Oja and Suuberg, 1999). Thus estimates from this method using ratios measured for concentrated primary emissions should be considered lower limits. An average (lev/OC)bberatio of 0.12 was used (Fine et al., 2004; Schmidl et al., 2008; Sullivan et al., 2008; Szidat et al., 2009; Gonc¸alves et al., 2010; Saarnio et al., 2010).
10
Nevertheless, given the wide range of ratios reported in the literature, uncertainties were calculated to cover the ratios ranging from 0.07 to 0.17.
A second method used here for the estimation of OM sources, including OMbb, is based on factor analysis of AMS measurements. Two high-resolution AMSs were de-ployed at the BCN and MSY sites (Mohr et al., 2011; Pandolfi et al., 2011). The AMS
15
instruments, data processing, and analysis techniques have been described in detail elsewhere (DeCarlo et al., 2006; Canagaratna et al., 2007). Positive Matrix Factor-ization (PMF) of the organic mass spectral data matrix provides information on diff er-ent sources/componer-ents of the OA (Lanz et al., 2007; Ulbrich et al., 2009), such as hydrocarbon-like organic aerosol (HOA), used as a surrogate for urban combustion
20
POA, BBOA as a surrogate for POA from biomass burning, and oxygenated OA (OOA) as a surrogate for total SOA. As discussed above, biomass burning emissions can give rise to SOA from organic gases and also from semi-volatile species from the evapo-ration of the POA (DeCarlo et al., 2010; Cubison et al., 2011). The SOA formed from biomass burning emissions produces similar mass spectra to SOA from other sources
25
ACPD
11, 23573–23618, 2011Fossil vs. contemporary sources of fine EC
and OC
M. C. Minguill ´on et al.
Title Page
Abstract Introduction
Conclusions References
Tables Figures
◭ ◮
◭ ◮
Back Close
Full Screen / Esc
Printer-friendly Version Interactive Discussion
Discussion
P
a
per
|
Dis
cussion
P
a
per
|
Discussion
P
a
per
|
Discussio
n
P
a
per
|
The third method used to estimate the biomass burning contribution is based on receptor modeling of offline filter data. Positive Matrix Factorization (PMF by means of the ME-2 scripting; Paatero, 1999; Amato et al., 2009) was applied to a dataset including elemental composition, secondary inorganic compounds, and EC and OC concentrations in PM1, referred to in this study as PMF-OF (OF standing for offline
fil-5
ter dataset). The offline dataset is discussed in detail elsewhere (Pandolfi et al., 2011). Briefly, 12 h PM1samples were collected on quartz fiber filters (Munktell) using DIGI-TEL DHA-80 high volume (30 m3h−1) samplers. Major and trace elements, and nitrate, sulfate, ammonium and chloride concentrations were determined following the proce-dure described in Querol et al. (2001). OC and EC concentrations were measured
10
by a Sunset laboratory instrument (results inter-compared in Sect. 2.2, reported as Sunset2). Details on the receptor model and individual uncertainties are available in Amato et al. (2009). This method provides, among other data products, an estimate of the biomass burning contribution to bulk submicron OC.
Finally, the correlations of the different biomass burning OA estimates and tracers
15
with ECbb(which is the most direct biomass burning tracer) were evaluated. PMF-AMS BBOA was used for DAURE-W. Levoglucosan concentrations (average of lev-HAS and lev-ISAC data sets) were used for DAURE-W. Acetonitrile concentrations measured by a High Sensitivity Proton Transfer Reaction Quadrupole Mass Spectrometer (PTR-MS; Lindinger et al., 1998) at BCN in DAURE-W and DAURE-S, and by a Proton Transfer
20
Reaction Time of Flight (PTR-TOF, Graus et al., 2010; M ¨uller et al., 2010) at MSY in W were used. Submicron potassium (K) concentrations were used for DAURE-W and DAURE-S. K concentrations were part of the PMF-OF dataset discused above (Pandolfi et al., 2011). Soluble K concentrations were determined in water extractions of the same samples and they were very similar to total K concentrations. Hence, total
25
ACPD
11, 23573–23618, 2011Fossil vs. contemporary sources of fine EC
and OC
M. C. Minguill ´on et al.
Title Page
Abstract Introduction
Conclusions References
Tables Figures
◭ ◮
◭ ◮
Back Close
Full Screen / Esc
Printer-friendly Version Interactive Discussion
Discussion
P
a
per
|
Dis
cussion
P
a
per
|
Discussion
P
a
per
|
Discussio
n
P
a
per
3 Results and discussion
3.1 EC and OC concentrations
The carbonaceous aerosol at BCN and MSY during the DAURE campaigns showed differences in concentration, fractional composition, and source influences (Figs. 1 and 2). At BCN, the contribution of EC to total carbon was substantially higher than at MSY
5
both in DAURE-W and DAURE-S, representing, on average, 32–37 % at BCN and 15– 16 % at MSY. Conversely, the OC fractional contribution was higher at MSY than at BCN (Fig. 1), although the absolute concentrations of OC were higher at BCN (Fig. 2) during DAURE-W, and similar to those at MSY in DAURE-S. OC/EC average ratios (1.7–2.1 at BCN and 5.3–5.8 at MSY) were similar and lower, respectively, than those
10
reported by previous studies at the same sampling sites (2.5 for PM1at BCN and 11 for PM2.5at MSY; P ´erez et al., 2008b; Pey et al., 2009).
3.2 EC sources
During the winter period, ECf accounted for 87±1 % (average ± propagated mea-surement uncertainty of only14C measurements) of EC at BCN, whereas at MSY this
15
percentage was 66±3 %. In summertime, these values were 91±1 % and 79±4 %
at BCN and MSY, respectively. As explained above, ECf is attributed to fossil fuel combustion, mostly road traffic, and ECnfto biomass burning.
The high contribution of fossil fuel combustion to EC concentrations in BCN is in agreement with P ´erez et al. (2010) and Reche et al. (2011), who found that black
car-20
bon concentrations varied mainly according to road traffic conditions. In both seasons, the ECf contribution to EC at the urban site is higher than at the rural site, as ex-pected. In absolute values, the difference is larger. ECf at BCN was 6.3 times higher than at MSY in winter and 4.5 times higher in summer (Fig. 2). This is consistent with the BCN/MSY ratios found for NOx concentrations, 9 and 6 for winter and summer,
25
ACPD
11, 23573–23618, 2011Fossil vs. contemporary sources of fine EC
and OC
M. C. Minguill ´on et al.
Title Page
Abstract Introduction
Conclusions References
Tables Figures
◭ ◮
◭ ◮
Back Close
Full Screen / Esc
Printer-friendly Version Interactive Discussion
Discussion
P
a
per
|
Dis
cussion
P
a
per
|
Discussion
P
a
per
|
Discussio
n
P
a
per
|
some of the more oxidized nitrogen species (NOz, Steinbacher et al., 2007; Dunlea et al., 2007). Assuming that a substantial fraction of the NOx at MSY comes from the coastal polluted regions similar to the BCN urban area, these ratios can be considered estimates of the dilution of urban and regional pollution during transport to MSY. CO concentrations were not available for comparison. The fact that the ratios are higher
5
for NOxthan EC is consistent with the fact that NOx is a reactive tracer with a lifetime on the order of 1 day and some of the reaction products (HNO3) deposit very quickly to the surface and are not sampled by NOx analyzers, while EC is unreactive. The higher contributions of ECnf in winter with respect to summer are likely due to higher emissions from residential heating and open burning of agricultural biomass (banned
10
by law from 15 March to 15 October, Decreto 64/1995), as wild fires are expected to have low impact, from negligible to 1 µg m−3of OC (Fig. S6).
3.3 Fossil vs. contemporary OC
During the winter period, OCf (thought to be mainly due to road traffic, as explained above) was 40±4 % of OC at BCN and 31±4 % at MSY. These values are similar
15
to those obtained during winter at Zurich, Switzerland (32 % OCf/OC, Szidat et al., 2006), and at G ¨oteborg, Sweden (35–45 % at an urban site and 35–40 % at a rural site, Szidat et al., 2009). A priori, it could be expected that fossil sources may have a higher influence in Spain due to the lesser use of wood burning for residential heating (less than 1 % of the heating energy, INE, 2001). On the other hand, biogenic SOA may
20
be higher under milder Spanish winter conditions compared to Switzerland or Sweden since the temperatures are higher, and biogenic volatile organic compounds (VOCs) emissions still occur in winter albeit at lower intensity than in summer (Seco et al., 2011). Therefore the differences in both sources may compensate each other, leading to similar OCf fractions.
25
In summer OCf was 48±4 % of OC at BCN and 25±5 % at MSY; this again being
ACPD
11, 23573–23618, 2011Fossil vs. contemporary sources of fine EC
and OC
M. C. Minguill ´on et al.
Title Page
Abstract Introduction
Conclusions References
Tables Figures
◭ ◮
◭ ◮
Back Close
Full Screen / Esc
Printer-friendly Version Interactive Discussion
Discussion
P
a
per
|
Dis
cussion
P
a
per
|
Discussion
P
a
per
|
Discussio
n
P
a
per
are comparable to results from Mexico City (49–62 %, Aiken et al., 2010). Absolute OCf concentrations in winter were higher than in summer (by 0.4 µg m−3) at BCN. This
was likely due to stronger accumulation of pollutants during the cold season with lower atmospheric dispersion, and perhaps to higher fossil combustion such as for residential heating.
5
At MSY, OC concentrations were similar for both seasons (Fig. 2). The ratio BCN/MSY for OCf concentrations was 2.1–2.4, which is lower than the correspond-ing ratio for ECf mentioned above (4.5–6.3). This is consistent with formation of fossil SOA during transport from urban and regional sources to the MSY site, and also con-sistent with the higher NOxratios discussed above. Further evidence is provided by the
10
comparison of the ratios of OCf/ECf for both sites. The average ratio±standard
devia-tion (variability) was 1.0±0.1 in winter and 0.9±0.2 in summer at BCN, and 2.6±0.7
in winter and 1.8±0.5 in summer at MSY. The error for MSY in summer (0.5) is the
propagated measurement uncertainty, since no variability is available because there was only one pooled sample for EC. The low variability of the ratios in BCN suggests
15
that the OCf is mainly primary, or that the secondary fraction changes little, e.g. if it is formed fast enough (Robinson et al., 2007; Chirico et al., 2010) so that it still correlates with the ECf. This is also supported by the good correlation between OCf and ECf (R2=0.81, Fig. S7). At MSY the larger ratios indicate that a substantial fraction of the OCf may be due to fossil SOA formation driven by photochemical reactions during the
20
transport to the rural site. The larger variability of the OCf/ECf at MSY, although par-tially due to the relatively high measurement uncertainty, indicates that the formation of fossil SOA may be more variable. The difference in the ratio in winter and summer at MSY is not significant due to the high uncertainties.
OCnf at BCN was twice as high in winter than in summer. This can be attributed
25
ACPD
11, 23573–23618, 2011Fossil vs. contemporary sources of fine EC
and OC
M. C. Minguill ´on et al.
Title Page
Abstract Introduction
Conclusions References
Tables Figures
◭ ◮
◭ ◮
Back Close
Full Screen / Esc
Printer-friendly Version Interactive Discussion
Discussion
P
a
per
|
Dis
cussion
P
a
per
|
Discussion
P
a
per
|
Discussio
n
P
a
per
|
likely be explained by a higher contribution of biogenic SOA in summer, due to higher biogenic emissions and enhanced photochemistry. Seco et al. (2011) report sum-mer/winter ratios of∼10 for biogenic VOCs ambient concentrations at the rural site.
3.4 Further source apportionment of the non-fossil OC
OCnf can be apportioned to the different sources with some additional assumptions.
5
The estimations carried out in the present study include biomass burning (OCbb), bio-genic SOA (OCbio) and other fossil contributions called in this study as urban non-fossil OC (OCurb−nf), such as cooking and tire wear. Results are shown in Fig. 3. OCbb was estimated with the method described in Sect. 2.4 (Eq. 2). OCbb is estimated to account for 30–35 % of the OCnf at both sites and seasons (17–21 % of total OC), with
10
the exception of MSY in summer, where it only accounted for 16 % of the OCnf (12 % of total OC). The contribution from OCurb−nf was calculated from the OCf contribution, based on the assumption that OCurb−nf is ∼20 % of the total urban OC contribution
(OCf+OCurb−nf) (Hildemann et al., 1994; Hodzic et al., 2010). OCurb−nfwas estimated as 0.2–0.3 µg m−3 at BCN, which is 16–23 % of the OCnf (10–12 % of total OC). At
15
MSY, the OCurb−nf was lower (0.14 and 0.11 µg m−3 in winter and summer,
respec-tively, 8–11 % of the OCnf, 6–8 % of total OC). As discussed above, OCurb−nf may be underestimated if recent studies of a cooking contribution similar to the traffic OC con-tribution are applicable to this region. The OCbio contribution was slightly higher in summer (1.0 µg m−3) than in winter (0.7 µg m−3) at MSY, while OC
biowas lower in sum-20
mer at BCN. The absence of a strong increase in OCbioconcentration between winter and summer, compared to a factor of 10 increase in biogenic VOCs is very surprising. Although a larger fraction of the biogenic SOA species may remain in the gas-phase in the summer compared to the winter, this effect is thought to be small (e.g. Martin et al., 2010). This disagreement remains unexplained with the tools available at the moment,
25
ACPD
11, 23573–23618, 2011Fossil vs. contemporary sources of fine EC
and OC
M. C. Minguill ´on et al.
Title Page
Abstract Introduction
Conclusions References
Tables Figures
◭ ◮
◭ ◮
Back Close
Full Screen / Esc
Printer-friendly Version Interactive Discussion
Discussion
P
a
per
|
Dis
cussion
P
a
per
|
Discussion
P
a
per
|
Discussio
n
P
a
per
3.5 Day-to-day variation
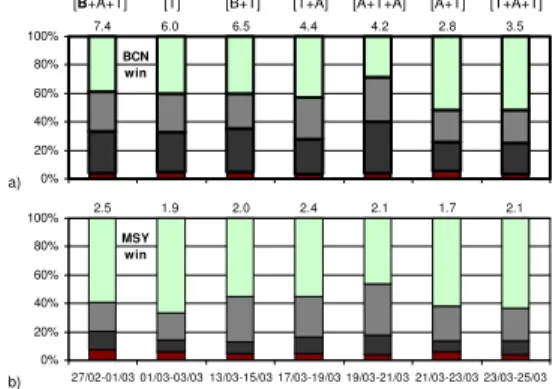
There was only moderate day-to-day variation in the fractional contributions to TC throughout the winter period. The fossil fraction of TC (TCf) (48 h averages) varied between 42–68 % at BCN and between 27–50 % at MSY (Fig. 4). The different meteo-rological scenarios during the campaign are described in detail by Pandolfi et al. (2011).
5
Briefly, there were three types of scenarios during winter: A, characterized by recircu-lation of air masses and accumurecircu-lation of pollutants with both MSY and BCN within the mixing layer; B, when the mixing layer height was very low and hence MSY was above it; and C, with Atlantic advection which resulted in flushing pollutants from the region. There were some transition periods between different scenarios indicated as
10
T in Fig. 4. Note that due to the sampling periods (48 h in winter and 24 h in summer) more than one type of scenario may correspond to a single sample. In these cases the prevailing scenario is in bold in Fig. 4.
Samples from 17 March to 25 March were collected during periods with prevailing scenario A conditions. For those samples TC concentrations at BCN were about twice
15
those at MSY. The TCf, ECfand OCf contributions at BCN and MSY for these samples were highly correlated (R2=0.83–0.98; Fig. 5). When TCf was more dominant at BCN (19 March–21 March, 68 % of TC), the contribution of TCf at MSY increased with respect to the rest of the days (reaching 50 %). Conversely, when TCfshowed a lower contribution at BCN (21 March–23 March and 23 March–25 March; 42 % and 45 %,
20
respectively), TCf was also lower at MSY (32 %) (Fig. 4a and b), which reflects the stronger coupling of both sites due to the shared mixed layer.
Under scenario B conditions, concentrations of TC at BCN were about 3 times those at MSY and the fractional contributions were different, consistent with the meteorolog-ical characterization of a decoupling between the two sites. There was no correlation
25
ACPD
11, 23573–23618, 2011Fossil vs. contemporary sources of fine EC
and OC
M. C. Minguill ´on et al.
Title Page
Abstract Introduction
Conclusions References
Tables Figures
◭ ◮
◭ ◮
Back Close
Full Screen / Esc
Printer-friendly Version Interactive Discussion
Discussion
P
a
per
|
Dis
cussion
P
a
per
|
Discussion
P
a
per
|
Discussio
n
P
a
per
|
During the summer campaign, a time-resolved comparison of TCfbetween both sites is not possible due to the lack of time-resolved data for the EC fractions at MSY, as ex-plained above. TCf varied between 47–75 % at BCN (Fig. 4c and d). The different meteorological scenarios during the summer campaign are described in detail by Pan-dolfi et al. (2011). Briefly, scenario D was characterized by regional pollution; E was
5
characterized by Atlantic advection (similar to winter scenario C); and F was influenced by air masses coming from North Africa. Even though 9 July–10 July and 11 July–12 July samples were collected under the same type of scenario (D scenario), the first sample showed TC concentrations at BCN 3 times those at MSY, whereas for the sec-ond sample the concentrations were similar between sites, suggesting some variability
10
in dispersion between those periods. For the rest of the samples, collected under sce-nario F, the fractional contribution variations were similar at MSY and BCN, although there was not a clear correlation in concentrations as that found for winter (Fig. S8).
3.6 Combination of14C and PMF-AMS results
A comparison of the relative contributions to OC determined by the14C and PMF-AMS
15
techniques is shown in Fig. 6 (DAURE-W only). We compare fractional contributions as they should not be affected by concentration inaccuracies in either method. To compare the results from the14C method to PMF-AMS measurements, OC was calculated from PMF-AMS OM as explained in Sect. 2.2. These calculations result in hydrocarbon-like organic carbon (HOC), cooking organic carbon (COC), biomass burning organic
20
carbon (BBOC), and oxygenated organic carbon (OOC) contributions. To facilitate comparison to14C results, the sources identified by PMF-AMS were divided into fossil and non-fossil. HOC from BCN was included in the fossil sources. For MSY, HOC was assumed to be 80 % of fossil origin (HOCf) and 20 % from urban non-fossil sources (HOCnf) (based on Hildemann et al., 1994). COC and BBOC were included in the
25
ACPD
11, 23573–23618, 2011Fossil vs. contemporary sources of fine EC
and OC
M. C. Minguill ´on et al.
Title Page
Abstract Introduction
Conclusions References
Tables Figures
◭ ◮
◭ ◮
Back Close
Full Screen / Esc
Printer-friendly Version Interactive Discussion
Discussion
P
a
per
|
Dis
cussion
P
a
per
|
Discussion
P
a
per
|
Discussio
n
P
a
per
method, so that the resulting total OCf/OCnf ratio from PMF-AMS sources equals the OCf/OCnfratio from14C method.
At BCN, OCf is estimated to be ∼35 % secondary, so a major fraction of the OCf in BCN is estimated to be primary (∼65 %). This fossil secondary percentage is
rela-tively low when compared to findings from Robinson et al. (2007), who predict a high
5
proportion of SOA formation from vehicle emissions. OCnf is a combination of COC, OOCnf and primary BBOC. OOC, a surrogate for total secondary OC, is mostly non-fossil (∼70 %), with this fraction being due to biogenic sources, biomass burning, and
urban non-fossil sources.
At MSY, OCf is estimated to be ∼85 % secondary. This is consistent with previous 10
conclusions based on the higher OCf/ECf ratio at MSY than at BCN (see Sect. 3.3), which also indicated a higher contribution of fossil SOA at MSY. Like at BCN, the OOC determined with the AMS is mostly non-fossil (∼70 %), and may have different
ori-gins such as biogenic sources or biomass burning. Hence, the combination of both techniques allows a better characterization of the carbonaceous aerosol sources,
dis-15
tinguishing the primary and secondary contributions.
3.7 Comparison of biomass burning OC determined by different approaches
In Fig. 7 we compare the biomass burning OC (OCbb) concentrations during winter estimated using 14C data with those from several other techniques, including PMF-AMS, PMF-OF, and the tracer-based method using levoglucosan. Note that for the
20
results from the PMF-AMS and levoglucosan methods the concentrations refer to only primary BBOC (Grieshop et al., 2009; DeCarlo et al., 2010). No biomass burning source was identified at BCN by PMF-OF although this technique enabled identification of such a source at MSY. Lack of identification at BCN may be due to the presence of multiple additional sources, which complicate the identification of relatively small
25
ACPD
11, 23573–23618, 2011Fossil vs. contemporary sources of fine EC
and OC
M. C. Minguill ´on et al.
Title Page
Abstract Introduction
Conclusions References
Tables Figures
◭ ◮
◭ ◮
Back Close
Full Screen / Esc
Printer-friendly Version Interactive Discussion
Discussion
P
a
per
|
Dis
cussion
P
a
per
|
Discussion
P
a
per
|
Discussio
n
P
a
per
|
Biomass burning contributions estimated by the14C technique are similar or in most cases slightly higher than those from other techniques. The difference compared to the AMS and levoglucosan results may be partially explained by the presence of biomass burning SOC, which is not included in the OCbb calculated using these methods, and would be expected to be∼25 % of POA (Cubison et al., 2011). It is also possible that 5
the biomass burning OC contribution estimated by the14C method is overestimated, if the (EC/OC)bbeassumed for our calculations is too low for the biomass burning taking place in the study area. Nevertheless, the different estimates follow the same time trend, with the exception of PMF-OF. Thus it appears that PMF-OF is less accurate in the retrieval of this source.
10
It is of interest to further evaluate the similarities of the different biomass burning estimation methods and tracers, without the possible systematic uncertainties associ-ated with the conversion factors used to estimate the OCbbfrom different tracers (such as (EC/OC)bbe, (lev/OC)bbe, and OM/OC for biomass burning). Scatter plots of the different tracers and estimates are shown in Fig. 8. BBOA estimated by PMF-AMS
15
correlates well with ECbb (R2=0.84, using all samples), as seen in Fig. 8a. The cor-relation of levoglucosan concentrations with ECbb shows anR2=0.57 with a slope of 0.20 using all samples (Fig. 8b). The slope is the lev/ECbb ratio, which is in the lower range of the lev/ECbb values found in the literature, which vary from 0.15 to 2 in most cases (Schmidl et al., 2008; Sullivan et al., 2008; Gonc¸alves et al., 2010; Saarnio et
20
al., 2010), although much higher values (up to 10 or 15) have also been reported (Fine et al., 2004; Sullivan et al., 2008). This may indicate lower initial emission ratios, or some oxidation or evaporation of levoglucosan during atmospheric transport.
Acetonitrile concentrations show correlation with ECbb(R2=0.67, Fig. 8c). Although concentrations at MSY were close to typical acetonitrile continental background
con-25
ACPD
11, 23573–23618, 2011Fossil vs. contemporary sources of fine EC
and OC
M. C. Minguill ´on et al.
Title Page
Abstract Introduction
Conclusions References
Tables Figures
◭ ◮
◭ ◮
Back Close
Full Screen / Esc
Printer-friendly Version Interactive Discussion
Discussion
P
a
per
|
Dis
cussion
P
a
per
|
Discussion
P
a
per
|
Discussio
n
P
a
per
may be due to other sources than by biomass burning, such as food cooking (Hilde-mann et al., 1991; Schauer et al., 1999), vegetative detritus (Hilde(Hilde-mann et al., 1991), fly ash (Lee and Pacyna, 1999), and dust such as feldspars and clay minerals. This is consistent with findings by Zhang et al. (2010) and Aiken et al. (2010), and the latter authors reported a background non-biomass burning K concentration of∼120 ng m−3 5
in Mexico City. Moreover, K emissions depend on the burning conditions. The influ-ence of cooking on the K concentrations is supported by the higherR2(0.74) found for multilinear regression of K concentrations vs. BBOA and COA concentrations found by PMF-AMS at BCN, compared to theR2(0.54) for K concentrations vs. BBOA. Never-theless, the noise in the K data is quite high (see measurement uncertainty as error
10
bars for two data points in Fig. 8c), which should be considered when evaluating the robustness of the conclusions from these data. Therefore, given the moderate correla-tion of K with ECbband the high uncertainty in K concentrations, K is not the best tracer for biomass burning emissions for the present study.
4 Conclusions
15
The contribution of EC to TC at BCN was substantially higher than at MSY both in the winter and the summer campaign. The OC contribution, although higher at MSY as a fraction of TC, was higher at BCN in absolute concentration.
At BCN, 87 and 91 % of the EC, in winter and summer, respectively, had a fossil origin (mainly road traffic), whereas at MSY these percentages were 66 and 79 %,
re-20
spectively. In absolute values, ECf at BCN was 4.5–6.3 times that at MSY, which is in agreement with dilution ratios estimated from NOx concentrations. Higher concen-trations of ECnf were found in winter than summer and attributed to a higher biomass burning contribution during winter.
The contribution of fossil sources to OC (mainly POA and SOA from road traffic)
25
ACPD
11, 23573–23618, 2011Fossil vs. contemporary sources of fine EC
and OC
M. C. Minguill ´on et al.
Title Page
Abstract Introduction
Conclusions References
Tables Figures
◭ ◮
◭ ◮
Back Close
Full Screen / Esc
Printer-friendly Version Interactive Discussion
Discussion
P
a
per
|
Dis
cussion
P
a
per
|
Discussion
P
a
per
|
Discussio
n
P
a
per
|
G ¨oteborg, Sweden. The highest contribution of fossil sources to total carbon found in the present study is similar to the average values from Mexico City. The absolute OCf concentrations in winter were slightly higher than in summer at BCN due to stronger accumulation of pollutants due to reduced dispersion, whereas at MSY the concentra-tions were similar for both seasons. By combining results from the14C and PMF-AMS
5
techniques, we can estimate that the OCf at BCN is ∼65 % primary. The formation
of secondary OCf appears to be rapid enough that the OCf/ECf stays about constant for the timescales of our samples. At MSY the OCf is mainly secondary (∼85 %), as determined both by the high OCf/ECf ratio at MSY, and the combination of 14C and PMF-AMS results.
10
OCnf at BCN was higher in winter than in summer probably due to a higher contri-bution of biomass burning. At MSY, OCnf was higher in summer which is explained by a higher contribution of biogenic emissions (partially offset by decreased biomass burning). Nevertheless, the estimated biogenic secondary OC does not increase pro-portionally to the order-of-magnitude increase observed for biogenic volatile organic
15
compounds (VOCs) between winter and summer, which highlights the uncertainties in the estimation of that component.
There was moderate day-to-day variation throughout the study periods (with the fos-sil contribution to total carbon being between 42–68 % at BCN and 27–50 % at MSY in winter, and between 47–75 % at BCN in summer), but the differences between BCN
20
and MSY in TC levels and source contributions depended largely on the meteorologi-cal conditions. Hence, during regional pollution accumulation episodes, concentrations and source distributions were similar at both sites; whereas during stagnation episodes when the boundary layer was below the MSY sampling site, the sites were decoupled and the total carbon levels and fossil sources contribution were higher at BCN than at
25
MSY.
ACPD
11, 23573–23618, 2011Fossil vs. contemporary sources of fine EC
and OC
M. C. Minguill ´on et al.
Title Page
Abstract Introduction
Conclusions References
Tables Figures
◭ ◮
◭ ◮
Back Close
Full Screen / Esc
Printer-friendly Version Interactive Discussion
Discussion
P
a
per
|
Dis
cussion
P
a
per
|
Discussion
P
a
per
|
Discussio
n
P
a
per
be partially explained by the contribution of SOA formed from biomass burning emis-sions (not included in the OCbbfrom these methods), and/or an overestimation of OCbb contribution due to a non-representative biomass burning EC/OC ratio used for the calculations. Bulk submicron K concentrations, although commonly used as tracer for biomass burning, appear influenced by other sources other than by biomass burning
5
during winter, as observed in some previous studies. PMF-AMS BBOA and acetonitrile concentrations are the biomass burning markers that correlate better with ECbb.
Supplementary material related to this article is available online at: http://www.atmos-chem-phys-discuss.net/11/23573/2011/
acpd-11-23573-2011-supplement.pdf.
10
Acknowledgements. This work was supported by the Acci ´on Complementaria DAURE CGL2007-30502-E/CLI, the GRACCIE project CSD2007-00067, and the VAMOS project CGL2010-19464/CLI. This work was also supported by the EU FP6 project EUCAARI and the IMBALANCE project within the Centre of Competence for Environment and Sustainabil-ity (CCES). M. C. Minguill ´on was partially supported by a Postdoctoral Grant in the frame of
15
Programa Nacional de Movilidad de Recursos Humanos del Plan nacional de I-D+I 2008– 2011 from the Spanish Ministry of Science and Innovation. D. A. Day, A. M. Ortega, and J. L. Jimenez were partially supported by US NSF grants ATM-0920940 and ATM-0919189 (from Atm. Chem. and OISE – Office of International Science and Engineering), and by NOAA grant NA08OAR4310565. A. M. Ortega was supported by DOE SCGF (ARRA/ORISE/ORAU)
20
Fellowship DE-AC05-06OR23100. J. Pe ˜nuelas and R. Seco were supported by the Spanish Government projects CGL2010-17172 and Consolider Ingenio Montes CSD2008-00040.
References
Aiken, A. C., Decarlo, P. F., Kroll, J. H., Worsnop, D. R., Huffman, J. A., Docherty, K. S., Ulbrich, I. M., Mohr, C., Kimmel, J. R., Sueper, D., Sun, Y., Zhang, Q., Trimborn, A., Northway, M.,
25


![Fig. 5. TC f , EC f and OC f contributions at MSY vs. TC f , EC f and OC f contributions at BCN during scenario [A] and during scenario [B]](https://thumb-eu.123doks.com/thumbv2/123dok_br/17112682.238037/43.918.149.558.100.488/fig-ec-contributions-msy-contributions-bcn-scenario-scenario.webp)


