www.atmos-chem-phys.net/10/1773/2010/ © Author(s) 2010. This work is distributed under the Creative Commons Attribution 3.0 License.
Chemistry
and Physics
Light absorption by organic carbon from wood combustion
Y. Chen and T. C. Bond
University of Illinois, Champaign-Urbana, IL, USA
Received: 4 September 2009 – Published in Atmos. Chem. Phys. Discuss.: 30 September 2009 Revised: 20 January 2010 – Accepted: 26 January 2010 – Published: 16 February 2010
Abstract.Carbonaceous aerosols affect the radiative balance of the Earth by absorbing and scattering light. While black carbon (BC) is highly absorbing, some organic carbon (OC) also has significant absorption, especially at near-ultraviolet and blue wavelengths. To the extent that OC absorbs visible light, it may be a non-negligible contributor to positive direct aerosol radiative forcing. Quantification of that absorption is necessary so that radiative-transfer models can evaluate the net radiative effect of OC.
In this work, we examine absorption by primary OC emit-ted from solid fuel pyrolysis. We provide absorption spectra of this material, which can be related to the imaginary refrac-tive index. This material has polar character but is not fully water-soluble: more than 92% was extractable by methanol or acetone, compared with 73% for water and 52% for hex-ane. Water-soluble OC contributes to light absorption at both ultraviolet and visible wavelengths. However, a larger por-tion of the absorppor-tion comes from OC that is extractable only by methanol. Absorption spectra of water-soluble OC are similar to literature reports. We compare spectra for material generated with different wood type, wood size and pyroly-sis temperature. Higher wood temperature is the main factor creating OC with higher absorption; changing wood temper-ature from a devolatilizing state of 210◦C to a near-flaming state of 360◦C causes about a factor of four increase in mass-normalized absorption at visible wavelengths. A clear-sky radiative transfer model suggests that, despite the absorption, both high-temperature and low-temperature OC result in neg-ative top-of-atmosphere radineg-ative forcing over a surface with an albedo of 0.19 and positive radiative forcing over bright surfaces. Unless absorption by real ambient aerosol is higher than that measured here, it probably affects global average clear-sky forcing very little, but could be important in energy balances over bright surfaces.
Correspondence to:T. C. Bond
1 Introduction
Aerosol particles can directly modify the earth’s radiation balance by absorbing and scattering solar radiation, and this is one of the largest uncertainties in the radiative forcing of climate (Anderson et al., 2003, McComiskey et al., 2008; IPCC, 2007). Absorption of light, a component of light ex-tinction, is special in two ways. First, it causes warming of the entire Earth system and atmospheric heating, whereas scattering – the other larger component of extinction – causes cooling. Second, only a few types of aerosols, specifically carbonaceous particles and mineral dust, absorb solar radi-ation. Carbonaceous aerosols are prevalent in urban areas (Moln´ar et al., 1999; He et al., 2001; Johnson et al., 2006; Meng et al., 2007; Krecl et al., 2007) and in continental out-flow (Gabriel et al., 2002; Mader et al., 2002; Quinn and Bates, 2005). Carbonaceous aerosol is composed of black carbon (BC) and various types of organic carbon (OC). By mass, OC is 3–12 times more than BC (Moln´ar et al., 1999; Husain et al., 2007), and it accounts for 10-70% of total fine aerosol mass (Murphy et al., 2006; Quinn and Bates, 2003; Turpin et. al., 2000).
Visible light absorption is important for direct radiative forcing, since 47% of solar energy is distributed within vis-ible range between 400 nm and 700 nm. Absorption in the ultraviolet range is also significant, since it may affect photo-chemistry and thus reduce tropospheric ozone concentration (Jacobson, 1998). Because BC is known to be the most ab-sorbing aerosol in the visible wavelengths in the atmosphere, the optical properties of BC have been the focus of much in-vestigation.
rather than black carbon. Kirchstetter et al. (2004) measured near UV and visible light absorption of filter-based aerosol samples from biomass burning before and after acetone treat-ment, and estimated 50% of the total light absorption was contributed by organic carbon. Qin and Mitchell (2009) sug-gested that the variable blue-band absorption of Australian aerosols may be related to organic compounds emitted dur-ing certain vegetation burndur-ing. Roden et al. (2006) also dis-cussed absorption with strong wavelength dependence from smoldering biofuel. P¨oschl (2003) suggested that the molec-ular structure of the light absorbing organic aerosols were similar to polycyclic aromatic hydrocarbons (PAHs), humic-like substances (HULIS) and biopolymers. Andreae and Ge-lencs´er (2006) reviewed the evidence for and nature of this “brown carbon.” Sun et al. (2007) examined 200 organic compounds and inferred that the light absorbing organic car-bon was probably oxygenated or multifunctional, or had very high molecular weight. This work also compared reported values of absorption by organic carbon, and found that or-ganic carbon from combustion sources might be five times more absorbing than water-soluble OC (Havers et al., 1998; Varga et al., 2001; Hoffer et al., 2006). They suggested that the compounds not extractable by water or alkali must con-tribute to this kind of difference. Bergstrom et al. (2007) reported strong wavelength dependence in biomass-burning regions.
Although OC could have an important contribution to ra-diative forcing, its treatment in global climate models to date has been simplistic; it has been treated as a compound that primarily scatters light and has invariant properties (Liousse et al, 1996; Cooke et al, 1999; Chung and Seinfeld, 2002). In fact, chemical and optical properties of OC may differ due to the nature of the OC source or atmospheric processing. The present paper aims to contribute to understanding this vari-ability by examining biomass combustion, one of the largest sources for primary BC and OC. Bond et al. (2004) esti-mated the global annual emissions of BC and primary OC as 8 Tg and 34 Tg respectively. Of the total primary OC, the contribution of biofuel and open biomass burning were 19% and 74% respectively.
Emission rates and chemical properties from biomass burning are quite variable (e.g. Reid et al., 2005). One method of attempting to capture this variability is to exam-ine a wide range of fuels (e.g. Andreae et al., 1998; Ferek et al., 1998; Schauer et al., 2001). However, we have observed large variability even when wood of similar composition is burned (Roden et al., 2009), suggesting that other variables such as fuel size or combustion conditions must also affect emissions. In fact, models of wood pyrolysis and char pro-duction (e.g. Shafizadeh, 1982; Antal and Varhegyi, 1995; Bryden et al., 2002) are largely able to model reaction prod-ucts for different types of biomass with simple kinetic param-eters, although they admit large variation in the composition of the escaping volatile matter which forms OC. This suc-cess suggests that the factors governing emissions are partly
thermodynamic and kinetic, and not strictly attributable to wood type. It is impossible to measure OC properties – or at least, to obtain funding for such broad measurements – for every type of wood in every form of combustion around the world. Furthermore, even if such an array of measurements was feasible, the detail could not be applied in an emission model. However, if the variables controlling these proper-ties are isolated, they can be used to understand and predict emissions from a wide variety of wood types and combus-tion condicombus-tions. Therefore, our approach in this work is to examine OC emitted from highly controlled thermal degra-dation of biomass. These can then be connected with real-world variables such as combustion temperature, fuel type and fuel size. We recognize that this is an ambitious target, and that the present contribution is only a small step toward it. Since the vast majority of primary organic aerosol arises from biomass combustion, we believe that such a system-atic approach is warranted. Wood combustion comprises at least two distinct processes that affect the properties of the resulting aerosol: release of volatile material from the solid, and its condensation or combustion in the atmosphere. In a real burn, after this material leaves the solid wood, it may ei-ther condense to form “organic carbon” or burn in a diffusion flame to produce black carbon. Our goal in this experiment is to understand the nature of the devolatilizing material gen-erated by wood pyrolysis. This material is emitted directly.
N
e
p
h
e
lo
m
e
te
r
CO/CO2
analyzer PSAP
OC/EC backup
Millipore
Quartz
OC/EC UV-Vis
Filter collection Real-time optical analysis
Dilution air
probe impactor
Vacuum pump
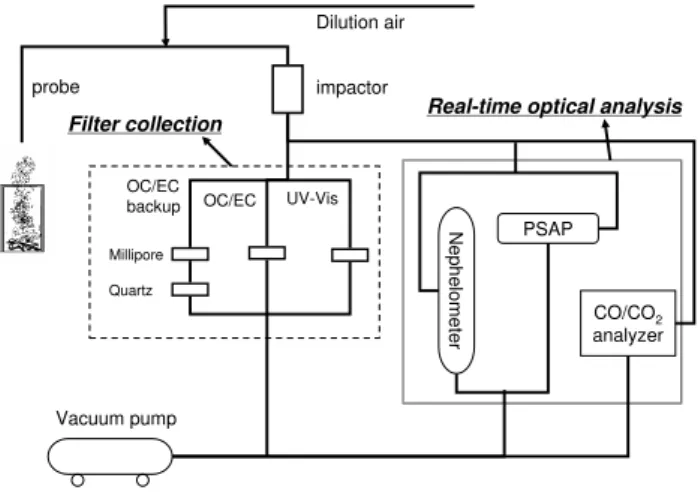
Fig. 1.Schematic of sampling system.
2 Methods
2.1 Sample generation
OC samples were generated in a series of controlled pyroly-sis experiments and then collected on quartz filters. Figure 1 shows the schematic of the sampling system. Organic carbon samples were generated in the laboratory by pyrolyzing small pieces of wood in an adjustable, electrically-heated combus-tor. The combustor, shown in Fig. 2, created a temperature-controlled environment using a 120 volt, 650 watt, Watlow VC403A06A, resistive heating cylinder sealed to a base of insulating firebricks. The combustor contains no flame source and formation of black carbon can be avoided by pre-venting flames if no oxygen enters the combustor. The top was enclosed and a nitrogen carrier gas kept the combustor at a slight positive pressure. Smoke escaped through a chim-ney (not shown) and was sampled as described below. Our combustor simulates the release of volatile matter at realis-tic wood temperatures; there is no oxygen either inside the wood or in the diffusion flame.
Wood pieces were placed in the bottom center of the com-bustor, and temperature was measured near the exterior of the wood pieces. After an initial natural dilution that entrained room-temperature air until the temperature reached 70◦C, a diluting probe further diluted the smoke stream with HEPA-filtered air at a ratio of 4:1 to cool the emissions to ambient temperature (25◦C). Particles larger than 1 µm were removed with an impactor. A change of dilution ratio from 4:1 to 40:1 did not change the measured absorption per mass (i.e., the difference was within experimental uncertainty). Other ef-fects of gas-particle partitioning are discussed in Sect. 2.5.2. We used two types of wood (oak and pine) of three dif-ferent sizes. These will be reported as cross-sectional area (height ×width) times along-grain length. “Small” wood was (0.64 cm×1.92 cm) ×1.92 cm. “Medium” wood was (1.92 cm×1.92 cm)×1.92 cm. “Large” wood had the same
Watlow VC403A06A 650 W heater
H = 6”
2 ½ “ thick 9” x9” firebrick base
N2inlet and Bottom Thermocouple
Top Thermocouple
I.D. = 3”
O.D. = 7”
Fig. 2.Detailed Diagram of Combustor.
cross-section as medium wood (1.92 cm×1.92 cm), but its length was 5.76 cm. These three wood sizes will be indicated by S, M and L respectively. In all cases, the wood moisture was very low (about 10%). We refer to samples using the for-mat “type size temperature” (e.g. oak M 270). In total, 18 complete experiments and analyses were carried out with dif-fering generation temperatures (210±20◦C, 270±20◦C and 360±20◦C), wood types and wood sizes, as listed in Table 1. Additional experiments to elucidate the nature of the samples will also be described later.
2.2 Sample collection
We collected simultaneous samples on filters in three branches. Unless stated otherwise, all filters were quartz (Pall, TISSUQUARTZ 2500QAT-UP) and filter holders were URG (URG-2000-30RAF). The first branch was used to col-lect samples for UV-vis absorption, which required large samples (milligram quantities). The resulting filter loading is higher than the range of the analyzer used for total carbon, so a second branch had a smaller flow rate for this analysis. However, quartz filters may also collect adsorbed organic va-pors (McDow and Huntzicker, 1990; Turpin et al., 1994). A Teflon-quartz filter combination has been recommended to estimate this artifact (Turpin et al., 1994; Kirchstetter et al., 2001), with a Teflon filter (Millipore, Fluoropore™ Mem-brane Filters, FALP04700) removing particles from the gas stream, and a quartz filter estimating the gaseous adsorption. The third branch contained this combination.
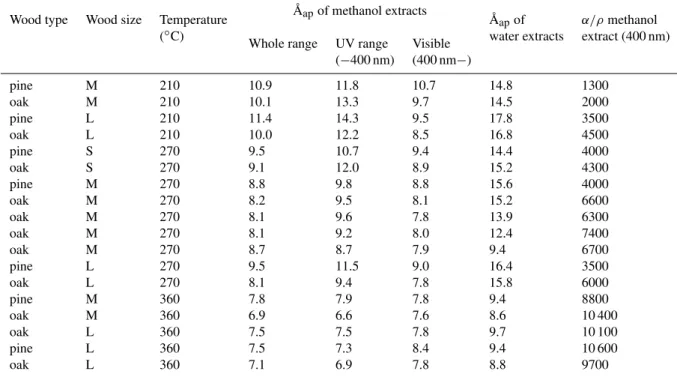
Table 1.Overview of sample information and ˚Aap(whole investigated range, UV range and visible range).
Wood type Wood size Temperature A˚apof methanol extracts A˚apof α/ρmethanol
(◦C) water extracts extract (400 nm)
Whole range UV range Visible (−400 nm) (400 nm−)
pine M 210 10.9 11.8 10.7 14.8 1300
oak M 210 10.1 13.3 9.7 14.5 2000
pine L 210 11.4 14.3 9.5 17.8 3500
oak L 210 10.0 12.2 8.5 16.8 4500
pine S 270 9.5 10.7 9.4 14.4 4000
oak S 270 9.1 12.0 8.9 15.2 4300
pine M 270 8.8 9.8 8.8 15.6 4000
oak M 270 8.2 9.5 8.1 15.2 6600
oak M 270 8.1 9.6 7.8 13.9 6300
oak M 270 8.1 9.2 8.0 12.4 7400
oak M 270 8.7 8.7 7.9 9.4 6700
pine L 270 9.5 11.5 9.0 16.4 3500
oak L 270 8.1 9.4 7.8 15.8 6000
pine M 360 7.8 7.9 7.8 9.4 8800
oak M 360 6.9 6.6 7.6 8.6 10 400
oak L 360 7.5 7.5 7.8 9.7 10 100
pine L 360 7.5 7.3 8.4 9.4 10 600
oak L 360 7.1 6.9 7.8 8.8 9700
2.3 Analytical techniques
Quartz filters in the higher flow rate branch were extracted with deionized water and organic solvents, methanol (Fisher Scientific, A.C.S. certified), hexane (Fluka, puriss, p.a.) and acetone (Fisher Scientific, A.C.S. certified). A punch of filter and solvent were sonicated (Ultrasonic Cleaner, Cole Parmer 8892) for 1 h, kept at room temperature for 20 h to let the so-lution reach equilibrium, and sonicated for 1 additional hour. Polidori et al. (2008) reported that sonicating increased ex-traction efficiencies by 10–15%. All extracts were filtered by syringe through a 25mm diameter filter with a 0.2 µm pore size (Whatman, Anotop* Disposable Syringe Filters) to remove impurities during the extraction process. How-ever, some particles carried by the solvent may be retained by the filter during the filtration step, and our method of de-terminingα/ρ would underestimate its magnitude. Further investigation of carbon loss in the filtration step is required to account for this bias. Residual filters were taken out of the solutions, dried in a fume hood and then kept in the freezer in dishes prepared as described previously. Contamination during drying was less than 1% of the collected OC, as de-termined by extracting and drying blank quartz filters with the same procedure.
Light absorption of extracts was measured at wavelengths from 190 nm to 800 nm with UV-vis recording spectropho-tometer (Shimadzu, UV-2401). Each spectrum was deter-mined relative to a reference cuvette which contained the same solvent. Four considerations determined the valid
spec-tral range: (1) Contamination from Whatman filters affected absorption when wavelength was shorter than 300 nm (tested with extracts of blank filters); (2) acetone has very high ab-sorbance at wavelengths shorter than 340 nm, so no sam-ple absorbance can be determined for those extracts at short wavelengths; (3) the instrument detection limit wasA=0.05; we mark this range of validity in all results; and (4) we did not use data where Beer-Lambert law is not valid. Di-lution tests ranging from 12:1 to 2:1 confirmed that the Beer-Lambert law was valid for these samples in the range
A <1. This absorbance usually corresponds to wavelengths between 300–390 nm. Based on these considerations, the typical valid range differs for samples and solvent extracts, beginning at 300–400 nm and ending at 450–550 nm. The difference in valid ranges means that absorption data will not be provided for exactly the same wavelength range for all samples. In some cases, there is only a narrow overlap. In this paper, we will focus on the spectrometer data from 360 nm to 500 nm; spectra between 500 nm and 600 nm will also be presented even though the data are often below de-tection limit. In the figures, we will cut off at the shorter wavelength side for values of A greater than 1 and the results at longer wavelength side below instrument detection limit were indicated by dashed lines.
2.4 Data reduction: absorption per mass
The main values reported in this paper are absorption cross-section divided by organic carbon densityα/ρin the unit of cm2/g. Hereαis the absorption coefficient, andρis the
den-sity of the dissolved compounds. The value ofα/ρcan be de-rived from spectroscopic data, using the sample absorbance A, the optical path length L (cm), and the concentration of liquid solutionc(g/L), as shown in Eq. (1).
α/ρ= A
c·L·ln(10) (1)
Here,A(absorbance) comes from the spectrophotometer,L
is 1 cm, and the concentrationcwas calculated from carbon in extracts divided by the extract volume.
Sun et al. (2007) pointed out that α/ρ is easily derived from measured spectra, and also easy to translate to radiative-transfer models. The absorption cross-section per mass for particulate matter must be determined using Mie theory com-bined with a refractive index. The imaginary partkof refrac-tive indexm=n+kiis proportional to α: α=4π k/λ. A den-sity must be chosen to obtain an imaginary refractive index fromα/ρ. That density is somewhat uncertain, but it is only an intermediate value; it is required again in Mie or other models that calculate particulate absorption per mass. If the same density is used in both calculations, it has little effect on particulate absorption. We therefore choose to communicate in terms ofα/ρ. Although the units are the same as those of mass-normalized absorption cross-section by particulate matter, the two differ and should not be confused.
2.5 Determination of carbon in extracts
The total carbon in each aliquot before and after extraction was measured with a thermal-optical OC/EC analyzer (Sun-set Laboratory, Tigard, OR), for both the high and low flow rate filters. OC in the extracts was calculated by subtracting OC in the residual filter from OC in the filter before extrac-tion. Total carbon analyzers typically used for water quality were inappropriate because of the organic solvents.
In many cases, the loading on the high-flow filters before extraction was above the valid range of the OC/EC analyzer. In such cases, the total OC before extraction on these filters was determined using the low-flow filter and the ratio of the high and low flows.
Emissions from primary combustion sources contain or-ganic matter with a broad range of volatility (Schauer et al., 2001; Shrivastava et al., 2006). Organic carbon col-lected on quartz filters contains three broad classes: non-volatile particulate carbon, semi-non-volatile particulate carbon that would partition to the gas phase at lower concentra-tions, and gaseous carbon adsorbed to the quartz filters. Each class might have very different light absorption, and rating them before analysis would be advisable. Such sepa-ration is difficult to combine with light absorption measure-ments, which require large samples. As we will show, visible
light absorption in our samples is largely attributable to non-volatile organic carbon, and our final results provide values for this carbon. In the following sections, we describe how we account for the other two types of carbon.
Values of α/ρ are underestimated if we do not account for semi-volatile and gaseous carbon. However, the under-estimates are in the same direction for all samples, and will affect absolute magnitudes but not comparisons. During the first portion of the discussion of results, we compare proper-ties of all collected carbon. Later, when providing absorption for use in models, we adjustα/ρ so that the values reflect only non-volatile organic carbon.
2.5.1 Adsorbed gaseous carbon
Two methods of estimating gaseous carbon adsorbed to the high-flow filter are possible.
1. We assume that the amount of organic vapors adsorbed on the quartz filter is constant regardless of flow rate. This would be true if the adsorption sites were saturated. The adsorbed vapor would be the same as on the low-flow backup filter, and Eq. (2) gives total carbon. This method gives a lower bound for the OC loading on the high-flow filters.
Cbefore extraction=CHF= CLF−CLFbackup
QHF
QLF
+CLFbackup (2)
2. We assume that the quantity of adsorbed organic vapors is proportional to the flow rate, and can be estimated by multiplying the low-flow backup filter by the ratio of the flow rates. Total carbon is then given by Eq. (3). This estimate gives an upper bound for the OC loading.
Cbefore extraction=CHF=CLF·
QHF QLF
(3)
Estimates of gaseous OC calculated by these two methods differ by 30±18%. In this paper, we use the first estimation method, so the particulate OC may be underestimated and the calculation may overestimate absorption per mass of extracts by about 15%. However, the overestimates are in the same direction for all samples; this will affect the absolute magni-tude of absorption, but not the comparison between extracts.
2.5.2 Semi-volatile organic carbon (SVOC)
0 100000 200000 300000 400000 500000 600000 700000
-2 -1 0 1 2 3 4 5
Orga
ni
c
m
as
s
(
m
g/
m
3)
log10C*(mg/m3) gas phase
particle phase
(a)
0.0 0.5 1.0 1.5 2.0 2.5 3.0
-2 -1 0 1 2 3 4 5
O
rga
ni
c
m
as
s
(
m
g/
m
3)
log10C*(mg/m3)
gas phase particle phase
(b)
0 100000 200000 300000 400000 500000 600000 700000
-2 -1 0 1 2 3 4 5
Or
gani
c
m
ass
(
m
g/m
3)
log10C*(mg/m3) gas phase
particle phase
(c)
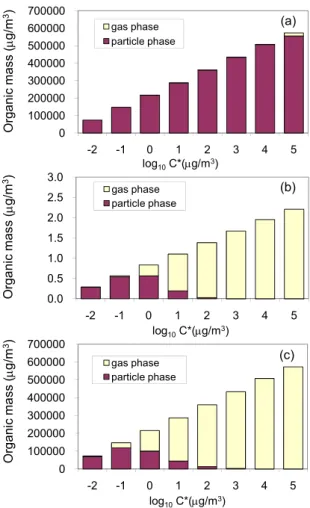
Fig. 3.SVOC partitioning.(a)Partitioning of original SVOC from wood combustion after 4:1 dilution (2.6×10⁶µg/m3, 298 K); (b) Partitioning of SVOC with the same volatility profile under ambient conditions (10 µg/m3, 298 K); (c)Partitioning of SVOC with the same volatility profile (2.6×10⁶µg/m3, 443 K).
to be treated separately in models. When providing quan-titative absorption for radiative transfer models, we will be mainly focusing on the absorption caused by non-volatile or-ganic carbon (NVOC). We must remove the contribution of SVOC from both absorbance and carbon mass, to obtain the absorption per mass of carbon by NVOC. We will discuss how we estimate the contribution of SVOC and NVOC in this section.
We use the volatility distribution model proposed in Don-ahue et al. (2006) in our evaluation of OC. The critical vari-able in the model is the saturation concentrationC∗ repre-senting the partitioning of OC in both particle phase and gaseous phase. We consider SVOC distribution with log spaced C∗ ranging from 0.01 µg/m3 to 100 000 µg/m3 at
300 K.
The fraction of compound i found in the particle phase can be described by partitioning coefficient, given an effective saturation concentration.
ξi=
1+ C
∗
i COA
−1
; COA=
X
i
Ciξi (4)
Where Ci is the organic compounds concentration in all
phases, COA is the total mass concentration of organic
aerosol.
Based on an averaged OC loading around 200 µg/cm2on
the quartz filter, with a thickness of 1mm and OM/OC ratio of 1.3, we roughly estimate the concentration of fresh organic carbon on the filter as 2.6×10⁶µg/m3. The theoretical parti-tioning of OC to the gas phase and particle phase under these conditions is shown in Fig. 3a.
If the material were diluted to achieve ambient conditions, with a total OC concentration around 10 µg/m3, the partition-ing of SVOCs in the two phases would be that in Fig. 3b.
As compounds are warmed, the equilibrium shifts. The saturation concentration for each log-spaced bin at an ele-vated temperatureT2 can be related to that at 300 K (sam-pling conditions) based on the Clausius-Clapeyron Equation.
Ci∗(T2)=Ci∗(300K)·exp
1H
v R
1
300K− 1
T2
(5) According to Donahue et al. (2006), we assume an1Hvfor
the compounds with saturation concentration of 1 µg/m3 as 100 kJ/mole, the factor of 10 spacing in saturation concentra-tion corresponds to a succession of enthalpies (1Hvap)
sepa-rated by 5.8 kJ/mole.
Figure 3c shows the equilibrium partitioning of OC on the filter at filter concentration and 443 K. In order to compare with the original ambient temperature, the x-axis is still the
C∗at 300 K, not at 443 K. The partitioning distribution under 443 K at filter concentration is comparable with that under ambient conditions and low concentrations.
2.6 Repeatability
2.7 Determination of absorption ˚Angstr¨om exponent ( ˚Aap)
Absorption ˚Angstr¨om exponent is a measure of the spectral dependence of aerosol light absorption, which is required for extrapolation of absorption coefficients that are obtained at a limited range of wavelengths. Sun et al. (2007) proposed band-gap and Urbach relationships to explain wavelength de-pendence. We believe those are more physical, but the atmo-spheric community is more familiar with ˚Aap, and we use
that measure here. It is defined as: ˚
Aap=
−ln(α (λ1)/α (λ2))
ln λ1λ2
(6)
In this work, we determined ˚Aapwith a linear regression of
ln (α/ρ)against ln (λ)through the valid wavelength range for each sample (0.02< A <1 andλ >300 nm).
2.8 Radiative impact
We use a variant of “simple forcing efficiency” defined by Bond and Bergstrom (2006) to provide a first estimate of the climatic impact of these particles. This value was origi-nally a manipulation of the Chylek and Wong (1995) equa-tion that normalizes impact by particle mass. A wavelength-dependent version that can be integrated to produce total forcing is:
dSFE
dλ = −
1 4
dS(λ)
dλ τ
2
atm(λ)(1−Fc)
h
2(1−as)2β(λ)·MSC(λ)−4as·MAC(λ)
i
(7) where SFE is the simple forcing efficiency (W/g),dS(λ)/dλ
is the solar irradiance, τatm is the atmospheric
transmis-sion (0.79), Fc is the cloud fraction (0.6), a is the surface
albedo (average 0.19),βis the backscatter fraction, and MSC and MAC are the mass scattering and absorption cross sec-tions per gram, respectively. Wavelength-dependent atmo-spheric transmission comes from the ASTM G173-03 Refer-ence Spectra.
Using the imaginary refractive indices derived in this pa-per, along with a fixed real refractive index of 1.55, we performed Mie calculations every 5 nm between 300 and 950 nm to provide mass scattering and absorption efficiencies and backscattering fractions. When measured data were not available due to instrumental detection limits, we extended the measured data with the Angstrom exponent relationship on the ultraviolet side, and a linear relationship on the vis-ible side. The linear extrapolation is not based on physical reasoning, but affects the forcing very little.
0.00 0.20 0.40 0.60 0.80 1.00
Total (18) 210°C (4) 270°C (9) 360°C (5)
Ex
tra
cte
d
fra
ctio
n
Combustion temperature acetone methanol water hexane
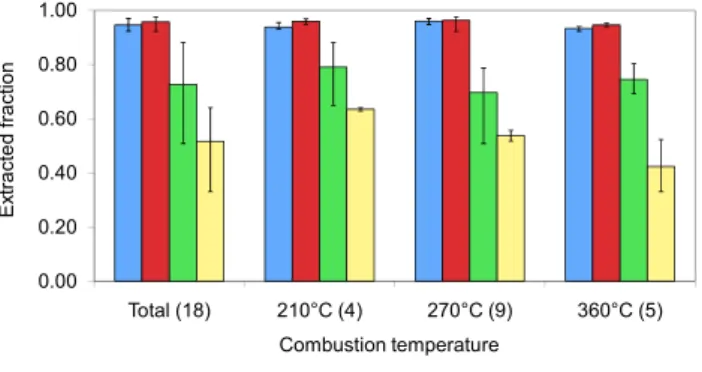
Fig. 4. Fraction of total OC extracted by different solvents. The numbers in the parentheses indicate the number of samples analyzed at each temperature. Methanol and water extraction were performed for all 18 samples, number of samples extracted by acetone and hexane: total: acetone (14), hexane (6); 210◦C: acetone (4), hexane (2); 270◦C: acetone (5), hexane (2); 360◦C: acetone (4), hexane
(3).
3 Results
3.1 Absorption by extracts in different organic solvents
Figure 4 illustrates the average fraction of OC extracted by four solvents. For every sample, the amount of OC extracted by solvents is acetone≈methanol>water>hexane. Acetone and methanol extract almost all the OC, from 92% to 98%. The fraction extracted by water and hexane varies from 51% to 88% with an average of 73% for water, and from 33% to 64% for hexane with an average of 52%. Our results for water-soluble fraction are consistent with highly variable previous results: 40–99% reported by Novakov and Cor-rigan (1996) for smoldering combustion, and 41–74% ob-served by Graham et al. (2002) in biomass burning aerosols. Because of the high extractable fraction (greater than 92%, for these samples), we consider absorption by methanol ex-tracts to represent the behavior of total OC.
Figure 4 also shows extracted fractions at different gener-ation temperatures. The OC fraction extracted by acetone, methanol and water does not change much with temperature. However, the fraction extracted by hexane decreases when generation temperature increases (p=0.06); average fractions are 63%, 54% and 42% at 210◦C, 270◦C and 360◦C respec-tively. OC from oak has an 11% higher fraction of water-soluble substances than from pine (p=0.04), not separated in Fig. 4). No obvious trend of extractable fraction with wood size was found for methanol and acetone. However, water usually extracts a higher fraction of OC for samples from smaller wood.
Table 2.Ratios of absorbance A and absorption per massα/ρbetween water extracts and methanol extracts for pine M samples generated at 210◦C, 270◦C and 360◦C. (data are not available at 380nm for 210◦C and 270◦C samples, because at 380 nm absorbance A is greater than 1).
Ratio ofA(water/methanol) Ratio ofα/ρ(water/methanol)
380 nm 400 nm 450 nm 500 nm 380 nm 400 nm 450 nm 500 nm
210◦C – 0.63 0.44 0.38 – 0.70 0.48 0.42
270◦C – 0.29 0.17 0.14 – 0.43 0.25 0.21
360◦C 0.25 0.19 0.13 0.14 0.32 0.24 0.17 0.18
0 5000 10000 15000 20000 25000
360 380 400 420 440 460 480 500 520 540 560 580 600
Ab
sorp
tio
n
pe
r ma
ss
of
ca
rbo
n
a/
r
(c
m
2/g
)
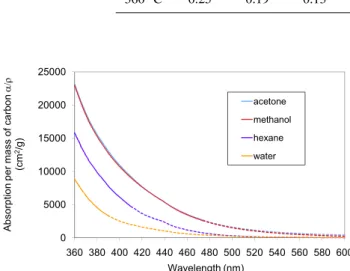
Wavelength (nm) acetone methanol hexane water
Fig. 5.Typical absorption spectrum for pine L generated at 360◦C.
(Dashed lines indicate data below the instrument detection limit).
higher than those of water and hexane extracts. All the ex-tracts appeared yellow, with absorption both at UV and visi-ble ranges, and increasing absorption with decreasing wave-length. Brown to yellowish organic carbon was also ob-served from smoldering combustion by Patterson and McMa-hon (1984) and from coal combustion by Bond (2001).
Methanol and acetone extracts have the same α/ρ (ab-sorption per mass) within measurement error. Kirchstetter et al. (2004) thought that OC not soluble in acetone might con-tribute some amount of absorption, but their samples were not pure OC. In our samples, most OC is soluble in acetone and no colored residue is observed.
Light absorption by organic carbon soluble in water and hexane is always smaller than that dissolved in methanol and acetone. Table 2 compares water extracts and methanol ex-tracts for one size pine wood (pine M). Other samples have similar trends. First, we compare total absorbance (A); this ratio indicates how much of the total absorption is extracted in water. The contribution of water-soluble OC is greater at shorter wavelengths, and this relationship is monotonic. Absorption per mass (α/ρ indicates the light-absorbing na-ture of the OC in different extracts. Normalized absorption for water-soluble OC is 76% lower than that for total OC at 400 nm for sample generated at 360◦C, although this com-parison varies with wavelengths and generation conditions,
which means that water-soluble OC is much less light ab-sorbing than the total OC. In the comparison ofα/ρ, water-soluble OC contributes less as temperatures increase.
Absorption of hexane extracts, which should contain non-polar OC, was also lower than that of methanol extract. For 210◦C samples,α/ρof hexane extracts was smaller or equal to that of water extract. When generation temperature in-creased,α/ρ of the hexane extracts also increased, and be-came greater than that of water extract, but still lower than that of methanol extract (e.g., averaged approximate 65% for oak M 360).
In sections that follow, we will investigate the effect of temperature and wood characteristics. For these discussions, we will use methanol extracts since they represent the total carbon, and water soluble OC since it is important for hygro-scopic properties of OC.
Theα/ρvalues presented here imply that the absorption of the methanol extracts comes from at least two types of OC: a less-absorbing, water-soluble OC, and a water-insoluble OC which has even higher absorption than the methanol extracts. In order to confirm this hypothesis, sequential extraction tests were conducted for two samples (oak M 270, oak L 360). A punch of filter was first extracted by water using the method described in Sect. 2.3, and the residual filter was extracted again by methanol after drying. Figure 6 shows spectra for one of these samples; the other produced similar results. OC extracted by methanol after water extraction was 18% of the total OC, but this small portion contributed 35–45% of the total absorbance, or 1–3 times that of the water extract, de-pending on the wavelength. Therefore,α/ρ or this fraction of OC was much higher than those of methanol and water extracts. By performing another water-hexane sequential ex-traction, we found that the residual after water extraction was partially soluble in hexane (60%), while the remaining 40% could be extracted only by methanol. Moreover, the water-insoluble but hexane-soluble part accounted for only 6% of the total absorbance. Therefore, we believe that the strongly light absorbing components are only extractable in methanol (not in either water or hexane).
0.0 0.1 0.2 0.3 0.4
0.5
360 380 400 420 440 460 480 500 520 540 560 580 600
Abs
orb
an
ce
A
Wavelength (nm) methanol water
methanol after water water + methanol after water
(a)
0
5000 10000 15000 20000 25000 30000 35000
360 380 400 420 440 460 480 500 520 540 560 580 600
a
/r
(cm
2/g
)
Wavelength (nm) methanol water
methanol after water
(b)
Fig. 6. (a) Spectra of absorbance and (b) absorption per mass for sample oak M 270, of methanol extract, water extract, and methanol extract after water extraction. Note that there is no “wa-ter+methanol after water” curve in figure (b) because the normal-ized absorption (i.e. absorption per mass of carbon) is not additive, while absorbance is.
with methanol and redissolved the materials in water. 5% methanol was added with the water to aid dissolution. The visible absorption was about 10–20% higher in water, so the finding that methanol-soluble material has higher absorption is valid regardless of solvent. In this paper, we provide the absorption data from methanol extracts without correction for this solvent effect.
3.2 Effect of pyrolysis temperature
In this paper, we investigated three different pyrolysis tem-peratures: 210◦C, 270◦C and 360◦C. Actual temperature varied 20◦C from the nominal temperatures. Figure 7 shows the change in α/ρ with temperature for oak M; pine and other wood sizes exhibited similar trends. For medium-sized wood, an increase from 210◦C to 360◦C results in a con-siderable increase of α/ρ, approximately a factor of 9 for pine M (averaged from 390 nm to 470 nm) and 7 times for oak M (averaged from 390 nm to 460 nm). For large wood, a slight difference was observed between 210◦C and 270◦C samples, while samples at 360◦C have much higherα/ρ val-ues (not shown in Fig. 7). Forα/ρvalues for WSOC followed the same temperature dependent trends as total OC, but the absolute values ofα/ρ were lower. In summary, when we increased pyrolysis temperature,α/ρincreased.
0 5000 10000 15000 20000 25000
360 380 400420 440460 480 500 520 540 560 580 600
a
/r
(cm
2/g)
Wavelength (nm) 360°C 270°C 210°C
Fig. 7.Generation temperature dependence of absorption per mass (α/ρ) of methanol extracts (medium size oak wood).
0 5000 10000 15000 20000
360 380 400 420 440 460 480 500 520 540 560 580 600
a
/r
(cm
2/g
)
Wavelength (nm) Oak Large Pine Large Oak Medium Pine Medium
(a)
0 5000 10000 15000 20000 25000
360 380 400 420 440 460 480 500 520 540 560 580 600
a
/r
(cm
2/g)
Wavelength (nm) Oak Large Pine Large Oak Medium Pine Medium
(b)
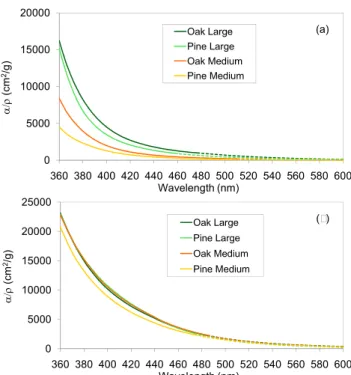
Fig. 8.Effect of wood type and size on absorption per mass (α/ρ) of methanol extracts.(a)210◦C,(b)360◦C (note the scale change for two figures).
3.3 Effect of wood type
Figure 8 illustrates the variation ofα/ρ values for methanol extracts with varying wood type and size, when tempera-ture is held constant. At 210◦C, wood size and type affect the absorption of OC generated, while at high temperature (360◦C), the discrepancy is within the uncertainty range. Re-sults at 270◦C are similar to those at 210◦C.
0 2000 4000 6000 8000 10000 12000
6 7 8 9 10 11 12
a
/r
a
t
40
0n
m
(
cm
2/g)
Absorption Ångström Exponent (380-460nm) 210C 270C 360C
Fig. 9.Aap˚ (from 380 nm to 460 nm) vs.α/ρat 400 nm of methanol extracts.
small size at 270◦C. Since all other variables are the same, this discrepancy must be caused by a difference in wood type, and many such differences have been reported (Rogge et al., 1998; McDonald et al., 2000). Schauer et al. (2001) reported higher resin acids and substituted guaiacol emissions in pine combustion than in oak combustion, while substituted sy-ringol compounds absent from pine combustion were found in oak combustion.
Despite the differences resulting from wood type, the larger difference is caused by generation temperature.
3.4 Effect of wood size
During wood pyrolysis, devolatilizing material travels along the wood grain in the absence of fissures and eventually es-capes to the ambient air. Thus, the length along the grain governs the residence time of OC precursors inside the wood, and that residence time is larger in longer wood. On the other hand, the smallest cross-sectional area governs the rate of heat transfer into the wood, so medium and large wood are heated at approximately the same rates. In our study, M wood is a cube, and L wood has the same cross-section but is three times longer along the grain. S wood has the same length along the grain as M wood, but its cross-section is three times smaller. Figure 8 shows the dependence of
α/ρ on wood size at different temperatures. For samples at lower temperatures, larger wood results in a higher absorp-tion. We hypothesize that the longer residence time in the large wood allows polymerization which results in greater absorption per mass. At higher temperatures, that polymer-ization takes place even without the increased residence time. In summary, our results show that absorption change is generally monotonic across the spectrum. If absorption in-creases, an increase occurs at all wavelengths, although the fractional change may not be the same across the spec-trum. Increasing wood temperature leads to higher absorp-tion. We hypothesize that this results from polymerization of the volatile matter before it exits the wood. Wood type has a smaller effect on absorption. Pine emissions have lower
absorption than oak at the intermediate temperature, but at the higher temperature the absorption is identical. We sug-gest that similar transitions lead to thermal decomposition of wood, that one of these includes polymerization and that it occurs at a lower temperature in oak than in pine. The reac-tions that increase absorption are temperature-dependent, but residence time within the wood – which we alter by changing wood size – can make up for temperature, to some extent.
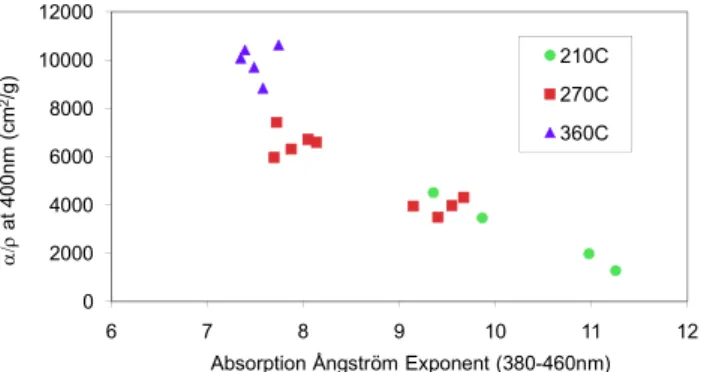
3.5 Absorption ˚Angstr¨om exponent ( ˚Aap)
It has become accepted that OC absorption has stronger spec-tral dependence than that of BC (Patterson and McMahon, 1984; Bond, 2001; Kirchstetter et al., 2004; Schnaiter et al., 2006). In this work, values of ˚Aapof methanol extracts,
rang-ing from 6.9 to 11.4, are shown in Table 1 and Fig. 9 (R2
ranges from 0.989 to 1.000). This is much higher than the values reported by Kirchstetter et al. (2004) for mixed black and organic carbon in biomass smoke aerosol, but similar to that reported by Schnaiter et al. (2006) for organic carbon formed in propane combustion with C/O ratio of 0.61.
˚
Aap tends to decrease when generation temperature
in-creases. ˚Aap of samples from pine smoldering is slightly,
but not significantly, higher than that from oak. We can infer that higher ˚Aapvalues are associated with weakly absorbing
particles, which is consistent with real-time results in Roden et al. (2006). Using a dividing point of 400 nm, we also cal-culate ˚Aap for the ultraviolet and visible ranges separately.
˚
Aapat UV range is 0.95–1.3 times of that at the whole
UV-vis range, from 6.6 to 14.3. For all but the samples by large wood at 360◦C, ˚A
apis higher in the UV range.
We also calculated ˚Aapof water extracts in the valid
wave-length range (Table 1). Because of the lower absorbance of water extracts, for some samples, data were only valid in the UV range (λ <400 nm). Water extracts had much higher ˚Aap
than methanol extracts, ranging from 8.6 to 17.8, although they exhibited similar dependence on wood size and temper-ature as methanol extracts. Compared with other samples, 4 samples generated at 360◦C showed much lower ˚A
apfor
water extracts.
4 Discussion
4.1 Nature of light absorbing OC
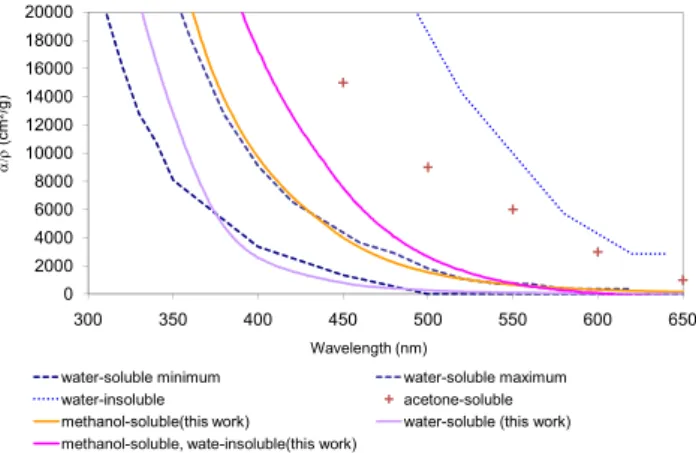
Our results lend further support to this hypothesis. Al-though water-soluble organic carbon from wood combus-tion absorbs some visible light, a large fraccombus-tion of absorp-tion is caused by organic carbon that is not water-soluble but is extractable by methanol or acetone. Figure 10 com-pares our results for the sequentially-extracted filters with the data tabulated by Sun et al. (2007). Ranges for water-soluble aerosols are marked “water-water-soluble minimum and water-soluble maximum” and “water-insoluble”. The UV absorption of water-soluble OC lies between the ranges pro-vided by Sun et al. (2007), while the visible absorption of that OC is lower than the minimum values tabulated in that work. Our samples were collected at the source, while the other tabulation examined atmospheric aerosol. Water-solubility might develop after oxidation in the atmosphere. Our data confirm that water-insoluble, more-absorbing OC exists, but our measured absorption is not as strong as that suggested by other measurements.
Large molecular PAHs (Kilbane II, 1998; Stovall et al., 2005) might be candidate compounds to represent the more-absorbing OC, but those would be extractable in hexane. We hypothesize that the higher absorption comes from large, po-lar molecules which contain conjugated aromatic rings sim-ilar to PAHs, but that these rings are also directly attached to polar functional groups such as oxygen or nitrogen. Such complex molecules have been widely reported as products from biomass combustion at both flaming and smoldering conditions (e.g., Evans and Milne, 1986; Rogge et al., 1998; Schauer et al., 2001; Fitzpatrick et al., 2007; Weimer et al., 2008). Compared to small organic compounds, these molecules have more aromatic rings, (i.e. a higher degree of conjugation), which makes the absorption increase and shift to longer wavelengths (Apicella et al., 2004). Quinoid compounds are strong candidates for such compounds (Del Vecchio and Blough, 2004; Sun et al., 2007). PAH com-pounds were hexane-extractable while quinones could not be extracted by hexane but only by methanol (Xia et al., 2004; Shima et al., 2006). These substances might be detected in methods designed to isolate humic-like substances (HULIS; Graber and Rudich, 2006).
These complex molecules are formed by polymerization of the low molecular weight fragments during wood pyrol-ysis. Increased temperature enhances this polymerization, forming larger molecules with higher absorption per mass. Evans and Milne (1986) reported the formation of more polynuclear aromatics with increasing temperature. Oxy-genated PAHs increased with temperature during the com-bustion of pine wood (Fitzpatrick et al., 2007).
0 2000 4000 6000 8000 10000 12000 14000 16000 18000 20000
300 350 400 450 500 550 600 650
a/r
(
cm
2/g)
Wavelength (nm)
water-soluble minimum water-soluble maximum
water-insoluble acetone-soluble
methanol-soluble(this work) water-soluble (this work)
methanol-soluble, wate-insoluble(this work)
Fig. 10. Comparison with other results, generation condition: oak L 360. Range for water-soluble aerosol, and an estimate for water-insoluble aerosol, are taken from Sun et al. (2007). “Acetone-soluble” is taken from Kirchstetter et al. (2004).
4.2 Semivolatile organic carbon contribution
Earlier, we commented that semivolatile organic carbon would increase the filter loading of carbon, and that this would decrease apparent values ofα/ρ. Until this point, we have given values ofα/ρ for the combined semi- and non-volatile organic carbon, and this was sufficient to discuss comparisons between pyrolysis conditions. Immediately fol-lowing the present discussion, we will provide data suitable for radiative-transfer models. For this purpose, SVOC should be separated from NVOC.
As discussed in Sect. 2.5.2, we estimate the contribution of SVOC mass and absorption by heating filters in the OC/EC analyzer at 170◦C. This temperature roughly reproduces at-mospheric partitioning but does not cause charring of OC. New samples were generated at all three pyrolysis tempera-tures, with the aim of determining the fraction of absorbance and OC mass contributed by NVOC. We analyzed OC con-centration and bulk liquid absorbance for both original filters (TOC) and heated filters (NVOC). The difference between these two is the contribution of SVOC.
0 5000 10000 15000 20000 25000 30000 35000
360 380 400 420 440 460 480 500 520 540 560 580 600 Wavelength (nm) A b s o rp ti o n p e r m a s s o f c a rb o nα /ρ a ft e r S V O C c o rre c ti o n (c m 2/g ) 210°C 270°C 360°C 0 1000 2000 3000 4000 5000 6000
460 480 500 520 540 560
Fig. 11.Averaged absorption per mass of carbonα/ρafter correc-tion for SVOC. Dashed lines with the same color indicate upper and lower range.
contribute to the visible absorption, although this question requires further study.
We use the amount of OC retained after 170◦C heating to indicate the mass of NVOC. The averaged mass ratio of NVOC / TOC is 0.56, 0.69 and 0.61 for samples generated at 210◦C, 270◦C and 360◦C respectively.
We adjusted the absorption per mass at UV wavelengths using the temperature-specific results for NVOC absorbance and carbon, thereby correcting the value ofα/ρ. This is our best guess of values to be used for OC properties in radiative-transfer models. Figure 11 shows the average and standard deviation ofα/ρ at each generation temperature. The de-pendence of absorption on generation temperature is appar-ent even when variation due to wood types and size is in-cluded. Samples generated at lower temperatures have a larger variation due to the effect of wood size and wood type, while at high temperature wood size and wood type have little effect on absorption. The ratio between high-temperature and low-high-temperature absorption is about 4 at vis-ible wavelengths (400–550 nm) and somewhat lower at ultra-violet wavelengths.
The SVOC correction will not change our previous con-clusion that methanol-extractable material has higher absorp-tion than water-extractable material. To negate this conclu-sion, water-extractable SVOC would have to contribute 60% of the total OC, which was not observed. Furthermore, as a general rule, lower volatility aerosol has lower water solu-bility (Schwarzenbach et al., 2003), which means that water actually extracts less SVOC than methanol does.
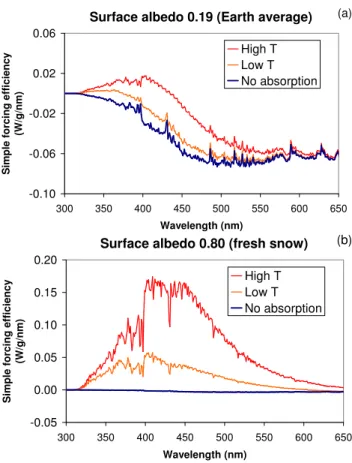
4.3 Radiative implications
As discussed in Sect. 2.8, we use a simple model to provide a first estimate of these absorbing particles’ climatic impact. We use this model with material generated at both high and low temperatures, as well as non-absorbing particles
(imagi-Surface albedo 0.19 (Earth average)
-0.10 -0.06 -0.02 0.02 0.06
300 350 400 450 500 550 600 650
Wavelength (nm) S im p le f o rc in g e ff ic ie n c y (W /g /n m ) High T Low T No absorption (a)
Surface albedo 0.80 (fresh snow)
-0.05 0.00 0.05 0.10 0.15 0.20
300 350 400 450 500 550 600 650
Wavelength (nm) S im p le f o rc in g e ff ic ie n c y (W /g /n m ) High T Low T No absorption (b)
Fig. 12. Simple forcing efficiency of particles above an average albedo(a)and snow(b). Integrated forcing for average and snow albedo, respectively: HighT,−12 and 23 W/g LowT,−16 and 6.3 W/g; no absorption:−18 and−0.92 W/g.
nary refractive index 0.0001). In our model, real refractive index is held constant at 1.55, and surface albedo is held constant at the values shown in the figure. Mie simulations assumed a count median diameter of 150 nm and a geomet-ric standard deviation of 1.5, similar to observations of fresh aerosol in our laboratory.
Figure 12a shows forcing at each wavelength for a sur-face albedo of 0.19. Integrated forcing from 300 to 950 nm is −12 W/g for particles from high-temperature burning,
Figure 12b repeats the calculation for particles over a bright surface. Forcing integrated over the solar spectrum is 23 W/g for the high-temperature particles, 6.3 W/g for the low temperature particles; and−0.92 W/g for the particles with no absorption. The contribution of absorbing organic material could be important in energy balances over bright surfaces. Global average radiative forcing of absorbing OC, considering its location above and below clouds and relative to bright surfaces, should be assessed with a general circula-tion model.
4.4 Effect of UV absorption on tropospheric photochemistry
The absorption of UV light by OC may influence photolysis-driven chemistry in the troposphere. Although this is not a focus of our study, we briefly discuss the potential impact. Jacobson (1998) investigated the effect of absorbing aerosols on photolysis ratio coefficient and ozone mixing ratio with the GATORM model, by applying the refractive index of liquid nitrobenzene as a surrogate in model simulations. It was concluded that absorbing organic aerosols may cause the reduction in UV photolysis coefficients, resulting in up to 5–8% decrease in near-surface ozone mixing ratio during the Southern California Air Quality Study period. The UV absorption of OC obtained from our samples generated at 360◦C is lower than that in the Jacobson (1998) study by 30–40%, depending on wavelength. It can be inferred that the significant UV absorption by total OC from wood pyrol-ysis could affect photolpyrol-ysis rates and thus ozone mixing ratio by a few percent.
5 Summary
We measured light absorption of organic carbon generated in a laboratory combustor at different temperatures, wood types, and wood sizes. We provide estimates for the absorp-tion per mass of carbon contributed by NVOC at varying gen-eration temperatures. The main points of this manuscript are summarized below.
– Solid-fuel combustion produces yellow or brown car-bon. Absorption increases as wavelength decreases.
– Methanol extracts almost all of the total organic carbon, while the portion of water soluble organic carbon is 51– 88% and depends on generation temperature.
– Water-soluble OC absorbs some light. However, a large fraction of the absorbing part is water-insoluble, but ex-tractable by methanol, and this material has greater sorption per mass. We hypothesize that the high ab-sorption comes from large containing both conjugated aromatic rings and functional groups.
– Increasing generation temperature and, possibly, longer residence time in the wood produce higher absorption. Wood type has a smaller effect on absorption.
Acknowledgements. This project is supported by the National Science Foundation’s Atmospheric Chemistry Program under grant #ATM-0349292 Program.
Edited by: V. F. McNeill
References
Andreae, M. O., Andreae, T. W., Annegarn, H., Beer, J., Cachier, H., Le Canut, P., Elbert, W., Maenhaut, W., Salma, I., Wienhold, F. G., and Zenker, T.: Airborne studies of aerosol emissions from savanna fires in southern Africa: 2. Aerosol chemical composi-tion, J. Geophys. Res., 103, 32119–32128, 1998.
Andreae, M. O. and Gelencs´er, A.: Black carbon or brown car-bon? The nature of light-absorbing carbonaceous aerosols, At-mos. Chem. Phys., 6, 3131–3148, 2006,
http://www.atmos-chem-phys.net/6/3131/2006/.
Anderson, T. L., Charlson, R. J., Schwartz, S. E., Knutti, R., Boucher, O., Rodhe, H., Heintzenberg, J.: Climate forcing by aerosols – a hazy picture, Science, 300, 1103–1104, 2003. Antal Jr., M. J. and Varhegyi, G.: Cellulose pyrolysis kinetics: the
current state of knowledge, Ind. Eng. Chem. Res., 34, 703–717, 1995.
Apicella, B., Alfe, M., Barbella, R., Tegrossi, A., and Ciajolo, A.: Aromatic structures of carbonaceous materials and soot inferred by spectroscopic analysis, Carbon, 42, 1583–1589, 2004. Bergstrom, R. W., Pilewskie, P., Russell, P. B., Redemann, J., Bond,
T. C., Quinn, P. K., and Sierau, B.: Spectral absorption proper-ties of atmospheric aerosols, Atmos. Chem. Phys., 7, 5937–5943, 2007,
http://www.atmos-chem-phys.net/7/5937/2007/.
Bond, T. C.: Spectral dependence of visible light absorption by carbonaceous particles emitted from coal combustion, Geophys. Res. Lett., 28, 4075–4078, 2001.
Bond, T. C., Streets, D. G., Yarber, K. F., Nelson, S. M., Woo, J., and Klinont, Z.: A technology-based global inventory of black and organic carbon emissions from combustion, J. Geo-phys. Res., 109, D14203, doi:10.1029/2003JD003697, 2004. Bond, T. C. and Bergstrom, R. W.: Light absorption by
carbona-ceous particles: an investigative review, Aerosol Sci. Technol., 40, 27–67, 2006.
Bryden, K. M., Ragland, K. W., and Rutland, C. J.: Modeling ther-mally thick pyrolysis of wood, Biomass Bioenerg., 22, 41–53, 2002.
Chung, S. H. and Seinfeld, J. H.: Global distribution and climate forcing of carbonaceous aerosols, J. Geophys. Res., 107(D19), 4407, doi:10.1029/2001JD001397, 2002.
Chylek, P. and Wong, J.: Effect of absorbing aerosol on global ra-diation budget, Geophys. Res. Lett., 22, 929–931, 1995. Cooke, W. F., Liousse, C., Cachier, H., and Feichter, J.:
Del Vecchio, R. and Blough, N. V.: On the origin of the opti-cal properties of humic substances, Environ. Sci. Technol., 38, 3885–3891, 2004.
Donahue, N. M., Robinson, A. L., Stanier, C. O., and Pandis, S. N.: Coupled partitioning, dilution, and chemical aging of semivolatile organics, Environ. Sci. Technol., 40, 2635–2643, 2006.
Evans, R. J. and Milne, T. A.: Molecular characterization of the pyrolysis of biomass, 1. Fundamentals, Energy and Fuel, 1, 123– 137, 1986.
Ferek, R. J., Reid, J. S., Hobbs, P. V., Blake, D. R., and Liousse, C.: Emission factors of hydrocarbons, trace gases and particles from biomass burning in Brazil, J. Geophys. Res., 103, 32107–32118, 1998.
Fitzpatrick, E. M., Ross, A. B., Bates, J., Andrews, G., Jones, J. M., Phylaktou, H., Pourkashanian M., and Willams, A.: Emission of oxygenated species from the combustion of pine wood and its relation to soot formation, Process Saf. Environ. Protect., 85(B5), 430–440, 2007.
Gabriel, R., Mayol-Bracero, O. L., and Andreae, M. O.: Chem-ical characterization of submicron aerosol particles collected over the Indian Ocean, J. Geophys. Res., 107(D19), 8005, doi:10.1029/2000JD000034, 2002.
Graber, E. R. and Rudich, Y.: Atmospheric HULIS: How humic-like are they? A comprehensive and critical review, Atmos. Chem. Phys., 6, 729–753, 2006,
http://www.atmos-chem-phys.net/6/729/2006/.
Graham, B., Mayol-Bracero, O. L., Guyon, P., Roberts, G. C., Decesari, S., Facchini, M. C., Artaxo, P., Maenhaut, W., Koll, P., and Andreae, M. O.: Water-soluble organic compounds in biomass burning aerosols over Amazonia 1. Characteriza-tion by NMR and GC-MS, J. Geophys. Res., 107(D20), 8047, doi:10.1029/2001JD000336, 2002.
Havers, A., Burba, P., Lambert, J., and Klockow, D.: Spectroscopic characterization of humic-like substances in airborne particulate matter, J. Atmos. Chem., 29, 45–54, 1998.
He, K., Yang, F., Ma, Y., Zhang, Q., Yao, X., Chan, C., Cadle, S., Chan, T., and Mulawa, P.: The characteristics of PM2.5 in Beijing, China, Atmos. Environ., 35, 4959–4970, 2001. Hoffer, A., Gelencs´er, A., Guyon, P., Kiss, G., Schmid, O., Frank,
G. P., Artaxo, P., and Andreae, M. O.: Optical properties of humic-like substances (HULIS) in biomass-burning aerosols, At-mos. Chem. Phys., 6, 3563–3570, 2006,
http://www.atmos-chem-phys.net/6/3563/2006/.
Husain, L., Dutkiewicz, V. A., Khan, A. J., Chin, M., and Ghauri, B. M.: Characterization of carbonaceous aerosols in urban air, Atmos. Envrion., 41, 6872–6883, 2007.
Intergovernmental Panel on Climate Change (IPCC): IPCC Fourth Assessment Report, Working Group I Report “The Physical Sci-ence Basis”, http://www.ipcc.ch, 2007.
Jacobson, M. Z.: Studying the effects of aerosols on vertical pho-tolysis rate coefficient and temperature profiles over and urban airshed, J. Geophys. Res., 103, 10593–10604, 1998.
Johnson, K. S., de Foy, B., Zuberi, B., Molina, L. T., Molina, M. J., Xie, Y., Laskin, A., and Shutthanandan, V.: Aerosol composi-tion and source apporcomposi-tionment in the Mexico City Metropolitan Area with PIXE/PESA/STIM and multivariate analysis, Atmos. Chem. Phys., 6, 4591-4600, 2006,
http://www.atmos-chem-phys.net/6/4591/2006/.
Kilbane II, J. J.: Extractability and subsequent biodegreadation of PAHs from contaminated soil, Water, Air, Soil Pollut., 104, 285– 304, 1998.
Kirchstetter, T. W., Corrigan, C. E., and Novakov, T.: Labora-tory and field investigation of the adsorption of gaseous organic compounds onto quartz filters, Atmos. Environ., 35, 1663–1671, 2001
Kirchstetter, T. W., Novakov, T., and Hobbs, P. V.: Evidence that the spectral dependence of light absorption by aerosols is affected by organic carbon, J. Geophys. Res., 109, D21208, doi:10.1029/2004JD004999, 2004.
Krecl, P., Str¨om, J., and Johansson, C.: Carbon content of atmo-spheric aerosols in a residential area during the wood combustion season in Sweden, Atmos. Environ., 41, 6974–6985, 2007. Liousse, C., Penner, J. E., Chuang, C., Walton, J. J., Eddleman,
H., and Cachier, H.: A global three-dimensional model study of carbonaceous aerosols, J. Geophys. Res., 101, 19411–19432, 1996.
Mader, B. T., Flagan, R. C., and Seinfeld, J. H.: Airborne measure-ments of atmospheric carbonaceous aerosols during ACE-Asia, J. Geophys. Res., 107(D23), 4704, doi:10.1029/2002JD002221, 2002.
McComiskey, A., Schwartz, S. E., Schmid, B., Guan, H., Lewis, E. R., Ricchiazzi, P., and Ogren, J. A.: Direct aerosol forcing: Cal-culation from observables and sensitivities to inputs, J. Geophys. Res., 113, D09202, doi:10.1029/2007JD009170, 2008.
McDonald, J. D., Zielinska, B., Fujita, E. M., Sagebiel, J. C., Chow, J. C., and Watson, J. G.: Fine particle and gaseous emission rates from residential wood combustion, Environ. Sci. Technol., 34, 2080–2091, 2000.
McDow, S. R. and Huntzicker, J. J.: Vapor adsorption artifact in the sampling of organic aerosol: face velocity effects, Atmos. Environ., 24A, 2563–2571, 1990.
Meng, Z. Y., Jiang, X. M., Yan, P., Lin, W. L., Zhang, H. D., and Wang, Y.: Characteristics and sources of PM2.5 and carbona-ceous species during winter in Taiyuan, China, Atmos. Environ., 41, 6901–6908, 2007.
Moln´ar, A., M´esz´aros, E., Hansson, H. C., Karlsson, H., Gelencs´er, A., Kiss, G., and Kriv´acsy, Z.: The importance of organic and el-emental carbon in the fine atmospheric aerosol particles, Atmos. Envrion., 33, 2745–2750, 1999.
Murphy, D. M., Cziczo, D. J., Froyd, K. D., Hudson, P. K., Matthew, B. M., Middlebrook, A. M., Peltier, R. E., Sullivan, A., Thomson, D. S., and Weber, R. J.: Single-particle mass spectrometry of tropospheric aerosol particles, J. Geophys. Res., 111, D23S32, doi:10.1029/2006JD007340, 2006.
Novakov, T. and Corrigan, C. E.: Cloud condensation nucleus activ-ity of the organic component of biomass smoke particles, Geo-phys. Res. Lett., 23, 2141–2144, 1996.
Patterson, E. M. and McMahon, C. K.: Absorption characteristics of forest fire particulate matter, Atmos. Environ., 11, 2541–2551, 1984.
Polidori, A. P., Turpin, B. J., Davidson C. I., Rodenburg, L. A., and Maimone, F.: Organic PM2.5: fractionation by polarity, FTIR spectroscopy, and OM/OC ratio for the Pittsburgh aerosol, Aerosol Sci. Technol., 42, 233–246, 2008.
P¨oschl, U.: Aerosol particle analysis: challenges and progress, Anal. Bioanal. Chem., 375, 30–32, 2003.
types over the Australian continent, Atmos. Chem. Phys., 9, 1943–1956, 2009,
http://www.atmos-chem-phys.net/9/1943/2009/.
Quinn, P. K. and Bates, T. S.: North American, Asian, and Indian haze: Similar regional impacts on climate?, Geophys. Res. Lett., 30, 1555, doi:10.1029/2003GL016934, 2003.
Quinn, P. K. and Bates, T. S.: Regional aerosol properties: com-parison of boundary layer measurements from ACE1, ACE2, Aerosols99, INDOEX, ACE Asia, TARFOX, and NEAQS, J. Geophys. Res., 110, D14202, doi:10.1029/2004JD004755, 2005. Reichardt, C.: Solvents and solvent effects in organic chemistry, Wiley-VCH Verlag GmbH & Co. KGaA, Weinheim, Germany, 2003.
Reid, J. S., Koppmann, R., Eck, T. F., and Eleuterio, D. P.: A review of biomass burning emissions part II: intensive physical proper-ties of biomass burning particles, Atmos. Chem. Phys., 5, 799– 825, 2005,
http://www.atmos-chem-phys.net/5/799/2005/.
Robinson, A. L., Donahue, N. M., Shrivastava, M. K., Weitkamp, E. A., Sage, A. M., Grieshop, A. P., Lane, T. E., Pierce, J. R., and Pandis, S. N.: Rethinking organic aerosols: semivolatile emis-sions and photochemical aging, Science, 315, 1259–1262, 2007. Roden, C. A., Bond, T. C., Conway, S., and Pinel, A.: Emission Factors and real-time optical properties of particles emitted from traditional wood burning cookstoves, Environ. Sci. Technol., 40, 6750–6757, 2006.
Roden, C. A., Bond, T. C., Conway, S., Pinel, A., MacCarty, N., and Still, D.: Laboratory and field investigations of particulate and carbon monoxide emissions from traditional and improved cookstoves, Atmos. Environ., 43, 1170–1181, 2009.
Rogge, W. F., Hildemann, L. M., Mazurek, M. A., and Cass, G. R.: sources of fine organic aerosol, 9. Pine, oak, and synthetic log combustion in residential fireplaces, Environ. Sci. Technol., 32, 13–22, 1998.
Schauer, J. J., Kleeman, M. J., Cass, G. R., and Simoneit, B. R. T.: Measurement of emissions from air pollution sources, 3. C1–C29 organic compound from fireplace combustion of wood, Environ. Sci. Technol., 35, 1716–1728, 2001.
Schnaiter, M., Gimmler, M., Llamas, I., Linke, C., J¨ager, C., and Mutschke, H.: Strong spectral dependence of light absorption by organic carbon particles formed by propane combustion, Atmos. Chem. Phys., 6, 2981–2990, 2006,
http://www.atmos-chem-phys.net/6/2981/2006/.
Schulz, M., Textor, C., Kinne, S., Balkanski, Y., Bauer, S., Berntsen, T., Berglen, T., Boucher, O., Dentener, F., Guibert, S., Isaksen, I. S. A., Iversen, T., Koch, D., Kirkev˚ag, A., Liu, X., Montanaro, V., Myhre, G., Penner, J. E., Pitari, G., Reddy,
S., Seland, Ø., Stier, P., and Takemura, T.: Radiative forc-ing by aerosols as derived from the AeroCom present-day and pre-industrial simulations, Atmos. Chem. Phys., 6, 5225–5246, 2006,
http://www.atmos-chem-phys.net/6/5225/2006/.
Schwarzenbach, R. P., Gschwend, P. M., and Imboden, D. M.: En-vironmental organic chemistry, John Wiley & Sons, Inc., New Jersey, USA, 2003.
Shafizadeh, F.: Introduction to pyrolysis of biomass, J. Anal. Appl. Pyrol., 3, 283–305, 1982.
Shima, H., Koike, E., Shinohara, R., and Kobayashi, T.: Oxida-tive ability and toxicity of n-hexane insoluble fraction of diesel exhaust particles, Toxicol. Sci., 91, 218–226, 2006.
Shrivastava, M. K., Lipsky, E. M., Stanier, C. O., and Robinson, A. L.: Modeling semivolatile organic aerosol mass emissions from combustion systems, Environ. Sci. Technol., 40, 2671– 2677, 2006.
Stovall D. M., Hoover, K. R., Acree, J. W. E., and Abraham, M. H.: Solubility behavior of crystalline polycyclic aromatic hydrocar-bons (PAHs): Prediction of fluorine solubilities in organic sol-vents with the Abraham solvation parameter model, Polycyclic Aromat. Compd., 25, 313–326, 2005.
Sun, H., Biedermann, L., and Bond, T. C.: Color of brown carbon: a model for ultraviolet and visible light absorption by organic carbon aerosol, Geophys. Res. Lett., 34, L17813, doi:10.1029/2007GL029797, 2007.
Turpin, B. J., Hering, S. V., and Huntzicker, J. J.: Investigation of organic aerosol sampling artifacts in the Los Angeles Basin, At-mos. Environ., 28, 3061–3071, 1994.
Turpin, B. J., Saxena, P., and Andrews, E.: Measuring and sim-ulating particulate organics in the atmosphere: problems and prospects, Atmos. Environ., 34, 2983–3013, 2000.
Varga, B., Kiss, G., Ganszky, I., Gelencs´er, A., and Kriv´acsy, Z.: Isolation of water-soluble organic matter from atmospheric aerosol, Talanta, 55, 561–572, 2001.
Weimer, S., Alfarra, M. R., Schreiber, D., Mohr, M., Pr´evˆot, A. S. H., and Baltensperger, U.: Organic aerosol mass spec-tral signature from wood-burning emissions: influence of burn-ing conditions and wood type, J. Geophys. Res., 113, D10304, doi:10.1029/2007JD009309, 2008.