Natural Course of
Chlamydia trachomatis
Bacterial Load in the Time Interval between
Screening and Treatment in Anogenital
Samples
J. A. M. C. Dirks1,2*, G. A. F. S. van Liere1,2, S. Bogers1, N. H. T. M. Dukers-Muijrers1,2, P. F. G. Wolffs1, C. J. P. A. Hoebe1,2
1Department of Medical Microbiology, Maastricht University Medical Center, School of Public Health and Primary Care, Maastricht, the Netherlands,2Department of Sexual Health, Infectious Diseases and Environmental Health, Public Health Service South Limburg, Geleen, the Netherlands
Abstract
Introduction
AlthoughChlamydia trachomatis(CT) is the most common bacterial sexually transmitted infection worldwide, little is known about the natural course of the bacterial load during infec-tion. We investigated the natural course of the bacterial load in the interval between screen-ing and returnscreen-ing for treatment in genital and anorectal CT-infections.
Materials & Methods
CT-positive patients, visiting our STI-clinic in the Netherlands from June 2011–January 2014, provided a second urogenital and/or anorectal sample when returning for treatment (diagnostic sample = T1; treatment sample = T2). Patient-record provided data about the days between samples and the date of last unsafe sex. Included patients were18 years old, HIV-negative and did not report antibiotic use in the study-interval. CT load was quanti-fied using qPCR. CT load was log-transformed, and a CT load difference (Δ-CT load) of>1 log was deemed clinically relevant. Chi-square test compared load category distributions over time (decrease/equal/increase), between sample types.
Results
274 patients provided 296 paired samples. Majority of samples had a stable CT load in the interval T1-T2 (66.3%, 73.1% and 48.6% for vaginal swabs, urine and anorectal swabs resp. p = 0.07). Load decreased in 17–41% of patients, while±10% of patients showed an increase in CT load. No association betweenΔ-CT load and the interval T1-T2 was observed. Large variations can be seen in CT load at T1 and over time.
OPEN ACCESS
Citation:Dirks JAMC, van Liere GAFS, Bogers S, Dukers-Muijrers NHTM, Wolffs PFG, Hoebe CJPA (2015) Natural Course ofChlamydia trachomatis
Bacterial Load in the Time Interval between Screening and Treatment in Anogenital Samples. PLoS ONE 10(12): e0145693. doi:10.1371/journal. pone.0145693
Editor:J. Seshu, The University of Texas at San Antonio, UNITED STATES
Received:August 5, 2015
Accepted:December 6, 2015
Published:December 29, 2015
Copyright:© 2015 Dirks et al. This is an open access article distributed under the terms of the Creative Commons Attribution License, which permits unrestricted use, distribution, and reproduction in any medium, provided the original author and source are credited.
Data Availability Statement:All relevant data are within the paper.
Funding:This work was supported by the Public Health Service South Limburg and the Department of Medical Microbiology, Maastricht University Medical Center+.
Discussion
The majority (±90%) of patients have a stable or decreasing CT load in the time interval between screening and returning for treatment. The number of days between sampling was not associated with change in CT load. In the first month after the last unsafe sex, only sta-ble CT loads were seen. Our data seems to indicate that when most patients visit an STI-clinic, recommended 2 weeks after infection, the infection has already been established or is in its downward phase.
Introduction
AlthoughChlamydia trachomatis(CT) is the most common bacterial sexually transmitted infection (STI) worldwide, with over 100 million people affected [1], little is known about the natural course of this infection. It is known that urogenital CT infections can have severe out-comes such as pelvic inflammatory disease and tubal scarring resulting in infertility and ectopic pregnancy in women [2]. However, spontaneous clearance of the bacteria has also been reported [3–7]. Too little is currently known about the natural course of a CT infection in humans to help predict the outcome, or even the duration of an infection in an individual patient. This may profoundly influence recommendations for control efforts such as STI screening frequency or time parameters for partner notification and treatment [3,5].
Estimates of the duration of untreated CT infections, are highly variable by more than 40-fold, from 0.07 years to 2.99 years [8]. The number of patients that spontaneously clear their infection, ranges from 0–94% in studies [6,9] depending on the time interval between tests. It is difficult to truly study the natural course of CT infections, as it is unethical to leave patients untreated after diagnosis. Moreover, nearly nothing is known about the natural course of the bacterial load during CT infections in humans.
The natural course of the bacterial load ofChlamydia muridarumin mouse models is more extensively studied. After CT administration, a sharp increase in CT load is seen, followed by a longer plateau phase, and eventually a decline in load until resolution, approximately 3–5 weeks after infection [10–12]. In humans, it is not unlikely that a similar load curve will be found, both in urogenital and anorectal samples [13]. However, all studies assessing CT load before treatment have determined load at a single time point during an infection [14–16].
We evaluated the bacterial load in two consecutive samples (one diagnostic sample and one sample before treatment) from CT-positive STI-clinic attendants to better understand the nat-ural course of the urogenital and anorectal bacterial load over time.
Materials & Methods
Study population and procedures
patients provided will from hereon be referred to as T1 and the second sample patients pro-vided at the time of treatment as T2. Trained study nurses propro-vided patients with a visual dia-gram and oral instructions about how to take separate self-collected vaginal and anorectal swabs. For the vaginal swab, the patient was instructed to insert the swab 2.5 cm into the vagina, rotate it for 5 to 10 seconds, and then place it in a capped tube to avoid potential con-tamination. This procedure was repeated in the anus for the anorectal swab. The rationale for using self-collected vaginal swabs for routine CT testing is that they have a similar or higher sensitivity compared to nurse-collected cervical swabs [17–19]. Specimens were screened for CT at the clinical microbiology laboratory at Maastricht University Medical Center (Maas-tricht, The Netherlands) using a commercial nucleic acid amplification test [polymerase chain reaction (PCR); Roche Cobas Amplicor until 2012 and later Roche Cobas 4800, Roche Diag-nostics, Basel, Switzerland] as PCR has a higher sensitivity than culture based techniques [20].
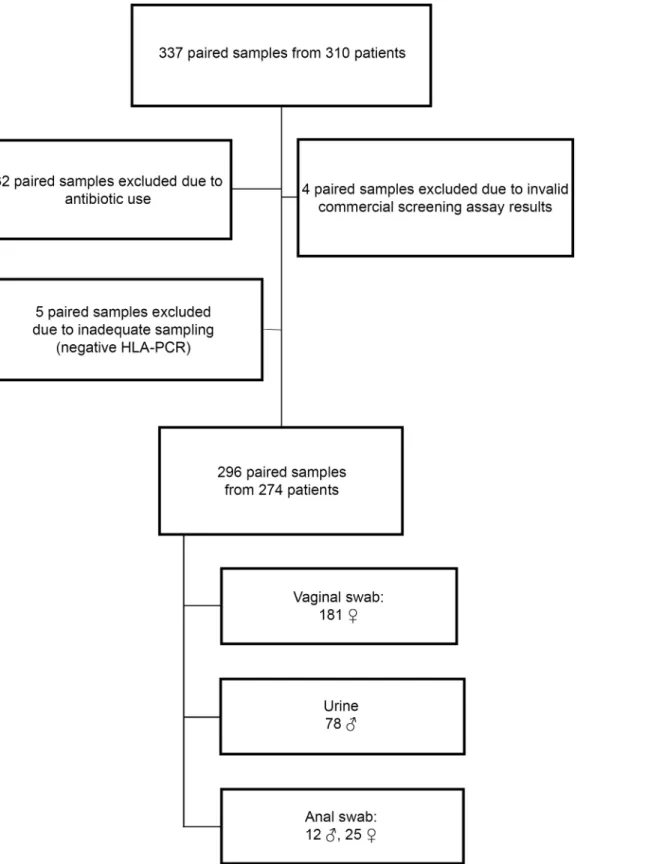
Patients empirically treated at the time of initial evaluation for CT-associated syndromes (e.g., urethritis or cervicitis) or other treatment indications (e.g., CT contact) were ineligible for inclusion in the study as the natural course of infection cannot be studied after treatment. Additional exclusion criteria for the current study were antibiotic use in the month before T1, or between T1 and T2, HIV-positivity and an invalid/inhibited CT-test result. This resulted in the exclusion of 41 paired samples from 36 patients (Fig 1).
A 30-day maximum time interval between T1 and T2 was allowed. Standard data registra-tion at each consultaregistra-tion included sociodemographic informaregistra-tion, antibiotic use, and for some patients also the date of the last unsafe sexual contact.
Ethics statement
Written informed consent was obtained from all patients prior to participation in the study. This study, including the consent procedure, was approved by the Medical Ethics Committee of the Maastricht University Medical Center (METC azM/UM nr. 10-4-66; 15-6-2011).
CT load quantification
When proven CT-positive at T1with the commercial screening assay, CT load quantification was performed for the T1 and T2 sample by an in-house qPCR as described by Dirkset al.[14]. In short, Taqman real-time PCR was used to quantify chlamydialOmpA-gene copies/ml and human leukocyte antigen (HLA)-gene copies/ml to ensure adequate sampling took place. Paired samples were excluded if no HLA could be detected in either sample (n = 5). Due to the lower sensitivity of the qPCR compared to the commercial screening assay, CT-positive sam-ples with a CT load below the quantification limit were set to half the quantification limit[14].
Samples that were CT negative at T2 with the commercial screening assay, were included in this study as samples with 0 CT/ml. Every test is limited through a detection probability of samples with a low load, and we cannot rule out a very low CT load in these‘CT-negative’ sam-ples, despite duplicate testing.
Load analyses over time
Load values were log transformed for analyses. Logarithmic converted load at T1 was sub-tracted from T2 to create a new variable‘Δ-load’. AΔ-load difference of less than 1 log load (-1 to +1) is considered the cut-off value for a stable CT load over time when test-technical vari-ability is taken into account. In short, a positiveΔ-load value of>1 log indicates an increase in
CT load, a load between +1 and -1 an equal CT load, and a negative value<-1 log a decrease in
Fig 1. Flow chart of patients who met inclusion/exclusion criteria for the study population.310 patients participated in the study, providing 337 paired samples. Forty-one paired samples did not meet inclusion criteria due to antibiotic use (n = 32), an invalid/inhibited commercial screening assay result (n = 4) or due to inadequate sampling as demonstrated by a negativeHLA-PCR (n = 5). In total, 274 patients with 296 paired samples were included in this study (181 vaginal swabs, 78 urines and 37 anorectal swabs).
The number of days between T1-T2 was used to construct a load curve in the short interval between T1 and T2. This natural load curve was then expanded by including the date of patients’last unsafe sexual contact. The number of days since patients’last (possible) exposure to CT was calculated by subtracting the date of patients’last unsafe sexual contact from the consultation date (T1 and T2). This variable was then used to construct a natural load curve over time with two load measurements at distinct time points (T1 & T2), where T0 was the moment of the last sexual contact. Information about the date of the last unsafe sexual expo-sure was available for forty-six paired samples (15.5%), ranging from 3–565 days at T1 (median 80). As only 5 patients with anorectal swabs reported their last unsafe sexual contact, they were excluded from further analyses.
Statistical analysis
Statistical analyses were stratified by sample type due to different load distributions per speci-men (data not shown). Descriptive analyses included median and CT load range, the median and range of the number of days between T1-T2 and the median and range of days since last unsafe sexual contact. For the association between the CT load and time between T1-T2, Chi-square test was used to compare the distribution of load categories (decrease/equal/increase) between sample types. Delta CT load (Δ-CT load), 95% confidence intervals (95%CI) and p-values are shown. The mean period between sampling-moments was compared over sample types using one way ANOVA. Results were considered statistically significant at p0.05. All statistical tests were performed using IBM SPSS Statistics for Windows, version 22.0 (IBM Corp. Armonk, NY, USA).
Results
Characteristics of the study population
274 patients provided 296 paired samples (T1-sample and T2-sample treated as one pair of samples).Fig 1provides a flowchart of the 296 included paired samples. Patient age ranged from 18–63 years [median 22].
CT load distribution (in the time interval between T1-T2)
T1-samples had a CT load above the quantification limit of the qPCR in 85.8% (254/296), and T2-samples in 82.1% (243/296). At T2, 7.7% (n = 14) of vaginal swabs, 5.1% (n = 4) of urines and 10.8% (n = 4) of anorectal swabs were CT-negative according to the commercial screening assay (p = 0.36).
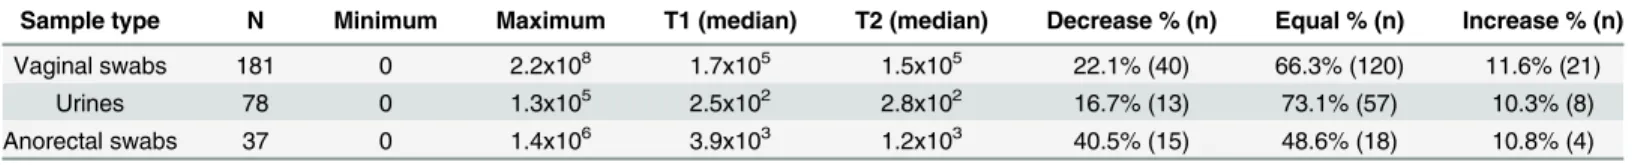
Table 1shows the difference in CT load between samples, both absolute and in categories (increase/equal/decrease). Vaginal swabs had the largest range in CT load, varying from 0–2.2x10⁸CT/ml, followed by anorectal swabs with a range of 0–1.4x10⁶and the lowest range was detected in urines, from 0–1.3x10⁵CT/ml.
CT load change related to the duration of the time interval between
T1-T2
The median period between sampling moments was 8 days (range3-28 days) for vaginal swabs, 10 days (range 6–27 days) for urines and 7 (range 4–15 days) for anorectal swabs (p = 0.70). When theΔ-CT load is plotted in relation to the time interval between T1-T2, as can be seen in
Fig 2, it becomes apparent that the majority of patients have a stable CT load over time, as the
Δ-CT load lies most frequently in the area between -1 log and +1 log. Furthermore, a larger number of days between samples does not appear to increase theΔ-CT load, as no clear funnel-ling of the results is apparent. Statistically, no association betweenΔ-CT load and time interval between T1-T2 was observed for vaginal swabs (Δ-CT load -0.08, 95% CI -0.60–0.43, p = 0.75), for urine (Δ-CT load 0.24, 95% CI -0.28–0.77, p = 0.36) and for anorectal swabs (Δ-CT load -0.17, 95% CI -1.45–1.12, p = 0.80).
Table 1. CT load distribution in absolute values (CT/ml) and 3 categories (decrease/equal/increase).
Sample type N Minimum Maximum T1 (median) T2 (median) Decrease % (n) Equal % (n) Increase % (n)
Vaginal swabs 181 0 2.2x10⁸ 1.7x10⁵ 1.5x10⁵ 22.1% (40) 66.3% (120) 11.6% (21)
Urines 78 0 1.3x10⁵ 2.5x10² 2.8x10² 16.7% (13) 73.1% (57) 10.3% (8)
Anorectal swabs 37 0 1.4x10⁶ 3.9x10³ 1.2x10³ 40.5% (15) 48.6% (18) 10.8% (4)
doi:10.1371/journal.pone.0145693.t001
Fig 2. CT load in correlation to the time interval between T1-T2.CT load in A) vaginal swabs, B) urines and C) anorectal swabs. The grey area between lines (+1 to -1) indicates a stableΔ-CT load, the samples above the delineated area have an increase in CT load, and samples below the delineated area show a decrease in CT load in the time interval between T1-T2.
CT load in the time since patients
’
last unsafe sexual exposure
The load curve was constructed for forty-one paired samples (13.9%), of whom the last unsafe sexual contact was 3–565 days ago at T1 [median 90 days]. The median number of days since the last unsafe sex was 90 days (range 7–565) for vaginal swabs and 62 days (range 3–380) for urines.
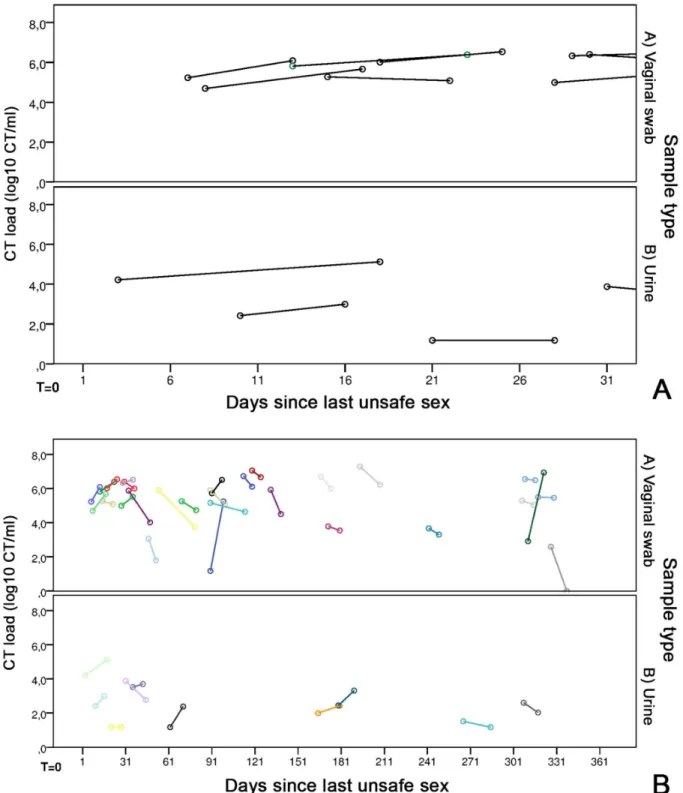
The CT load curve for the first 366 days since the last unsafe sexual exposure (Fig 3A), shows large variations in each patient, in both in the CT load at T1, as well as theΔ-CT load over time. However, a general downward trend can be seen, with most patients exhibiting a decrease in CT load between T1-T2. The first 30 days after unsafe sexual exposure, which is likely the moment that most patients get tested for their CT infection are more clearly shown inFig 3B. Here, only stable loads can be seen. Furthermore, none of the patients visiting the STI clinic in the two weeks after their last unsafe sexual contact had a‘low’CT load, i.e. a posi-tive CT test in the commercial assay, but below the limit of quantification of our in-house PCR.
A decrease in CT load was first seen after one month (30 days) since the last unsafe sexual exposure. No patients showed an (sharp) increase in CT load in the first 2 months after the last unsafe sexual exposure.
Within 30 days after sexual exposure, CT load showed a medianΔ-CT load of 0.53 log CT/ ml (range -0.40–0.97), while the CT load after one month had a medianΔ-CT load of -0.35 log CT/ml (range -2.58–4.06). Split by sample type, vaginal swabs had a medianΔ-CT load of 0.53 log CT/ml (range -0.40–0.97) within 31 days, and -0.45 log CT/ml (range -2.58–4.06) after this time. Urines had a medianΔ-CT load of 0.57 log CT/ml (range 0–0.90) within one month, and -0.45 log CT/ml (range -1.09–1.21) after one month.
Discussion
We assessed the natural course of the CT load in the interval between screening and returning for treatment in patients visiting an STI-clinic patients. This is the first study to present quanti-tative data on the natural course of CT infections over time, in both urogenital infections and anorectal infections in men and women.
We demonstrated a stable CT load in the majority (47–73%) of patients in the time interval between screening and returning for treatment, which ranged in this study from 3–28 days. Depending on the sample type, load decreased in 17–41% of patients, while only ±10% of patients showed an increase in CT load. The number of days between T1-T2 did not correlate to theΔ-CT load, i.e. a longer time between sampling did not result in a larger difference in CT load. Furthermore, the time since last unsafe sexual exposure (to CT) was not clearly related to the course of CT load, with large variations over time.
Fig 3. CT load in correlation to the time of patients’last unsafe sexual exposure.(A) CT load in A) 29 vaginal swabs and B) 10 urines correlated to the last unsafe sexual contact of patients, for a maximum of 366 days. T = 0 is the moment of the last unsafe sex and each colour is a different patient. The first circle is the CT load at T1, and the second circle is the CT load at T2, where the length of the connecting line indicates the number of days between samples. (B) CT load in A) 8 vaginal swabs and B) 3 urines in the first month after the last unsafe sexual contact of patients. T = 0 is the moment of the last unsafe sex. The first circle is the CT load at T1, and the second circle is the CT load at T2, where the length of the connecting line indicates the number of days between samples.
demonstrate a similar sharp rise in the CT load in humans in the early moments after the last unsafe sexual exposure. We did see a minority of patients that experienced a sharp increase in CT load associated with the early stages of infection, congruent with murine studies, but we do not know their actual moment of infection. Unfortunately we did not have the data of last sex-ual exposure for all patients included in this study, while even this data would only provide a proxy of the actual moment of infection. Even after 3 days since their last unsafe sexual contact, patient load was sufficiently high to be detected through highly sensitive NAAT and in-house qPCR.
In this light, our results seem to indicate that the majority of patients visit the STI-clinic when the infection has already been established or is in its downward phase. This is surprising, as most current guidelines state that patients should get tested at least 2weeks after the last unsafe sexual practices based on CT’s incubation period of 1–3 weeks [27,28]. Some recent guidelines incorporating current highly sensitive PCR-techniques are recommending immedi-ate testing after CT exposure [4,29], with the caution that a negative test must be repeated after 2 weeks. The data presented in this article provides new evidence that justifies the recent recommendations that the 2 week limit before tests might be let go.
Approximately 50% of CT-positives clear their urogenital infection within a year [3,7]. In the interval between screening and treatment this number ranges from 9–44% in urogenital samples [3,30,31] and 18% (n = 11) in anorectal samples [13]. Contrastingly, we found few patients in whom spontaneous clearance occurred, only 8% (14/181) in vaginal swabs, 5% (4/ 78) in urines and 11% (4/37) in anorectal swabs, despite the use of tests with similar sensitivity and a similar test-interval [3,32]. The low number of spontaneously cleared CT infections in our study can, most likely, be explained by the exclusion of patients who reported antibiotic use in the interval between T1 and T2 (9%). Anorectal load had a tendency to decrease more often than vaginal and urine load. A possible explanation is a more efficient immune response at the anorectal- than the urogenital site [33], but other factors may be at play.
A limitation of our study is the lack of data about prior CT infections in our patients, how-ever, diagnosed prior infections are only a proxy of the total amount of previous CT infections and therefore may confound these analyses [31]. Another limitation of our study is the inability to perform serological analyses to provide insights into the natural course of CT infections (including possible persistent infections), as blood samples were only available for a minority of the patients included in this study.
and its effect on negative sequelae and re-infection rates of CT, too much is currently unknown to fully elucidate the processes at play.
In short, CT load is stable or decreasing in the vast majority of STI-clinic patients in the time interval between diagnosis and treatment. The time-interval between samples is unrelated to the change in load over time, requiring further research to clarify other factors at play. We found only stable CT loads within the first month after the las unsafe sex, which might rein-force recent guidelines that propose instant CT-testing after unsafe sexual practises.
Acknowledgments
The authors thank the staff of the STI Clinic South Limburg for their valuable contribution to the sample collection. Furthermore, we would like to thank M. Franssen for her help in per-forming the experiments.
Author Contributions
Conceived and designed the experiments: GvL NDM PW CH. Performed the experiments: JD SB. Analyzed the data: JD GvL SB. Contributed reagents/materials/analysis tools: NDM PW CH. Wrote the paper: JD GvL NDM PW CH.
References
1. World Health Organisation. Prevalence and incidence of selected sexually transmitted infections, Chla-mydia trachomatis, Neisseria gonorrhoeae, syphilis and Trichomonas vaginalis: methods and results used by WHO to generate 2005 estimates. 2011.
2. Ljubin-Sternak S, Mestrovic T. Chlamydia trachomatis and Genital Mycoplasmas: Pathogens with an Impact on Human Reproductive Health. Journal of pathogens. 2014; 2014:183167. Epub 2015/01/24. doi:10.1155/2014/183167PMID:25614838; PubMed Central PMCID: PMCPMC4295611.
3. Geisler WM. Duration of untreated, uncomplicated Chlamydia trachomatis genital infection and factors associated with chlamydia resolution: a review of human studies. The Journal of infectious diseases. 2010; 201 Suppl 2:S104–13. Epub 2010/05/28. doi:10.1086/652402PMID:20470048.
4. Brocail M. How Soon Can I Get Tested for STDs After Unprotected Sex? 2015 [updated March 4, 2015; cited 2015 March 20]. Available from: www.stdcheck.com/blog/how-soon-get-tested-for-stds-unprotected-sex/.
5. Golden MR, Schillinger JA, Markowitz L, St Louis ME. Duration of untreated genital infections with chla-mydia trachomatis: a review of the literature. Sexually transmitted diseases. 2000; 27(6):329–37. PMID:10907908
6. Molano M, Meijer CJ, Weiderpass E, Arslan A, Posso H, Franceschi S, et al. The natural course of Chlamydia trachomatis infection in asymptomatic Colombian women: a 5-year follow-up study. The Journal of infectious diseases. 2005; 191(6):907–16. doi:10.1086/428287PMID:15717266.
7. Morre SA, van den Brule AJ, Rozendaal L, Boeke AJ, Voorhorst FJ, de Blok S, et al. The natural course of asymptomatic Chlamydia trachomatis infections: 45% clearance and no development of clinical PID after one-year follow-up. International journal of STD & AIDS. 2002; 13 Suppl 2:12–8. doi:10.1258/ 095646202762226092PMID:12537719.
8. Price MJ, Ades AE, Angelis DD, Welton NJ, Macleod J, Soldan K, et al. Mixture-of-exponentials models to explain heterogeneity in studies of the duration of Chlamydia trachomatis infection. Statistics in medi-cine. 2013; 32(9):1547–60. doi:10.1002/sim.5603PMID:22949217.
9. Handsfield HH, Alexander ER, Pin Wang S, Pedersen AH, Holmes KK. Differences in the therapeutic response of chlamydia-positive and chlamydia-negative forms of nongonococcal urethritis. Journal of the American Venereal Disease Association. 1976; 2(3):5–9. Epub 1976/03/01. PMID:767309. 10. Carey AJ, Cunningham KA, Hafner LM, Timms P, Beagley KW. Effects of inoculating dose on the
kinet-ics of Chlamydia muridarum genital infection in female mice. Immunology and cell biology. 2009; 87 (4):337–43. doi:10.1038/icb.2009.3PMID:19204735.
12. Su H, Messer R, Whitmire W, Hughes S, Caldwell HD. Subclinical chlamydial infection of the female mouse genital tract generates a potent protective immune response: implications for development of live attenuated chlamydial vaccine strains. Infection and immunity. 2000; 68(1):192–6. PMID: 10603387; PubMed Central PMCID: PMC97120.
13. Apewokin SK, Geisler WM, Bachmann LH. Spontaneous resolution of extragenital chlamydial and gon-ococcal infections prior to therapy. Sexually transmitted diseases. 2010; 37(5):343–4. doi:10.1097/ OLQ.0b013e3181d73639PMID:20393382.
14. Dirks JA, Wolffs PF, Dukers-Muijrers NH, Brink AA, Speksnijder AG, Hoebe CJ. Chlamydia trachomatis load in population-based screening and STI-clinics: implications for screening policy. PLoS One. 2015; 10(3):e0121433. Epub 2015/04/01. doi:10.1371/journal.pone.0121433PMID:25826298; PubMed Central PMCID: PMCPMC4380475.
15. Gomes JP, Borrego MJ, Atik B, Santo I, Azevedo J, Brito de Sa A, et al. Correlating Chlamydia tracho-matis infectious load with urogenital ecological success and disease pathogenesis. Microbes and infec-tion / Institut Pasteur. 2006; 8(1):16–26. Epub 2005/11/18. doi:10.1016/j.micinf.2005.05.014PMID: 16289001.
16. Walker J, Tabrizi SN, Fairley CK, Chen MY, Bradshaw CS, Twin J, et al. Chlamydia trachomatis inci-dence and re-infection among young women—behavioural and microbiological characteristics. PLoS One. 2012; 7(5):e37778. Epub 2012/06/05. doi:10.1371/journal.pone.0037778PMID:22662220; PubMed Central PMCID: PMCPmc3360595.
17. Hobbs MM, van der Pol B, Totten P, Gaydos CA, Wald A, Warren T, et al. From the NIH: proceedings of a workshop on the importance of self-obtained vaginal specimens for detection of sexually transmitted infections. Sex Transm Dis. 2008; 35(1):8–13. Epub 2007/12/25. PMID:18157061; PubMed Central PMCID: PMCPMC3836284.
18. Cook RL, Hutchison SL, Ostergaard L, Braithwaite RS, Ness RB. Systematic review: noninvasive test-ing for Chlamydia trachomatis and Neisseria gonorrhoeae. Ann Intern Med. 2005; 142(11):914–25. Epub 2005/06/09. PMID:15941699.
19. Van Der Pol B, Taylor SN, Liesenfeld O, Williams JA, Hook EW 3rd. Vaginal swabs are the optimal specimen for detection of genital Chlamydia trachomatis or Neisseria gonorrhoeae using the Cobas 4800 CT/NG test. Sex Transm Dis. 2013; 40(3):247–50. Epub 2013/02/15. doi:10.1097/OLQ. 0b013e3182717833PMID:23407470.
20. Schachter J. DFA, EIA, PCR, LCR and other technologies: what tests should be used for diagnosis of chlamydia infections? Immunol Invest. 1997; 26(1–2):157–61. Epub 1997/01/01. PMID:9037620. 21. Vodstrcil LA, McIver R, Huston WM, Tabrizi SN, Timms P, Hocking JS. The epidemiology of organism
load in genital Chlamydia trachomatis infection—a systematic review. The Journal of infectious dis-eases. 2014. Epub 2014/12/11.
22. Agrawal T, Bhengraj AR, Vats V, Mittal A. Chlamydia trachomatis: TLR4-mediated recognition by human dendritic cells is impaired following oestradiol treatment. British journal of biomedical science. 2013; 70(2):51–7. Epub 2013/07/31. PMID:23888605.
23. Hafner LM, Cunningham K, Beagley KW. Ovarian steroid hormones: effects on immune responses and Chlamydia trachomatis infections of the female genital tract. Mucosal immunology. 2013. doi:10.1038/ mi.2013.46PMID:23860476.
24. Wan C, Latter JL, Amirshahi A, Symonds I, Finnie J, Bowden N, et al. Progesterone activates multiple innate immune pathways in Chlamydia trachomatis-infected endocervical cells. American journal of reproductive immunology. 2014; 71(2):165–77. doi:10.1111/aji.12168PMID:24206234.
25. Gupta R, Wali S, Yu JJ, Chambers JP, Zhong G, Murthy AK, et al. In Vivo Whole Animal Body Imaging Reveals Colonization of Chlamydia muridarum to the Lower Genital Tract at Early Stages of Infection. Molecular imaging and biology: MIB: the official publication of the Academy of Molecular Imaging. 2014. doi:10.1007/s11307-014-0732-5PMID:24723309.
26. He Q, Ananaba GA, Patrickson J, Pitts S, Yi Y, Yan F, et al. Chlamydial infection in vitamin D receptor knockout mice is more intense and prolonged than in wild-type mice. The Journal of steroid biochemis-try and molecular biology. 2013; 135:7–14. doi:10.1016/j.jsbmb.2012.11.002PMID:23201171. 27. Marrazzo J. Clinical manifestations and diagnosis of Chlamydia trachomatis infections.2014 August
11, 2014.
28. Radcliffe K. Testing for chlamydia the "window period" 2008 [updated March 20, 2008; cited 2015 April 4]. Available from:www.bashh.org/documents/1686.pdf.
29. Family Planning Association. Chlamydia—Looking after your sexual health: Department of Health; 2014 [updated June 2014; cited 2015 March 26]. Available from:www.fpa.org.uk/sites/default/files/ chlamydia-information-and-advice.pdf.
(7):541–4; discussion 4–5. doi:10.1136/sti.2008.030825PMID:18708486; PubMed Central PMCID: PMC2750874.
31. Geisler WM, Lensing SY, Press CG, Hook EW 3rd. Spontaneous resolution of genital Chlamydia tra-chomatis infection in women and protection from reinfection. The Journal of infectious diseases. 2013; 207(12):1850–6. Epub 2013/03/09. doi:10.1093/infdis/jit094PMID:23470847; PubMed Central PMCID: PMCPmc3654745.
32. Geisler WM, Wang C, Morrison SG, Black CM, Bandea CI, Hook EW 3rd. The natural history of untreated Chlamydia trachomatis infection in the interval between screening and returning for treat-ment. Sexually transmitted diseases. 2008; 35(2):119–23. PMID:17898680.
33. Iwasaki A. Antiviral immune responses in the genital tract: clues for vaccines. Nature reviews Immunol-ogy. 2010; 10(10):699–711. doi:10.1038/nri2836PMID:20829886; PubMed Central PMCID: PMC3678359.
34. van Rooijen MS, van der Loeff MF, Morre SA, van Dam AP, Speksnijder AG, de Vries HJ. Spontaneous pharyngeal Chlamydia trachomatis RNA clearance. A cross-sectional study followed by a cohort study of untreated STI clinic patients in Amsterdam, The Netherlands. Sexually transmitted infections. 2015; 91(3):157–64. Epub 2014/09/23. doi:10.1136/sextrans-2014-051633PMID:25237127.
35. Russell AN, Zheng X, O'Connell CM, Taylor BD, Wiesenfeld HC, Hillier SL, et al. Analysis of Factors Driving Incident and Ascending Infection and the Role of Serum Antibody in Chlamydia trachomatis Genital Tract Infection. The Journal of infectious diseases. 2015. Epub 2015/09/09. doi:10.1093/infdis/ jiv438PMID:26347571.
36. Haggerty CL, Gottlieb SL, Taylor BD, Low N, Xu F, Ness RB. Risk of Sequelae after Chlamydia tracho-matis Genital Infection in Women. Journal of Infectious Diseases. 2010; 201(Supplement 2):S134– S55. doi:10.1086/652395
37. Anglemyer A, Rutherford GW, Horvath T, Baggaley RC, Egger M, Siegfried N. Antiretroviral therapy for prevention of HIV transmission in HIV-discordant couples. The Cochrane database of systematic reviews. 2013; 4:Cd009153. Epub 2013/05/02. doi:10.1002/14651858.CD009153.pub3PMID: 23633367; PubMed Central PMCID: PMCPmc4026368.
38. Chappell CA, Cohn SE. Prevention of perinatal transmission of human immunodeficiency virus. Infec-tious disease clinics of North America. 2014; 28(4):529–47. Epub 2014/12/03. doi:10.1016/j.idc.2014. 08.002PMID:25455313.
39. Dionne-Odom J, Tita AT, Silverman NS. #38: Hepatitis B in pregnancy screening, treatment, and pre-vention of vertical transmission. American journal of obstetrics and gynecology. 2015. Epub 2015/10/ 11. doi:10.1016/j.ajog.2015.09.100PMID:26454123.