DOI: 10.4301/S1807-17752011000100006
_____________________________________________________________________________________ Recebido em/Manuscript first received: 15/01/2009 Aprovado em/Manuscript accepted: 22/07/2010
Endereço para correspondência/ Address for correspondence
Ueliton da Costa Leonidio, Universidade Católica de Petrópolis Rua Benjamin Constant, 213, Centro - Petrópolis, RJ - Brasil - CEP: 25610-130 Telephone: (24) 2244-4000; (24) 2225-8368 E-mail: uleonidio@ibest.com.br
Roberto Marcos da Silva Montezano, Faculdade IBMEC RJ Av. Presidente Wilson, 118 Centro – Rio de Janeiro - RJ CEP.: 20030-020 Telephone: (21) 3284-4000 E-mail: rmontezano@ibmecrj.br
Frederico A. de Carvalho, UFRJ - Universidade Federal do Rio de Janeiro Av. Pasteur, 250 - sala 239 Praia Vermelha 22290-902 - Rio de Janeiro – RJ Telephone: (21) 3873-5112 E-mail:
fdecarv@gmail.com
ISSN online: 1807-1775
EVALUATION OF PERCEIVED QUALITY OF THE WEBSITE OF
AN ONLINE BOOKSTORE: AN EMPIRICAL APPLICATION OF
THE BARNES AND VIDGEN MODEL
Ueliton da Costa Leonidio
Universidade Católica de Petrópolis, Brasil
Roberto Marcos da Silva Montezano
Faculdade IBMEC, Brasil
Frederico A. de Carvalho
Universidade Federal do Rio de Janeiro, Brasil
__________________________________________________________________________________
ABSTRACT
This paper’s objective is to evaluate the perceived quality of the Website of an online bookstore using the Barnes and Vidgen Model. Implemented over the Internet, this empirical research collected data on the perceived quality of the Website, used to sell products and online services. The questionnaire used to gather the data was answered by a convenience sample of 213 respondents. The importance of quality attributes and the dimension of perceived quality were investigated. The results indicate that the three dimensions named Reliability, Usability and Information were the most noticeable.
1. INTRODUCTION
The growing importance of the Internet and its influence on the economy are undeniable (Cheung, 1998; Mcmanis, 2001; Barnes & Vidgen, 2002). With the advent of the Internet, the relationship between companies and consumers has suffered significant changes, mainly relating to e-commerce (Seybold, 2000; Sheth, 2002). In the context of new commercial exchanges, the search for quality has spread itself over the markets, traditional or otherwise, bringing new challenges in terms of the continuous improvement in technology and productive processes, as well as in terms of the aims and the internal values, to the organizations. In this case, the biggest applied contribution of this modern concept of quality is to combine the technical aspects of the products and services with the capacity to understand and to serve customers well (Gummesson, 1998).
The evaluation of the quality of Websites based on customer perception is fundamental to obtain and maintain success over the Internet. Improving the quality in the eyes of the customer is rewarding to the companies (Lovelock & Wirtz, 2006). Based on this information, companies may direct their efforts toward better service to their targeted customers, offering adequate products and services based on significant information (Olsina & Lafuente, 2000; Peppers, 2001; Barnes & Vidgen, 2002).
The attempt to participate in this “new market” without developing an appropriate business model of e-commerce has caused numerous failures. As a consequence, it has become relevant to understand that it was possible for companies – such as Amazon.com – to become so successful that, in a short time span, they have been present in several markets. In fact, they have been much more present than their competitors. Part of the answer lies on the strategic role that the Internet has played in the new ways to interact, becoming an activity and a necessity in itself for companies (Freitas et al., 2001; Peppers, 2001; Barnes & Vidgen, 2002). This competitive scenario demanded yet a specific reflection on the process and the supply of services through this new channel (Yakhlef, 2001).
Consumers’ behavior over the Internet, their needs and their decisions to buy have received attention in several publications (e. g. Zeithaml, Parasuraman & Malhotra, 2002). There are analytical models to investigate and evaluate the production and distribution of services over the Internet. Among them, one deserves attention, the so-called WebQual-UK (Murad, 2006, section 2.4, p. 10-51), developed over successive versions by Barnes and Vidgen since 1998 (Barnes & Vidgen, 2003, p. 297) and today by them as well named eQual (Barnes & Vidgen, 2006, p. 767).
Throughout this evolution, the authors propose and utilize a series of constructs in order to approach the measurement of customer perceptions as to the quality of e-commerce Websites.
describes the methodology. The fourth section presents and describes the empirical results, in conjunction with an international comparison. The conclusions are shown in the fifth section.
2. BACKGROUND
2. 1. The Internet and Consumer Behavior
In any purchase, customers’ choice is influenced by several factors, mainly their perception of quality, price and convenience (Rust et al., 2001). Due to the Internet, it is possible to add value to the services based on the current needs and desires of customers as they are manifested in diverse browsing situations. Collecting, handling and managing information about customers have become simpler, for their purchasing history and their preferences may be registered in a central data base. In online stores, a consumer’s purchasing standards are transparent, once visits and purchases may be electronically “documented” (Reichheld, 2000).
By providing this type of information, the Internet offers unprecedented opportunities so that a company may know their customers well and thus may customize products and services according to their preferences (Reichheld, 2000). Authors like Bhatnagar, Misra and Rao (2000), Case, Burns and Dick (2001), Lohse et
al. (2000), Jarvenpaa, Tractinsky and Vitale (2000), Koufaris et al. (2002), Liao and
Cheung (2002) and Peterson et al. (2001) have tried to identify the factors that influence attitudes and behaviors of online purchases. Even if in an intuitive manner, and sometimes only implicitly, these authors adopt classical models of consumer behavior, particularly the model proposed by Engel, Kollat and Blackwell, the EKB (Sheth et al., 1998), that tries to explain the behavior of online purchases from three large concept groups: (a) consumer’s profile, (b) the use they make of the Internet and (c) the attitudes they have toward online purchases.
In what concerns users’ profile, in terms of their demographics, in Brazil or in other countries, the Internet user belongs to the social classes of higher levels of family income and education (Li & Zhang, 2002; Morgado, 2003). Li and Zhang (2002) state nonetheless that demographic characteristics do not have a strong impact on the behavior of online purchases. Another explanatory factor would be the availability of time to browse (Lohse, 2000). Variables like the level of knowledge of the Internet tools and of training seem to influence the use of the Internet for making purchases. Consumers that receive many emails search for information on products and services and use the Internet as a routine tool. These are the types that tend to consume more over the Internet (Li & Zhang, 2002). As for attitudes, it is noticed that perceived risk, perceived quality, security and privacy, and advertising over the Internet are the main elements that influence online purchases (Morgado, 2003; Grunert & Ramus, 2005).
purchase online. Consumers that make frequent online purchases are more oriented towards convenience and less oriented towards experience, convenience being perhaps the determining factor as to when deciding to purchase (Li, 1999; Li & Zhang, 2002).
Reliability, reputation and the company’s size, technological orientation and innovation are also characteristics that help to explain decisions to buy over the Internet, as well as familiarity with salespeople, logistical support, product characteristics, technological characteristics of the sites, characteristics of the information and site format, all of which bring about a positive relationship with consumer behavior (Ho & Wu, 1999; Gefen, 2000; Grunert & Ramus, 2005).
Therefore it becomes essential to investigate and to understand how to operationalize those perceptions that orient consumers’ decisions over the Internet.
2. 2. Service Quality over the Internet
Services over the Internet are services delivered through the use of the Internet channel. This delivery places some challenges on firms that provide services. Firstly, the contact between employees and customers is lost and the delivery environment is completely different. In the case of services over the Internet, websites have become the “moment of truth” between customers and the company (Iwwarden et al., 2003). Thus, the website, which is the interface with the user/client, impacts in a relevant way upon the manner whereby the service is delivered to the customer.
Together, customers evaluate “what” the company offers and “how” it is offered. Due to the inexistence of the face to face interaction while service is delivered, aspects such as the interface with the customer, the design, the plan and the scope of the site have gained importance – for the website is the place where the interaction occurs – and this may influence the global evaluation of the website by customers. For this reason, it is recommended that companies consider the design, the plan, the duties and the role of their websites. Otherwise, customers may become frustrated and, consequently, discouraged from visiting the website if it cannot be accessed or easily browsed. In addition, website content should be taken into consideration regarding online evaluations (Grönroos, 2000).
In other words, service suppliers need to understand (a) what attributes are considered to be more relevant by the customer when they use Internet services; (b) which factors affect customer intention to use these services; (c) how these services affect the perception the customer has regarding the company (Zhu, 2002). In addition, in order to establish a good strategy, it is necessary to have a good business plan, a product or service that attracts people, adequate personnel and partners capable of implementing and using the technology in question (Shi, 2003).
Zeithaml, 2002). One of the reasons for the increase in importance of the quality of electronic services is that, since the advent of the Internet, it has become easier to compare the different special offers compared to the traditional channels. In reality, consumers expect a level of quality of services equal to or better than the traditional services (Santos, 2003). Albeit, the question remains “how” the quality of electronic services is defined, what its determining factors are and how it can be measured (Kenova & Jonasson, 2006).
Until recently, there was not much research or there were not many models directed at the quality of services over the Internet. When talking about online services, one cannot measure its quality simply by the research of already existing dimensions of quality, for there is no interpersonal contact, no personal contact with employees and some aspects of human interaction, which is inherent and common to the traditional services, cannot be transposed to technological services. For example, aspects such as courtesy, cordiality, attention, usefulness, commitment, flexibility, or clarity cannot be transposed. Thus, other aspects should compensate for the lack of human interaction (Cox & Dale, 2001).
In this online space, the communication between customers and companies happens by means of information systems, hence, the importance of ease to browse, of interactivity and of ease to purchase. This places emphasis on the design of the website, all linked to the technical and marketing aspects which vary according to the product/service or the main focus of the business activity of the organization. Even before the user fills out a form or makes a purchase, the user will be already interacting with the website by browsing its pages. If the user encounters difficulties browsing the website, they will probably not return to it (Palmer & Griffith, 1998; Cox & Dale, 2001).
2. 3. Models of Evaluation of Websites
The evaluation of websites has evolved with the growth and maturity of the Internet, evolving from the analysis of technical aspects to the gathering of information on user expectations and perceptions. Online consumers now represent the main evaluators and critics of the process of the delivery of services through the Internet, for they are the end-users of e-commerce companies. At every step of the process of browsing and of purchasing, voluntarily or otherwise, consumers evaluate the performance of the stores they use. This performance becomes a decisive surviving factor of the company in the online marketplace, for it will influence the consumer’s decision as to the first time and subsequent purchases online of the products and services of that company (Curi, Dias & Filho, 2006).
According to a note by Stabey (1990), the models that base themselves on the opinion of consumers in general are founded on the so called QFD (Quality Function Deployment). Its objective is to add value to the productive process, always offering products based on consumer demands (Stanton, 2002). The question that needs to be answered is: how do we define the needs and the demands, since what we vie for is to make offers directed at and focused on consumer demands? Without this answer one cannot create a relevant content from the technical-functional point of view. Although it is never simple to answer this question, the QFD is an approach that may provide clarity (Barnes & Vidgen, 2000; 2001-a). QFD’s philosophy rests on the gathering of information, through user workshops, where they refine and define what is relevant or not, case by case. After this process, it is recommended the making of questions to be asked in the questionnaire to be used – first with open questions, then, after a satisfactory refinement, they become closed questions.
Two known models that base themselves on the QFD are the Servqual and the WebQual-UK. A recent example of the use of Servqual appears in Kenova e Jonasson (2006). On the other hand, the evaluation of the quality in websites under the customer (users) perspective was also the focus of several researches done with WebQual-UK. WebQual evaluates the quality of websites under the “voice of the consumer” perspective, based on QFD (Barnes & Vidgen, 2000; 2001a).
WebQual-UK is a method for evaluating the quality of services of an e-commerce organization and it supports itself on indexes that translate the customers’ perception of quality, including its evaluation of the importance of quality attributes (Barnes & Vidgen, 2002). The WebQual instrument has been developed since 1998 and has evolved into a process of interactive refinement for different types of e-commerce (University, Online Stores, and online auction websites), e-government and WAP services. This method has transformed qualitative evaluations made by users into useful qualitative metrics for the management of the decision-making process. The users may be companies, suppliers or end-consumers of information and services; therefore, it is necessary to go beyond the technical and functionality aspects, given the needs of the users (Barnes & Vidgen, 2000).
After the first three versions, it was possible to identify three dimensions of quality in e-commerce: use, quality of the information and the quality of the interaction of the service. After these versions, WebQual was again refined using the literature of three central areas of research: information systems (as to the quality of the information), marketing (as to the quality of the interaction of the service) and the man-computer interaction (as to its usability). Workshops were held during all phases of development of the instrument to ascertain the validity of the quality found (Barnes & Vidgen, 2002). After the workshops and the literature review they arrived at the WebQual-UK version 4.0, with 22 questions. Already applied to Online Bookstores on websites in England – Amazon, Bertelsmann Online (BOL) and Internet Bookshop (IBS) – this version will also be applied here.
consolidated themselves in Webqual: (a) Usability, (b) Design, (c) Information, (d) Reliability and (e) Empathy, all grouped a priori in three main dimensions:
. Usability – this dimension has to do with man-computer interaction and how customers perceive and interact with the website, qualities that are associated with design and usability. For example: appearance, ease of use and of browsing, appropriate design and the image put forth.
. Quality of the information – this dimension relates to the quality of website content: adequate information for the user in question, precision, format and relevance.
. Quality of the interaction with the service – this dimension concerns features associated to Reliability and Empathy. It has to do with the experience the user has with the website, including the depth of browsing, and this is expressed through Reliability and Empathy, allowing for the smooth functioning of the website, its accuracy and its capacity to offer services that satisfy users’ profile. Surpassing the simple condition of the “website’s characteristics”, Reliability (on the website) has been recognized as the key aspect for competition in e-commerce (Gefen, 2000; Jarvenpaa et al., 2000; Kenova & Jonasson, 2006; Mazo, 2006), in what it has to do with the security of the transaction and of the information, the delivery of the product, or the customization and communication of the website itself.
Due to the focus on interface (cf. Zeithaml, Parasuraman & Malhotra, 2002, p. 366) this model does not analyze the relevant factors of an online purchase like methods of payment (Gallindo, 2003). In summary, this model is an attempt to interact with the market and its visitors, through the judgment of the quality of the website (Gounaris & Dimitriadis, 2003).
3. METHODOLOGY
This work is composed of descriptive and quantitative research, where the data collection is based on a sample, in cross-section and non-probabilistic, due to the fact this evaluation is based only on registered customers that have already had a purchasing experience, from the choosing of the product to its receipt. Since the objective of this research is to apply the Barnes and Vidgen models in order to assess the quality of the website of a certain online bookstore, we may classify the research method as a unique case study of the descriptive type (Scapens, 1990).
3. 1. Sample and data collection
“research”, as it is so common among us for sales pitches to be disguised as “research”. Another reason could be a fear of “hindering” sales by inserting research on their website, despite the voluntary characteristic of their participation. By contrast, the successful experience of a single company by doing research on its site can be seen in Gonzalez Maceira and Carvalho (2006).
According to Black and Champion (1976, p. 91), “one of the advantages of the case study is its flexibility with regards to the procedures for the collection of the data, since here we use a questionnaire to be answered via Web and it is structured based on the WebQual-UK model, of Barnes and Vidgen. The filling out of the questionnaire may be classified as “non-supervised”, although a “Support” channel was made available to assist respondents. Primary and secondary data was collected. The primary data involved the application of the questionnaire with the customers and the secondary data resulted from research on books, the Internet and from academic literature.
There are numerous ways to evaluate the quality of Websites, for example, competitive analyses, scenarios, direct visual inspection and online questionnaires (Cunliffe, 2000). In this research, a self-administered online questionnaire was made available on the website built over the Internet (www.webquali.com.br), following the procedures used for the WebQual-UK model, previously applied in England Barnes & Vidgen, 2000, 2001a, 2001b, 2002; Barnes, Liu & Vidgen, 2001). To attract respondents, individual emails were sent and discussion groups were set up.
The WebQual 4.0 version questionnaire model was used, with proper translations and context. The structure was maintained since this instrument has already been applied and validated several times on Online Bookstore websites (for example, Barnes & Vidgen, 2001b, 2002).
After the home page, which had the filling out instructions, the questionnaire began, containing the items to be evaluated on a scale of agreement of up to seven points. An “automatic control” would weed out incomplete questionnaires. Each evaluated item had a link in its number, which would take it to an explanation page that worked as a “dictionary”. A few translations were made and also the presetting of words. Demographic information was also requested in order to enrich the results.
There was also an indicator available to “visit the website”, a link to the website’s page that made access easier and invited interaction. At the end there was also an open item available, called “comments”, so that respondents that wanted to leave an impression about the company or the service rendered could do so.
3. 2. Treatment and analysis of the data
The data obtained was converted into Excel and SPSS 13.0 tables. Initially, descriptive statistical procedures were used and the internal consistence coefficient was calculated (Cronbach´s Alpha). Following that, in order to determine the perceived quality dimensions, exploratory factor analyses were performed, extracting factors from the main components and the varimax rotation, to facilitate their interpretation.
(Parasuraman et al, 2000; Barnes & Vidgen, 2002). Then the answers were transformed, multiplying each website evaluation statement (agreement) by its respective importance statement. This multiplication aimed at obtaining a more comprehensive interpretation, creating three relative indexes (weighted ones): (a) the total weighted score (Importance Max Score), multiplying the importance average obtained by 7, which is the maximum rating given in the evaluation in each of the questions, (b) the maximum weighted score of the evaluated bookstore (Website Max Score) and (c) the performance score actually reached by the bookstore in relation to the maximum that could have been reached for each question. These indexes are useful for comparing against researches already done with the same instrument about other online bookstores.
3. 3. Limitations
In spite of being applied to online Auctions, Online Bookstores, News Websites for WAP applications and British University Websites, it was not possible to find an application on Brazilian websites. So, for the purpose of an international comparison, the year in which the questionnaires were done may constitute a certain limitation, mainly due to the large advancements made in Internet and e-commerce activities over the last few years.
Non-sampling errors may also occur, since it is a self-administered questionnaire. The answers given may be influenced by problems in comprehension, distortions, lack of motivation, or by errors in the research instrument. Due to its non-sampling nature, these errors do not reduce even when the size of the samples grows (Hair et al., 1998). Some of these problems could be corrected if a face to face research were done (Cooper & Schindler, 2002).
4. RESULTS
4. 1. The Company researched
Founded in 1914, the selected organization for this case study offers a complete catalogue of text books and extra-curricular text books, in the legal, managerial, economics and accounting areas. It is the leader in legal books, with a 40% market share. It is the fourth largest text book publisher in the country, with nearly 20% of market share.
One of the pioneers in e-commerce in Brazil, the company began its online activities in 1998. In December 2006 it had approximately one million active customers; currently there are more than 1.5 million registered items available for sale. In 2006, the bookstore section closed the year with approximately R$350 million in gross revenues, with the sales from the online bookstore accounting for nearly R$100 million, an increase of up to 52.5% from 2005. The bookstore section represented more than half of the total sales.
the Internet alone – which is 32% of all customers. The development of partnerships with the main search engines resulted in an increase of 38% in the average ticket and contributed to an increase of 53% in gross revenues. The Company Researched
4. 2. The sample’s profile
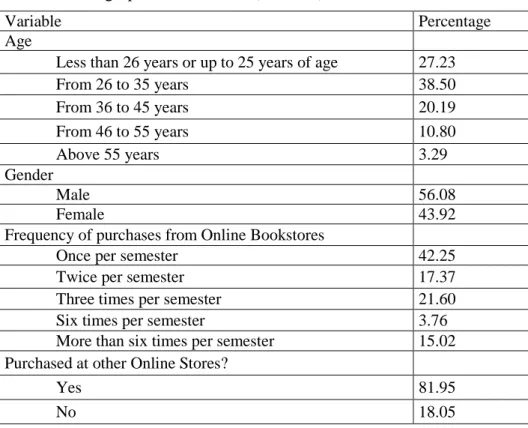
There were 213 questionnaires done, and answered, between June 18th and September 30th 2007, through the website www.webquali.com.br. The following tables summarize the information obtained in the answered questionnaires. Table 1 shows that nearly 39% of respondents were between 26 and 35 years of age and that 27% were up to 25 years of age. As for the gender, 56% were male.
The majority of respondents (42%) purchase “once every semester”, while 22% purchase “three times a semester”, more than the those that purchase “twice every semester” (17%). Those who purchase “more than six times every semester” represent 15% of the sample. Respondents demonstrated experience with other online bookstores, as 82% said they have purchased from other online bookstores.
Table 1 – Demographic Information (N = 213)
Variable Percentage
Age
Less than 26 years or up to 25 years of age 27.23
From 26 to 35 years 38.50
From 36 to 45 years 20.19
From 46 to 55 years 10.80
Above 55 years 3.29
Gender
Male 56.08
Female 43.92
Frequency of purchases from Online Bookstores
Once per semester 42.25
Twice per semester 17.37
Three times per semester 21.60
Six times per semester 3.76
More than six times per semester 15.02
Purchased at other Online Stores?
Yes 81.95
No 18.05
4. 3. Reliability of the WebQual-UK scale
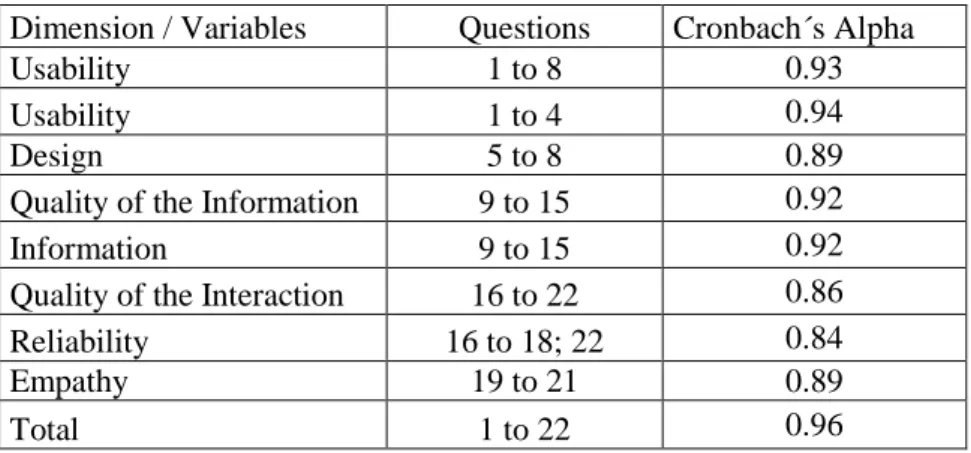
In order to evaluate the reliability of the scale and of its a priori added dimensions Cronbach´s Alpha was used, a measurement of reliability well used to evaluate a set of variables associated with a construct (Cooper & Schindler, 2002). What we want to know is (a) if the items that belong to each dimension are simultaneously consistent, and also (b) if they can be used to measure that same dimension. By definition, the values calculated for “Alpha” are always smaller than or equal to 1 (and the values can even be negative), and larger values indicate more reliability in the set of variables. “Alpha” values that are less than 0.7 indicate the need to successively refine the scale until acceptable values are obtained (Hair et al., 1998). Thus, the “Alpha” coefficient verifies the reliability of the questionnaire used as an instrument of measurement. The reliability measures the degree in which the measurement is consistent, so that its use should produce similar results in similar situations (Cooper & Schindler, 2002; Kenova & Jonasson, 2006).
Table 2 shows the resulting reliability of the “Alphas” calculated from the collected data. All scores were accepted, for they are all well above 0.7, indicating that the items from the scale have a high internal reliability (Barnes & Vidgen, 2002; Kenova & Jonasson, 2006).
Table 2 – Reliability of the scale according to Cronbach’s Alpha
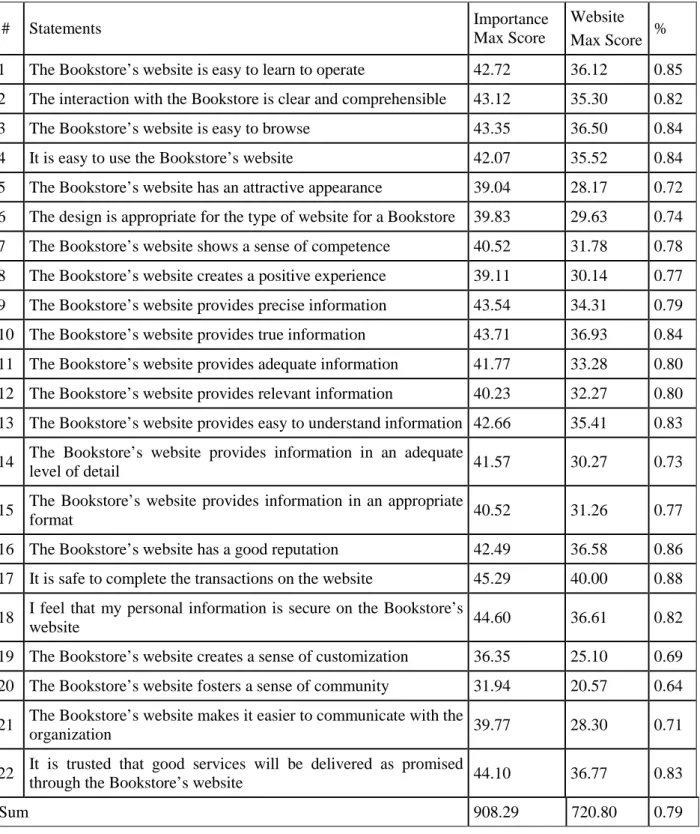
4. 4. The Webqual scores
Table 3 shows the weighted indexes that allow defining and differentiating more clearly the customers’ perceptions. The results are weighted to emphasize the differences and to direct the defined priorities by the respondents. For each answered questionnaire, question by question, a multiplication was made of the evaluation done by the respondents for each statement by the importance given to that same question, generating a new spreadsheet.
Dimension / Variables Questions Cronbach´s Alpha
Usability 1 to 8 0.93
Usability 1 to 4 0.94
Design 5 to 8 0.89
Quality of the Information 9 to 15 0.92
Information 9 to 15 0.92
Quality of the Interaction 16 to 22 0.86
Reliability 16 to 18; 22 0.84
Empathy 19 to 21 0.89
Table 3 – Webqual Index
# Statements Importance
Max Score
Website Max Score %
1 The Bookstore’s website is easy to learn to operate 42.72 36.12 0.85
2 The interaction with the Bookstore is clear and comprehensible 43.12 35.30 0.82
3 The Bookstore’s website is easy to browse 43.35 36.50 0.84
4 It is easy to use the Bookstore’s website 42.07 35.52 0.84
5 The Bookstore’s website has an attractive appearance 39.04 28.17 0.72
6 The design is appropriate for the type of website for a Bookstore 39.83 29.63 0.74
7 The Bookstore’s website shows a sense of competence 40.52 31.78 0.78
8 The Bookstore’s website creates a positive experience 39.11 30.14 0.77
9 The Bookstore’s website provides precise information 43.54 34.31 0.79
10 The Bookstore’s website provides true information 43.71 36.93 0.84
11 The Bookstore’s website provides adequate information 41.77 33.28 0.80
12 The Bookstore’s website provides relevant information 40.23 32.27 0.80
13 The Bookstore’s website provides easy to understand information 42.66 35.41 0.83
14 The Bookstore’s website provides information in an adequate
level of detail 41.57 30.27 0.73
15 The Bookstore’s website provides information in an appropriate
format 40.52 31.26 0.77
16 The Bookstore’s website has a good reputation 42.49 36.58 0.86
17 It is safe to complete the transactions on the website 45.29 40.00 0.88
18 I feel that my personal information is secure on the Bookstore’s
website 44.60 36.61 0.82
19 The Bookstore’s website creates a sense of customization 36.35 25.10 0.69
20 The Bookstore’s website fosters a sense of community 31.94 20.57 0.64
21 The Bookstore’s website makes it easier to communicate with the
organization 39.77 28.30 0.71
22 It is trusted that good services will be delivered as promised
through the Bookstore’s website 44.10 36.77 0.83
Sum 908.29 720.80 0.79
importance. The “Importance - Max Score” column was generated by multiplying the average importance by 7, which is the largest value that can be reached for each question in the evaluation. Then, the average of the number obtained by the importance multiplied by the agreement was calculated, generating the column called “Website - Max Score”. Lastly, there is the usual percentage column. The values calculated for the “Website - Max Score” show the performance according to the evaluations received by the website and will be used further down to compare the results obtained here with the scores resulting from the evaluation of the British websites.
4. 5. Exploratory Factor Analyses
To examine the answers to questionnaires that are made up of several items (i.e., multi-attribute scales), one of the paths pointed out by the multi-varied literature is the application of the technique known as Exploratory Factor Analysis (Hair et al., 1998). In nearly the entire empirical research there is at least one reason to follow that recommendation, namely, the parsimony principle, understood here as the reduction of the data, that translates into the acquisition of a set of new variables (the “factors”) capable of summarizing the original multi-varied information, with the additional virtue of facilitating its interpretation.
Each dimension of quality shown in the theoretical model is analyzed with the help of the customers’ answered questionnaires. The use of the Exploratory Factor Analysis permits verifying whether: (a) the statements used adequately represent each dimension of the quality they are associated with and (b) the group of initial questions can be rearranged into a smaller number of factors (dimensions) so that this study may be conducted with a higher level of simplification (Luchesa, 2004; Kenova & Jonasson, 2006).
Table 4 – Factor Loadings with the Varimax Rotation
Factors
Variables (items) 1 2 3 4 5
2 The interaction with Saraiva´s website is clear and
comprehensible 0.7944
1 Saraiva´s website is easy to learn to operate 0.7920
3 Saraiva´s website is easy to browse 0.7834
4 It is easy to use Saraiva´s website 0.7682
13 Saraiva´s website provides easy to understand
information 0.6191
7 Saraiva´s website shows a sense of competence 0.5389
11 Saraiva´s website provides adequate information 0.7453
14 Saraiva´s website provides information in an adequate
level of detail 0.7428
10 Saraiva´s website provides true information 0.7044
9 Saraiva´s website provides precise information 0.6785
8 Saraiva´s website creates a positive experience 0.5672
15 Saraiva´s website provides information in an appropriate
format 0.5450
12 Saraiva´s website provides relevant information 0.5145 0.5356
16 Saraiva´s website has a good reputation 0.5262
20 Saraiva´s website fosters a sense of community 0.8355
19 Saraiva´s website creates a sense of customization 0.7977
21 Saraiva´s website makes it easier to communicate with
the organization 0.7581
18 I feel that my personal information is secure Saraiva´s
website 0.8358
17 It is safe to complete the transactions on Saraiva´s
website 0.7953
22 It is trusted that good services will be delivered as
promised through Saraiva´s website 0.5022 0.5527
5 Saraiva´s website has an attractive appearance 0.7917
6 The design is appropriate for the type of website for
It may be considered that the highlighted groups of variables in each column from Table 4 confirm this grouping a priori and demonstrate a nomological validity (Barnes & Vidgen, 2002). These groups are obtained through the gathering of the largest values from each column, and the order of the columns, from right to left, is established according to the variance contained in each one of them (Table 5). With the five factors generated, it is possible to reproduce 79% of the total variance that corresponds to the 22 original variables, which is well above the minimum of 60% recommended by Malhotra (2001). The objective of this reduction in the data may, thus, be considered reached.
4. 6. Discussion and comparison of results
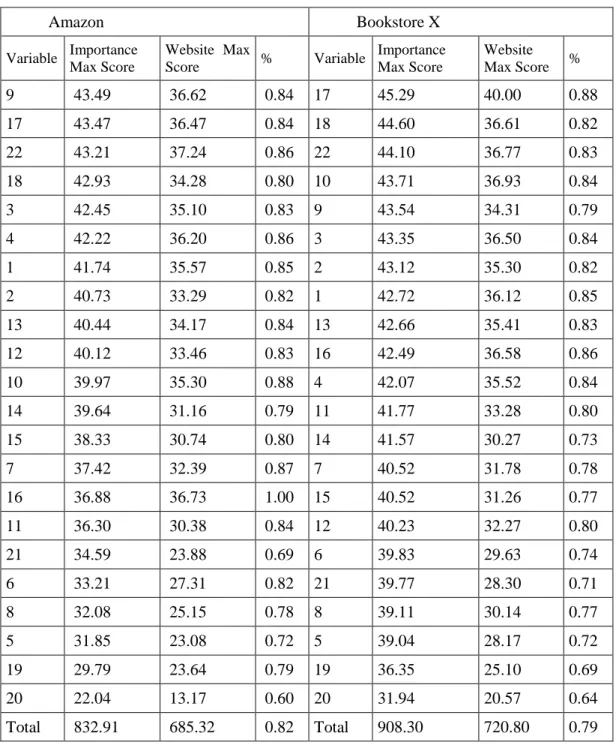
Several prior applications evaluated the importance of the attributes of the perceived quality for Websites of British online bookstores. For example, Barnes e Vidgen (2001b) used WebQual 2.0, while Barnes e Vidgen (2002) applied WebQual 4.0. In this section, the results of these researches will be compared to the current WebQual 4.0 application on a Brazilian online bookstore.
Table 6 offers a comparison between the data extracted from the research done on the Amazon Online Bookstore and the data obtained here. According to the table, the dimension Reliability was the most important, for the British, as well as for the Brazilian consumers, such that, three out of the four variables relative to that dimension occupy the top four spots.
Table 5 – Percentage of the variance explained by each factor
Componentes
Components Eigenvalues
% Variancia Variance
% acumulada accumulated
1 31.123 55.200 55.200
2 5.117 9.076 64.277
3 3.558 6.311 70.588
4 2.455 4.354 74.942
Table 6 – Comparison between online bookstores through the Max score
Amazon Bookstore X
Variable Importance Max Score
Website Max
Score % Variable
Importance Max Score
Website Max Score %
9 43.49 36.62 0.84 17 45.29 40.00 0.88
17 43.47 36.47 0.84 18 44.60 36.61 0.82
22 43.21 37.24 0.86 22 44.10 36.77 0.83
18 42.93 34.28 0.80 10 43.71 36.93 0.84
3 42.45 35.10 0.83 9 43.54 34.31 0.79
4 42.22 36.20 0.86 3 43.35 36.50 0.84
1 41.74 35.57 0.85 2 43.12 35.30 0.82
2 40.73 33.29 0.82 1 42.72 36.12 0.85
13 40.44 34.17 0.84 13 42.66 35.41 0.83
12 40.12 33.46 0.83 16 42.49 36.58 0.86
10 39.97 35.30 0.88 4 42.07 35.52 0.84
14 39.64 31.16 0.79 11 41.77 33.28 0.80
15 38.33 30.74 0.80 14 41.57 30.27 0.73
7 37.42 32.39 0.87 7 40.52 31.78 0.78
16 36.88 36.73 1.00 15 40.52 31.26 0.77
11 36.30 30.38 0.84 12 40.23 32.27 0.80
21 34.59 23.88 0.69 6 39.83 29.63 0.74
6 33.21 27.31 0.82 21 39.77 28.30 0.71
8 32.08 25.15 0.78 8 39.11 30.14 0.77
5 31.85 23.08 0.72 5 39.04 28.17 0.72
19 29.79 23.64 0.79 19 36.35 25.10 0.69
20 22.04 13.17 0.60 20 31.94 20.57 0.64
Total 832.91 685.32 0.82 Total 908.30 720.80 0.79
among the top ten evaluations in both locations. There were two differences found among the top ten classifications: the variables “It is easy to use the website” and “The website provides relevant information” appear in Amazon but do not appear in this research. By contrast, the variables “The site has a good reputation” and “The site provides true information” do appear in this research, but not in Amazon.
At the bottom of Table 6 the worst evaluations were all similar, showing that, as for the quality of the interaction, Reliability shows itself to be well evaluated, but Empathy not as much. The appearance also received low evaluations, by the British and by the Brazilians. The variables “The website has an attractive appearance”, “The website fosters a sense of community” and “The website creates a sense of customization” all appear among the worst evaluations. As for the total sums, the domestic bookstore reached higher numbers than Amazon in the “Importance Max Score” and in the “Website Max Score” columns. On average, however, it obtained a lower approval rate than the foreign bookstore.
5. CONCLUSIONS
According to the statistical results obtained, the WebQual-UK instrument is a useful tool in the evaluation of the perception of quality of a website used in e-commerce operations. The instrument was applied to a Brazilian company. Even without trying to offer “advice” on how an organization should improve its e-commerce sales, it was possible to indicate important directions on what customers perceive of services delivered and possible improvements suggested by these perceptions.
The improvement of e-commerce services, mainly in terms of the interaction, is dependent upon the integration of front office operations with back office operations, as well as the integration of e-marketing operations with traditional marketing operations. Another important point has to do with the relationship strategy with customers (Barnes & Vidgen, 2002). The quality of the interaction is a dilemma for online bookstores: on one hand, regarding reliability, the results indicated a good level of perception; on the other hand, regarding empathy, the calculated perceptions were not as good, showing the lowest evaluations (in the domestic and in the British context). This suggests that an improvement be made in the quality of the interaction with the website.
The greatest distinction of the websites lies on Reliability. In fact, Reliability seems to be a key aspect of competition in e-commerce (Gefen 2000; Jarvenpaa et al. 2000; Mazo, 2006; Barnes & Vidgen, 2002).
Ramus, 2005). Reliability showed itself to be the most important dimension in the customers’ evaluation with the highest scores of perceptions. The respondents also recognized the importance of a good reputation in order to make purchases over the Internet.
The perceived dimensions of quality, considered as the most important, have to do with the quality of the interaction, more specifically, the variables gathered in the Reliability factor: in a possible 7, they reached 6 points. Another dimension perceived as important was the Quality of the Information, with emphasis on precision and the truthfulness of the information provided. In summary, in spite of the fact that reliability is the most important dimension, the other dimensions are relevant, forming a whole set that deserves managerial attention.
As for the strong points, it is most evident that the bookstore shows itself to be trustworthy to the customers, aside from enjoying a good reputation. The customers say that the website is easy to browse and to use, that the information contained in it is true and that the interaction is good. They also understand that their purchases are delivered on time according to the contract. The weak points that appeared were related to Design and Empathy. The website does not offer customization and does not show a sense of community. Weak points are also the appearance and the reduced details of the information provided. In addition, the website is polluted; it contains too much information in some sections and too little in others, indicating perhaps, a lack of standardization. There are conflicts of information regarding delivery dates and the communication with the company leaves much to be desired.
Companies must realize that, due to the lack of human interaction of online services, the website assumes the role of mediator of the “moments of truth”, thus requiring a high level of quality of the services rendered, this being taken as the strategic objective and determining factor of the competitive success of e-commerce business (Lederer, Mirchandani & Sims, 2001; Zeithaml, 2002; Sukasame, 2005). Finally, as Calitz and Scheepers (2002) emphasize, the implementation of a website for e-commerce requires the observation of multiple criteria, of which the quality of the interface is just part of it, for aspects such as the size of the budget, time for development, ease of implementation and maintenance costs should be considered.
REFERENCES
Barnes, S. J.; Vidgen R. T. (2000). WebQual: An Exploration of Web Site Quality.
Proceedings of the Eighth European Conference on Information System, Vienna, July
3-5.
______; ______.(2001). Assessing the Quality of Auction Web Sites. Proceedings
of the Hawaii International Conference on System Sciences, Maui, Hawaii, January 4-6.
______; ______. (2002). An integrative approach to the assessment of e-commerce quality. Journal of Electronic Commerce Research. 3, 3, 114-127.
______; ______. (2006). Data triangulation and web quality metrics: a case study in e-government. Information and Management, 43, 6, 767-777.
Barnes, S. J.; Liu, K.; Vidgen, R. T. (2001). Evaluating WAP News Sites: the WebQual Approach. Global Co-Operation in the New Millennium, The 9th European
Conference on information Systems, Bled, Slovenia, June 27-29, 344-355.
Bhatnagar, A.; Misra, S.; Rao, H. R. (2000). Online risk, convenience, and Internet shopping behavior. Communications of the ACM, 43, 11, 98-105.
Black, J. A.; Champion, D. J. (1976). Methods and Issues in Social Research. New York: John Wiley and Sons Inc.
Calitz, A.; Scheepers, B. A comparative analysis of e-commerce website development using two implementation methods. Annual Research Conference of the South African Institute of Computers Scientists and Information Technologists, 2002. In
proceedings of SAICSIT 2002, 251, Port Elizabeth, South Africa, September.
Case, T., Burns, O. M., and Dick, G. N. (2001). Drivers of on-line purchasing among U.S. university students. Proceedings of the 7th Americas Conference on Information Systems, 873-878.
Cheung, W. (1998). The use of the World Wide Web for commercial purposes,
industrial Management & Data Systems, 98, 4, 172-177.
Cooper, D. R.; Schindler, P. S. (2002). Métodos de Pesquisa em Administração. 7ª ed. Porto Alegre: Bookman.
Cox, J.; Dale, B.G. (2001). Service quality and e-commerce: an exploratory analysis.
Managing Service Quality, 11, 2, 121-131.
Curi, W. R.; Dias, T. A.; Filho, C. G.(2006). A Percepção dos Clientes Quanto à Qualidade dos Sites na Internet: Aplicação e Validação do Modelo WebQual. Anais do
XXX ENANPAD, 1999, Salvador: ANPAD.
Freitas, H.; Janissek, R.; Luciano, E.; Oliveira, M. (2001). Observando a prática de negócios na internet: os casos do Submarino.com e Lokau.com. Anais do XVI
ENANPAD, Campinas: ANPAD.
Gallindo, F. M.(2003). Modelo de avaliação da qualidade do serviço em sites de varejo eletrônico. Dissertação de Mestrado (Engenharia de Produção), COPPE – UFRJ. Rio de Janeiro – RJ.
Gefen, D. (2000). E-commerce: the role of familiarity and trust, Omega, 28, 6, 725-737.
Gonzalez Maceira, M. L.; Carvalho, F. A. de. Caracterizando o risco de compra na internet: o caso de um site de venda de ingressos. Anais do CATI 2006 - Congresso
Anual de Tecnologia da Informação, # 203. EAESP – FGV, São Paulo.
2003.
Grönroos, C. (2000). Service Management and Marketing: a Customer Relationship Management Approach. 2nd ed. Chichester, UK: John Wiley & Sons Ltd.
Grunert, K. G.; Ramus, K. (2005). Consumers’ willingness to buy food through the internet: a review of the literature and a model for future research. British Food Journal, 107, 6, 381-403.
Hair, J. F.; Anderson, P. E.; Tatham, R. L.; Black, W. C. (1998). Multivariate Data Analysis, 5th ed. Englewood Cliffs, NJ: Prentice Hall.
Ho, C.; Wu, W. (1999). Antecedents of customer satisfaction on the Internet: an empirical study of online shopping. Proceedings of the 32nd Hawaii International
Conference on System Sciences, 5, Washington: IEEE Computer Society, 5027.
Jarvenpaa, S. L., Tractinsky, N., and Vitale, M. (2000). Consumer trust in an Internet store. Information Technology and Management, 1, 1-2, 45-71.
Kenova, V.; Jonasson, P. (2006). Quality Online Banking Services. Monografia de graduação (Administração de Empresas). Jonkoping International Business School. Jönköping, Suécia, iv + 74.
Kotler, P. (2000). Administração de marketing: a edição do novo milênio. São Paulo: Prentice Hall.
Klose, M.; Lechner, U. (1999). Design of Business Media: an integrated Model of Electronic Commerce. Proceedings of AMCIS 1999 - the Americas Conference on
Information Systems, paper # 193.
Koufaris, M.; Kambil, A.; Labarbera, P. A. (2002). Consumer behavior in Web-based commerce: an empirical study, International Journal of Electronic Commerce, 6, 2, 115-138.
Lederer, A.; Mirchandani, D.; SIMS, K. (2001). The Search for Strategic Advantage from the World Wide Web. International Journal of Electronic Commerce, 5, 4, 117-133.
LI, H.; Kuo, C.; Russell, M. G. (1999). The impact of perceived channel utilities, shopping orientations, and demographics on the consumer’s online buying behavior.
Journal of Computer-Mediated Communication, 5, 2, 1-20.
LI, N.; Zhang, P.(2002). Consumer Online Shopping Attitudes and Behavior: an Assessment of Research. Proceedings of AMCIS 2002 – the Americas Conference on
Information Systems, paper # 74.
Liao, Z; Cheung, M. T. (2002). Internet Based E-banking and Consumer Attitudes: an Empirical Study; Information & Management, 39, 4; 283-295.
Lohse, G. L.; Bellman, S.; Johnson, E. J. (2000). Consumer Buying Behavior on the Internet: Findings from Panel Data. Journal of Interactive Marketing; 14, 1; 15-29.
Lovelock, C.; Wright, L. (2001). Serviços: marketing e gestão. São Paulo: Saraiva.
Luchesa, C. J. (2004). Estudo da Adequação dos Índices da Análise Econômico-financeira às Empresas Florestais, utilizando Métodos Estatísticos Multivariados. Tese de Doutorado (Economia), UFPR. Curitiba - PR, 225.
Malhotra, N. K. (2001). Pesquisa de Marketing – uma orientação aplicada. 3ª ed. Porto Alegre: Bookman.
Mazo, M. S. (2006). Antecedentes e conseqüências da satisfação no varejo virtual: um estudo em lojas de livros e dvd’s. Dissertação de Mestrado (Administração), CEPPAD-Centro de Pesquisa e Pós-graduação em Administração, UFPR. Curitiba - PR, 119.
Mcmanis, B. L.; Ryker, R.; Cox, C. (2001). An examination of Web usage in a global context, Industrial Management & Data Systems, 101, 9, 470-478.
Morgado, M. G. (2003). Comportamento do consumidor online: perfil, uso da Internet e atitudes. São Paulo: FGV-EAESP, 159.
Murad, M. (2006). Ampliação do modelo Lohse & Spiller na avaliação de sites de seguradoras brasileiras. Dissertação (Mestrado Profissionalizante em Administração). IBMEC-RJ. Rio de Janeiro, 125.
Olsina, L.; Rossi, G. (2002). Measuring Web Application Quality with WebQEM,
IEEE Multimedia, 9, 4, 20-29.
Olsina, L.; Lafuente, G.; Rossi, G. (2000). E-commerce Site Evaluation: a Case Study. Proceedings of the First International Conference on Electronic Commerce and
Web Technology, Greenwich - UK, 239-252. Disponível em
http://petra.euitio.uniovi.es/Actividades/cursos_verano_9900/Olsina_ECWeb2000_form atted.pdf. Acesso em 01-12-2008.
Palmer, J. W.; Griffith, D. A. (2001). The role of interface in electronic commerce.International Journal of Electronic Commerce, 5, 4, 135-153.
Parasuraman, A.; Zeithaml, V. A.; Berry, L. L.; Grewal, D. (2000). The Impact of Technology on the Quality-Value-Loyalty Chain: A Research Agenda. Journal of the
Academy of Marketing Science, 28, 1, 168-174.
Pepers, D. (2001). CRM Series - Marketing 1 to 1. 2ª ed. São Paulo: Makron Books.
Peterson, R. A.; Balasubramanian, S.; Bronnenberg, B. J. (2001). Exploring the Implications of the Internet for Consumer Marketing, in SHETH, J. N.; ESHGHI, A.; KRISHNAN, B. C. (orgs.) Internet Marketing. Forth Worth: Harcourt College Publishers, 120- 147.
Rust, R. T.; Zeithaml, V.; LEMON, K. N. (2001). O Valor do cliente. Porto Alegre: Bookman.
Santos, J. (2003). E-service quality: a model of virtual service quality dimensions.
Managing Service Quality, 13, 3, 233-246.
Scapens, R. W. (1990). Researching Management Accounting Practice: the role of case study methods. British Accounting Review, 22, 3, 259-281.
and Evaluation; John Wiley & Sons.
Sukasame, N. E-service quality: a paradigm for competitive success of e-commerce entrepreneurs. Pacific Asia Conference on Information Systems PACIS 2005, Bangkok, Tailândia. Disponível em http://www.pacis-net.org/file/2005/390.pdf. Acesso em 15/07/2008.
Turban, E.; King, D. (2004). Comércio Eletrônico: estratégia e gestão. São Paulo: Prentice Hall.
Webshoppers – 13ª edição. Relatório sobre a evolução da web no Brasil e o perfil dos compradores on-line. Disponível em http://www.webshoppers.com.br Acesso em 01/03/2007.
Yang, Z. (2001). Customer perceptions of service quality in internet-based electronic commerce. Proceedings of the 30th EMAC Conference, Bergen, Noruega, 8-11.
Yakhlef, A. (2001). Does the Internet compete with or complement bricks-and-mortar bank branches? International Journal of Retail & Distribution Management, 29, 6, 272-281.
Zeithaml, V.A. (2002). Service excellence in electronic channels. Managing Service
Quality, 12, 3, 135-139.
______; Parasuraman A.; Malhotra, N. (2002). Service Quality Delivery Through Web Sites: A Critical Review of Extant Knowledge. Journal of the Academy of