© FECAP
RBGN
Received on February 19, 2014 Approved on June 17, 2015
1. José Afonso dos Reis Junior
Master in Accounting and Controlling
Universidade de São Paulo FEA-RP/USP
(Brazil) [joseafonso@
redivivusambiente.com.br]
2. Maisa de Souza Ribeiro Doctor in Controllership and Accounting
Universidade de São Paulo (Brazil)
3. Charbel José Chiappetta Jabbour
Associate Professor in General Management
Universidade de São Paulo (Brazil)
4. Hans Michael van Bellen Doctor in Production Engineering Universidade Federal de Santa Catarina (Brazil)
Review of Business Management
DOI:10.7819/rbgn.v17i56.1900
Analysis of CDM projects’
potential benefits
José Afonso dos Reis Junior Redivivus Ambiente, SP, Brazil
Maisa de Souza Ribeiro Accounting, FEA-RP/USP, SP, Brazil
Charbel José Chiappetta Jabbour Production Engineering, UNESP, SP, Brazil
Hans Michael van Bellen Knowledge Engineering, UFSC, SC, Brazil
Responsible editor: João Maurício Gama Boaventura, Dr. Evaluation process: Double Blind Review
ABStRACt
Objective – he main goal of this study is to identify and assess, within sustainability reports, information concerning potential carbon credits obtained through projects carried out under Clean Development Mechanism (CDM) assumptions, as well as to assess CDM project experts’ perceptions of obstacles to entering carbon credit markets. Design/methodology/approach – exploratory, descriptive, bibliographical and documental research, and interviews.
heoretical basis - Research was based on the concepts of sustainability, especially as to environmental responsibility (CSR); cost-beneit analysis was also considered, since selling carbon credits can be a way of mitigating the trade of between immediate shareholder satisfaction and investment in CSR.
Findings – he perceptions of representatives from carbon credit projects’ certifying companies was examined by means of a series of interviews – concluding that savings in costs, business marketing and certiications are even greater motivators than carbon credits themselves. We estimated that, through energy eiciency, the projects discussed in 2011 sustainability reports would be capable of saving approximately 538 million reais in costs. In addition, 40 million reais, considering the rate of the euro and of securities on December 31, 2014, would be gained through the sale of carbon credits.
Practical implications – hus, this research helps to demonstrate the signiicant potential for further inancial gains that companies may obtain through energy eiciency and habitat restructuring, whether by taking advantage of CO2 reduction brought about by such projects, or by developing new projects that continue to beneit economy, society and the environment.
1 IntRODuCtIOn
In Brazil, especially from the 1990s on, there has been a growing concern about companies’ attitudes towards sustainability. his concern can be easily veriied in Brazilians’ recent interest in the topic, which may also be directly responsible for the emergence of new public policies and laws such as the New National Policy on Solid Waste (Nova Política Nacional de Resíduos Sólidos). Market concern (considering all stakeholders) regarding sustainable development is also perceptible in the establishment of social and environmental indicators, in new sustainability report platforms and in other ways of disseminating “sustainable” actions. Faced with this demand, companies have reacted with projects that involve energy efficiency, restoration of degraded habitats, and greenhouse gas (GHG) emission reductions, amongst other actions. hese projects aim to generate carbon allowance surpluses (credits that can be traded) and improvements in the environment, in a co-beneits approach (Puppin-De-Oliveira et al., 2013).
herefore, the strengthening of a Corporate Social Responsibility (CSR) culture tends to result in market pressure, which in turn mobilizes the business sector. his is a demand for a reduction in resource consumption and in the polluting waste.
Discussions concerning this issue have been most frequent and present within academic research. Among contemporary studies, we highlight Nossa, Nunes, Teixeira and Galdi (2010), Kolk, Levy and Pinkse (2008), Segreti and Bito (2006), Souza, Paiva, Andrade, Silva and Goulart (2012), Iri, Ferreira and Linhares (2013), Silva, Freire and Basseto (2012), Poudyal, Siry and Bowker (2012), Fearnside (2013), Costa, Pasini and Andrade (2013), amongst others.
In Pearce’s deinition (2003), cost-beneit analysis of environmental assessments is the “comparison between gains and losses associated with an investment project or a policy for setting an environmental standard”. he essence of cost-beneit analysis is the procedure for assessment
of the social value of environmental or political projects.
According to Das and Sengupta (2011, p. 834), “different pollutants have different pollution control costs”. hus, there are many less expensive ways of controlling pollution “from multiple sources and that relect diferent pollution control costs”. Countries then take on the set of environmental standards that cost the least to achieve target emissions. “Although eiciency is not attainable for many regulators, cost-efectiveness is attainable.”
he idea of the Triple Bottom Line (TBL) created by Elkington (1994) proposes that companies’ success and performance should not be assessed only by the traditional bottom line (inancial), but by integrating an economic, social and environmental tripod, so as to guarantee the company’s positive image in the market. According to Vellani, Albuquerque and Fava (2009), the market may understand that these companies are more transparent, face lower risks and have a greater ability of sustaining themselves in the future. Mattila (2009) agrees and associates CSR to companies’ competitiveness, mainly through promotion of the corporate image. he construction of this image occurs through actions taken by the company and by how society sees it.
in many diferent ways – among them, through the establishment of recovery and environmental protection technologies; and to assist developed countries in complying with their quantiied commitments concerning emission limitations and reduction. hus, it is applicable in negotiations between developed and developing countries; the latter may promote actions that result in GHG reductions in the atmosphere, obtain recognition for these reductions by the UNFCCC (Certiied Emission Reduction/CER, popularly known as carbon credits) and negotiate the results of these efforts with stakeholders. Carbon credits are inancial compensation to developing countries that have been willing to contribute to the global goal of planet continuity in a healthy way. Although the inancial attractiveness of carbon credits has decreased dramatically over the period, the CDM has fulilled its role of demonstrating that the efficient use of resources can bring economic, social and environmental beneits.
Certain companies have carried out and presented efforts to reduce their impacts on society and the environment, including those caused by greenhouse gases, and used their annual and sustainability reports to publicize them. But not all of them have demonstrated a commitment to transforming emission reductions into carbon credits; in fact, few have put efort into this endeavor. his is due to the expense and bureaucracy involved. Facing this reality, this research aims to answer the following question: what would be CDM projects’ potential for generating benefits in companies listed in BM&FBovespa’s Corporate Sustainability Index (ISE) and Carbon Eicient Index (ICO2) in June 2011?
Therefore, the main objective of this research is to analyze information concerning CDM projects’ potential benefits, based on sustainability reports.
his work is justiied by the importance of identifying opportunities that can be converted into carbon credit projects via CDM, through information already disclosed in the sustainability reports of companies listed in BM&FBovespa’s
environmental indexes, ISE and ICO2; and also to try to understand why mechanisms that are so useful to sustainable development have not received broad support from the business community.
In this first topic we have presented comprehensively the issues that will be addressed in this paper. he second topic is the theoretical framework; the third topic presents methodology; in the fourth topic, we present a diagnosis of the beneits that can be associated with CDM projects and their potential for carbon credit generation; the ifth topic presents the perception of market professionals concerning the beneits of CDM projects and the resistance to carbon credits; and, inally, in the sixth topic we present the paper’s inal considerations.
2 COnCePtuAl FOunDAtIOnS
As part of the process of mitigating climate change, the Kyoto Protocol was a milestone to stimulate the reduction of GHG emissions; this occurred through the establishment of inancial burdens for those who exceeded established parameters, leading to negotiations between the parts that had attained reductions and those in need of credits to supplement their reduction targets. Faced with the need to stimulate the measurement of these emissions and to recognize the eforts of companies that were involved with reductions, in 1999 the New York Stock Exchange created the Dow Jones Sustainability Index, which tracks the inancial performance of organizations involved in social responsibility in its broadest sense, which is sustainability (Gomes, Gonçalves, Pardini & Muniz, 2010).
BM&FBovespa. In 2010, BM&FBovespa also created its Carbon Eicient Index (ICO2).
Sustainability indexes have been one way to encourage disclosure of information concerning environmental initiatives that have been carried out, and have highlighted concern for social and environmental problems, as seen in the growing number of spontaneously published statements.
Importantly, companies have responded to this pressure based on the assumption that a social and environmental responsibility image is capable of generating comparative value and/ or advantages when compared to their peers. According to scientiic literature, a company’s special characteristics depend on the market in which it operates and on the beneits it can have on meeting demands. Research has proven that investments in proactive environmental initiatives do pay off (Burgos_Jiménez, Vázquez-Brust, Plaza-Úbeda, & Dijkshoorn, 2013).
Accordingly, the current paradigm and investors’ proiles themselves have changed over time and, as a result, pressure has emerged, even from new shareholders. Large companies are no longer in the hands of a few investors with large amounts of money, but in the hands of a great number of citizens who invest their money in big players. Individual and Pension Fund investors are profoundly changing the way global capital markets work (Davis, Lukomnik, & Pitt-Watson, 2008).
Thus, research concerning detailed information or environmental disclosure has been increasingly signiicant. In this scenario, accounting, by measuring and reporting the environmental impacts of a company’s activities, plays out its role as a social science (Rover, Borba, & Murcia, 2009), not only focusing on internal analysis of inancial organizations but also expanding its operations and analysis to these organizations’ environments, by paying attention to social and environmental indicators.
In this context, disclosure of environmental transactions and events is one of the accounting instruments that contribute to transparency in the company’s relationship with the environment, and
may add up to a set of reports to interest groups or stakeholders, so that organizations may acquire legitimacy. (Rover & Murcia, 2010).
Projects for business improvement and expansion designed under CDM assumptions, as well as contributing to social and environmental preservation and well-being, generate a kind of reward for those who create them. his reward may be essentially translated into resource savings, into increases in brand value or into the marketing of carbon credits, generating an alternative source of revenue for the company.
2.1 Carbon credits
The process that leads to obtaining carbon credits involves the following ive steps: oicially recognizing a company’s GHG emission reduction potential; authorizing the emission of a certain amount of emission reduction certiicates; marketing of these certiicates; the latter being purchased by companies who need to supplement their commitments to reductions; and, inally, a phase for verifying reductions that were actually carried out.
In Brazil, speciically, by the end of the Kyoto Protocol commitment period (2008-2012) there were 300 (4%) projects under the CDM. his put Brazil in third place in number of activities (7.166), behind China, with 3.682 (51%) and India, with 1.371 projects (20%) (Ministério da Ciência, Tecnologia e Inovação [MCTI], 2015).
responsible for approving nationwide projects. Part of this lethargy can be explained by the requirements made.
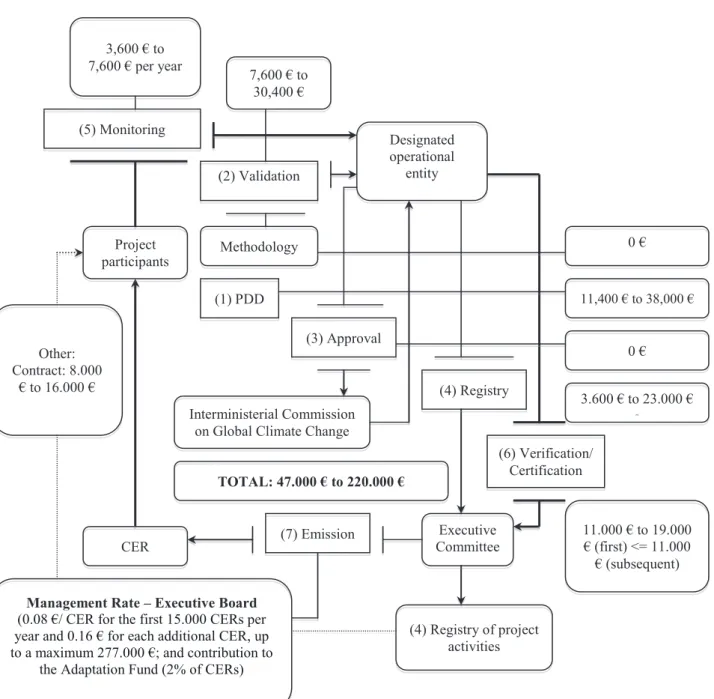
Figure 1 portrays the process behind the development of a CDM project, as well as investments necessary to its approval. his value varies between €47,354.00 and €138,116.00 (or US$ 60,000.00 and US$ 175,000.00) –
which is a signiicant amount, in itself capable of making certain small and medium-sized projects impossible (Centro de Gestão de Estudos Estratégicos [CGEE], 2010). Silva (2011) found an average cost between 50 and 115 thousand dollars, and an average approval period between 6 and 18 months.
Designated operational
entity
(1) PDD
Other: Contract: 8.000
€ to 16.000 €
3,600 € to 7,600 € per year
(5) Monitoring
7,600 € to 30,400 €
CER
Management Rate – Executive Board (0.08 €/ CER for the first 15.000 CERs per
year and 0.16 € for each additional CER, up to a maximum 277.000 €; and contribution to
the Adaptation Fund (2% of CERs)
Interministerial Commission on Global Climate Change
(4) Registry
Executive Committee
(6) Verification/ Certification
(4) Registry of project activities (3) Approval
Project participants
(2) Validation
Methodology
TOTAL: 47.000 € to 220.000 €
(7) Emission 11.000 € to 19.000
€ (first) <= 11.000 € (subsequent)
11,400 € to 38,000 € 0 €
0 €
3.600 € to 23.000 €
a
FIguRe 1 – Example of CDM project transaction costs
Given this relatively high need for investment, and due to the international inancial crisis, the number of Brazilian projects certiied to sell carbon credits has dropped over the period. Furthermore, recently, investors have also seemed insecure as to the Kyoto Protocol’s continuity, given the uncertainties and lack of goal-setting that have emerged in international meetings to discuss climate change.
he carbon market has been afected by uncertainties that arose at the end of the irst period of the agreement with the Kyoto Protocol and the diiculties inherent to a new consensus, which pushed the price of carbon credit values well below the most pessimistic forecasts, that is, from its previous value of around 20 euros, it dropped to six euros in 2012, and to 0.57 eurocents in December 2014. A similar scenario occurred in late 2007, when prices reached near zero due to excessive allocation of credits in the irst period. However, in 2008, prices were reestablished to 25 euros per credit (Kolk et al., 2008).
Currently, facing the 2020 perspective, the carbon credit market continues to be somewhat dejected, due to inancial crises or government incentives. However, we must emphasize that, according to Hepburn (2010), the market for trading emission reduction securities already existed before the launch of the Kyoto Protocol and, curiously, in the United States, in the 1970s, with later improvements in the 1990s with the amendment of legislation on air quality (Clean Air Act). herefore, the carbon market is likely to react and remain active, considering the emission reduction commitments made by several countries.
We must also mention the emergence of a voluntary carbon market alongside the regulated market; its main feature, as its name suggests, is its independence from government rules and bureaucracy and, therefore, its lower costs. With these characteristics, this opportunity for new businesses has become accessible to a wider range of members of society (Silva, 2011; Souza et al, 2012).
However, despite this not very optimistic scenario, projects developed under CDM assumptions bring about signiicant beneits, whether from the operational point of view or from the social and environmental one. In general, cost-beneit analysis combines the beneits of a project, expressed in monetary terms, to its costs, thus investigating the inancial viability (or impossibility) of adopting it. Both beneits and costs must be converted into current and comparable values, because one must consider short- and long-term variables.
Following cost-benefit analysis, the decision to develop CSR actions moves on to the temporal sphere, that is, to what will be the best time for their deployment.
Cost-beneit analysis helps to understand companies’ choice of CSR projects, since it reveals trade of, that is, the ability to choose based on the idea that, in certain decisions, one loses something in expectation of there being a beneit in return.
3 MetHODOlOgICAl PROCeDuReS
his research is exploratory, descriptive and qualitative in nature. Representatives from seven carbon credit project certifying companies, part of the projects submitted to the Brazilian Ministry of Science, Technology and Innovation (Ministério de Ciência, Tecnologia e Inovação/ MCTI) between 2002 and March 2012, were addressed by means of a questionnaire with ive questions and then by telephone, in order to reach those who did not respond to e-mails.
The basis for this research was the information disclosed by companies in their sustainability reports, or the like, referring to GHG emission reductions. At the end of the analysis, information available at the Ministry of Environment was consulted in order to ind CDM projects registered by companies in scopes mentioned in sustainability reports.
his study analyzed information disclosed in the sustainability reports of companies classiied in ISE and ICO2 sustainability indexes, organized by BM&FBovespa, from May to June 2011. he purpose of this exercise was to assess the potential for transforming actions undertaken and disclosed into CDM projects and, hence, into carbon credits. In sum, 59 companies were listed with information concerning corporate social responsibility; among these companies, 37 were listed in ISE, 40 in ICO2, and 18 companies were in both indexes. We used the GRI standard, third version, which was current at the time of data collection, as a parameter. We considered the indicators of the environmental dimension of sustainability; from the 30 belonging to this group, five were selected for discussion and analysis, namely: EN 5 – Energy saving, conservation/efficiency; EN 6 – Low energy products/services or from energy from renewable sources and reductions achieved; EN 7 – Indirect consumption reduction initiatives and reductions achieved; EN 13 – Protected or restored habitat; EN 18 – Greenhouse gas reduction initiatives and reductions achieved. hese ive indicators belong to the following groups: energy eiciency;
greenhouse gas reductions; and absorption of consumption. They were selected because they present characteristics of additionality, representing supplementary actions at the operational process.
Only 36 of the 59 companies had prepared reports in the GRI standard; thus, the remaining 23 companies had their data collected in sustainability reports in other formats, in the notes to the inancial statements and annual reports; the data thus collected was categorized in the standard deined by the GRI model.
hese companies were classiied according to the level of applicability of their reports: A+, A, B, B+, C or C+. It is worth remembering that the sign “+” (plus) meant that the report was checked by a specialized external audit. On the other hand, 23 companies whose information was not in the GRI standard were classiied as “ADAPT” (Adapted).
Next, conversion (standardization) of values and measures was carried out to equal area extension measurements, and, from these, to tons of carbon. So, all energy potential measurements were converted into watts; greenhouse gas reduction measures into tons of carbon; and habitat restoration (carbon absorption) was converted into hectares. Subsequently, these values were converted into carbon credits (Certiied Emission Reduction – CERs), according to the following relationship: 1 Ton of Carbon equivalent to 1 carbon credit.
4 A n A ly S I S O F C A R B O n C R e D I t PROJeCtS
4.1 I d e n t i f y i n g i n i t i a t i v e s a i m e d a t sustainability that are predominant and capable of generating carbon credits
education and rewarding. his efort is translated directly into economy generated as energy measures (watts), which will be later converted into carbon credits.
Habitat restoration refers basically to the carbon absorption capacity of a given area of intact or replanted forest. he process requires full verification of additionality, as well as complementary studies that demonstrate the entire carbon uptake over the years; every ton of carbon absorbed by this maintenance or action will be converted into a carbon credit. his ratio must be used throughout the entire process.
he reduction of greenhouse gases was concentrated in the energy matrix change in production, in replacement of combustion vehicles and equipment or in awareness and/ or restriction of equipment use; and in the restoration of habitats every ton of carbon absorbed additionally will be converted into a carbon credit.
All the above processes take a certain length of time to demonstrate additionality and to be converted into carbon credit projects and subsequently marketed. However, it is clear that these projects, except for the restoration of habitats, seem like a relatively simple way of receiving immediate inancial returns, and become more interesting than carbon credit projects on a
short-term cost-beneit analysis.
4.2 Standardization of energy efficiency measures
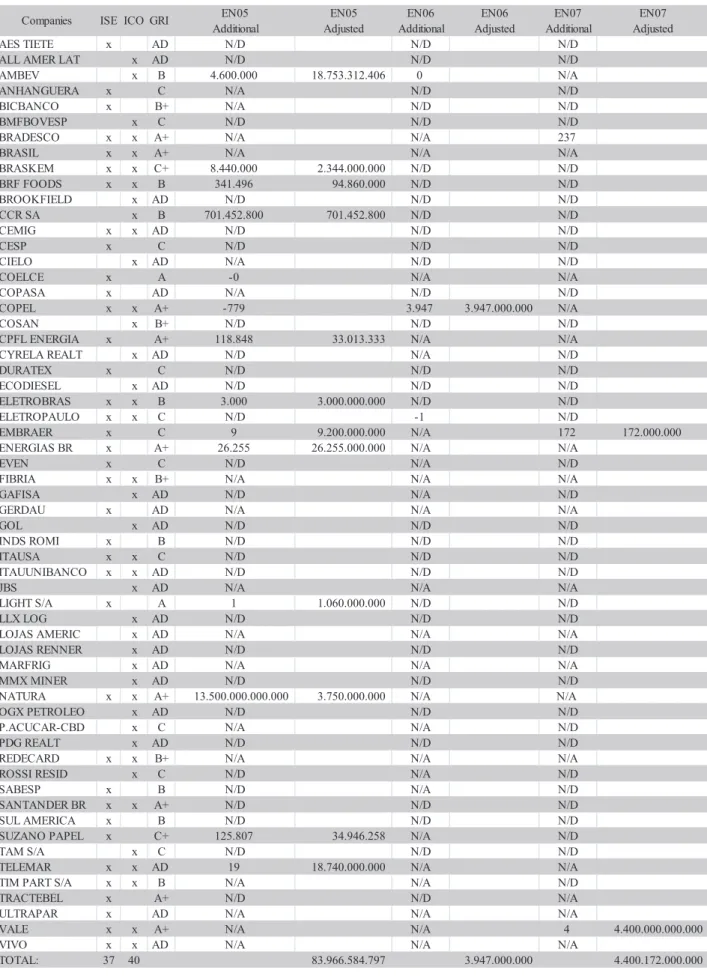
After inishing research and characterization of environmental sustainability indicators within company reports, it was prepared Table 1 containing information and analysis from the reports and conversions and standardization carried out based on disclosures. Importantly, in Table 1:
1) energy eiciency corresponds to indicators EN5, EN6 and EN7, presented from the 6th to the 11th column in Table 1. his indicator was measured in watts and megawatts.
2) the absorption of greenhouse gases corresponds to the EN13 indicator, presented in the 12th and 13th columns in Table 1. his indicator was measured in hectares.
tABle 1 – General characteristics of companies listed in ISE and ICO2
EN05 EN05 EN06 EN06 EN07 EN07
Additional Adjusted Additional Adjusted Additional Adjusted
AES TIETE x AD N/D N/D N/D
ALL AMER LAT x AD N/D N/D N/D
AMBEV x B 4.600.000 18.753.312.406 0 N/A
ANHANGUERA x C N/A N/D N/D
BICBANCO x B+ N/A N/D N/D
BMFBOVESP x C N/D N/D N/D
BRADESCO x x A+ N/A N/A 237
BRASIL x x A+ N/A N/A N/A
BRASKEM x x C+ 8.440.000 2.344.000.000 N/D N/D
BRF FOODS x x B 341.496 94.860.000 N/D N/D
BROOKFIELD x AD N/D N/D N/D
CCR SA x B 701.452.800 701.452.800 N/D N/D
CEMIG x x AD N/D N/D N/D
CESP x C N/D N/D N/D
CIELO x AD N/A N/D N/D
COELCE x A -0 N/A N/A
COPASA x AD N/A N/D N/D
COPEL x x A+ -779 3.947 3.947.000.000 N/A
COSAN x B+ N/D N/D N/D
CPFL ENERGIA x A+ 118.848 33.013.333 N/A N/A
CYRELA REALT x AD N/D N/A N/D
DURATEX x C N/D N/D N/D
ECODIESEL x AD N/D N/D N/D
ELETROBRAS x x B 3.000 3.000.000.000 N/D N/D
ELETROPAULO x x C N/D -1 N/D
EMBRAER x C 9 9.200.000.000 N/A 172 172.000.000
ENERGIAS BR x A+ 26.255 26.255.000.000 N/A N/A
EVEN x C N/D N/A N/D
FIBRIA x x B+ N/A N/A N/A
GAFISA x AD N/D N/A N/D
GERDAU x AD N/A N/A N/A
GOL x AD N/D N/D N/D
INDS ROMI x B N/D N/D N/D
ITAUSA x x C N/D N/D N/D
ITAUUNIBANCO x x AD N/D N/D N/D
JBS x AD N/A N/A N/A
LIGHT S/A x A 1 1.060.000.000 N/D N/D
LLX LOG x AD N/D N/D N/D
LOJAS AMERIC x AD N/A N/A N/A
LOJAS RENNER x AD N/D N/D N/D
MARFRIG x AD N/A N/A N/A
MMX MINER x AD N/D N/D N/D
NATURA x x A+ 13.500.000.000.000 3.750.000.000 N/A N/A
OGX PETROLEO x AD N/D N/D N/D
P.ACUCAR-CBD x C N/A N/A N/D
PDG REALT x AD N/D N/D N/D
REDECARD x x B+ N/A N/A N/A
ROSSI RESID x C N/D N/A N/D
SABESP x B N/D N/A N/D
SANTANDER BR x x A+ N/D N/D N/D
SUL AMERICA x B N/D N/D N/D
SUZANO PAPEL x C+ 125.807 34.946.258 N/A N/D
TAM S/A x C N/D N/D N/D
TELEMAR x x AD 19 18.740.000.000 N/A N/A
TIM PART S/A x x B N/A N/A N/D
TRACTEBEL x A+ N/D N/D N/A
ULTRAPAR x AD N/A N/A N/A
VALE x x A+ N/A N/A 4 4.400.000.000.000
VIVO x x AD N/A N/A N/A
TOTAL: 37 40 83.966.584.797 3.947.000.000 4.400.172.000.000 Companies ISE ICO GRI
According to information from ANEEL, the average market price for electricity distribution in Brazil in 2011 was R$ 237.00 per MWh [megawatt/hour] (Agência Nacional de Energia Elétrica [ANEEL], 2015). We also took into account that the price of electricity is made up of the following: the wire rate (which is the cost of energy transportation); taxes; and the value of the energy actually consumed itself. Whereas the wire rate and taxes account alone, on average, for 50% of the amount paid for electricity, and in the case of this study we are only concerned with the value of energy actually consumed, the market value for each MWh saved was set at R$ 120.00 per MWh.
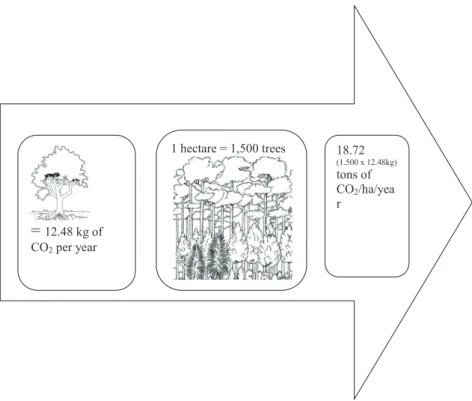
To understand the absorption of greenhouse gases, we had to standardize the hectare measure. To this end, we referred to Lacerda, Couto, Hirota, Pasishnyk e Polizel (2009), who indicates that each tree absorbs 249.60 kg of CO2 over 20 years (thus, per year, 12.48 kg of CO2). Since we consider that 30 trees are planted at every 200 m2 stretch, and that 1.500 trees are planted in one hectare, for a total estimate of hectares restored by the companies, observed by the EN13 indicator released in the GRI report, we multiplied the equivalent annual trapped carbon (Figure 2).
= 12.48 kg of
CO2 per year
1 hectare = 1,500 trees 18.72
(1.500 x 12.48kg) tons of
CO2/ha/yea
r
FIguRe 2 – Illustration of conversion in this research
herefore, considering that a ton of carbon is equivalent to one carbon credit, we conclude that one hectare is equivalent to 18.72 carbon credits.
Finally, to understand values referring to greenhouse gas reductions and associated with EN18, we observed the amount of tons of carbon that ceased to be emitted into the environment.
credits was carried out with the price of € 0.57 per credit and the euro at R$ 3.22, so the carbon credit rate was R$ 1.84 per credit; however, it is worth remembering that, in 2011, these credits reached R$ 36.83.
Identifying the carbon credit generation potential in euros and in reais demanded consideration of costs involved in the project development process, that refer to: 1) the costs that refer to preparing the carbon credit project under the CDM; 2) expenses that refer to the implementation of energy saving projects, namely to energy eiciency.
To calculate the costs of developing a carbon credit project under the CDM, we used the maximum cost of preparing carbon credit projects established by the Brazilian Center for Strategic Studies and Management (CGEE, 2010). Herein is forecast a cost between € 47,000 and € 220,000 (described in Figure 1), encompassing the entire process from the DPP on, validation, approval, registration, monitoring, veriication, certiication and issuance.
To calculate costs referring to the implementation of energy saving projects, we sought the study developed by Eletrobras e Procel (2005), which states that, to generate the economy of one MWh of energy, an € 2.79 to € 8.36 investment in an energy eiciency project is required, and at least € 32.77 for building a conventional power plant. In this study, based on these values, we used the total amount of € 43.92. hrough the stipulated revenues and expenses, we were able to simulate and evaluate the potential beneits of CDM projects presented by companies listed in ISE and ICO2 indicators.
4.3 Analysis of capability of conversion to CDM project beneits
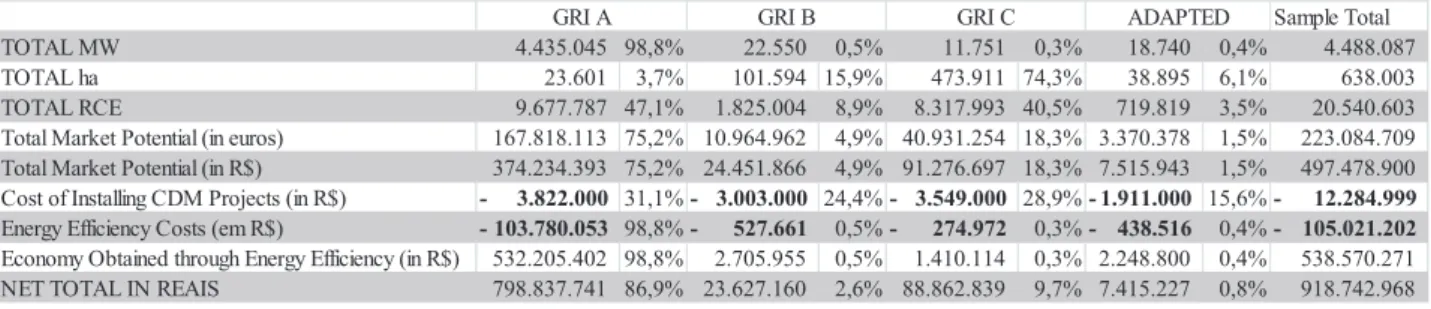
Table 2, below, presents information on energy eiciency, hectares, carbon credits, values, costs and economy, organized according to the diferent levels of adherence to the GRI report.
tABle 2 – Segmentation of the Potential Market in GRI Index ratings and the nature of credits
Sample Total TOTAL MW 4.435.045 98,8% 22.550 0,5% 11.751 0,3% 18.740 0,4% 4.488.087 TOTAL ha 23.601 3,7% 101.594 15,9% 473.911 74,3% 38.895 6,1% 638.003 TOTAL RCE 9.677.787 47,1% 1.825.004 8,9% 8.317.993 40,5% 719.819 3,5% 20.540.603 Total Market Potential (in euros) 167.818.113 75,2% 10.964.962 4,9% 40.931.254 18,3% 3.370.378 1,5% 223.084.709 Total Market Potential (in R$) 374.234.393 75,2% 24.451.866 4,9% 91.276.697 18,3% 7.515.943 1,5% 497.478.900 Cost of Installing CDM Projects (in R$) - 3.822.000 31,1%- 3.003.000 24,4%- 3.549.000 28,9%- 1.911.000 15,6%- 12.284.999 Energy Efficiency Costs (em R$) - 103.780.053 98,8%- 527.661 0,5%- 274.972 0,3%- 438.516 0,4%- 105.021.202 Economy Obtained through Energy Efficiency (in R$) 532.205.402 98,8% 2.705.955 0,5% 1.410.114 0,3% 2.248.800 0,4% 538.570.271 NET TOTAL IN REAIS 798.837.741 86,9% 23.627.160 2,6% 88.862.839 9,7% 7.415.227 0,8% 918.742.968
GRI A GRI B GRI C ADAPTED
Values in reais
We observe, thus, that companies with A or A+ compliance (11 of the 59 companies in the sample) had a 96.2% contribution (R$ 443,822,730) in total volume of potential beneits from CDM projects, represented by the economy obtained from energy eiciency and selling of carbon credits, both resulting from CDM projects; with B or B+ compliance (12 companies), a 0.6% contribution (R$ 2,866,563); with C or C+ compliance (10 companies) that were part of 3% of the total net volume of revenue potential (R$ 13,669,800); and ADAPTED,
compliance have lower participation than those with C/C+ compliance. his fact is interesting because the classiication given by the GRI (A, B and C) depends on the scope of disclosures compared to the requirements of the model developed by it. hus, although the companies in this group (C) belong to the lower level of compliance to that model’s general guidelines, the following companies deserve mention as to the studied information: Brasken, Embraer, Suzano, and Eletropaulo, mainly in the energy eiciency category; we must also point out that maintenance of conservation areas and habitat restoration are compulsory in certain economic activities such as pulp and paper (Suzano) and in electricity companies. he group classiied as “B” is made up of companies such as Ambev, BRFoods and Eletrobras.
Table 2 also presents the value of 98.8% MWh, referring to energy eiciency in companies that published their report in the GRI A/A+ standard, among which the energy, mining and inancial sectors are predominant. he energy eiciency of power sector companies within the A+ group is probably the cause of the diference as to the average of other companies, due to the generated and managed volume.
As to the proportion of total hectares of preserved areas, Table 1 reveals that 74.28% of all the potential divulged by the EN13 indicator (“Protected or restored habitats”) is contained in the group of companies that disclose at applicability level C/C+.
Companies of A and C applicability levels present over 87% of the generation of CERs (in energy eiciency and habitat restoration). Regarding the proportions disclosed at each applicability level, we highlight the values that will be released for carrying out CDM projects. As previously mentioned, we used the value of € 138.116 euros per project (CGEE, 2010), regardless of size, verifying a ratio between the levels of applicability, that is: at level A/A +: 31.11%; at level B/B+: 24.44%; at level C/C+: 28.89%; and at “Adapted”: 15.56%, depending on the number of projects; we observed that the
amount of opportunities for carrying out carbon credit projects is similar between these groups, and that the major diferences are in the volume of CERs that can be obtained at level A/A+ and C/C+, facing B/ B+ and “Adapted”.
Table 2 shows that, in the projects analyzed, there was potential for generating R$ 40,315,572 in CERs (carbon credits), and that the energy efficiency produced by the companies, converted into monetary values, was approximately R$ 538,570,270, considering the amount of electricity that was saved (4,488,086 MW) and its market value (R$ 120.00). In order to understand if energy eiciency, habitat restoration and GHG emission reductions were being efectively converted into carbon credits projects, we carried out some research in the sustainability reports of the same companies, and nothing was found. When research data was being collected, there were no approved carbon credit projects in the evaluated companies.
Importantly, the beneits of CDM projects within the analyzed scope focus on energy eiciency, probably justifying the concentration of investment and disclosure. Over time, carbon credits have lost their signiicance; if, in 2011, one could generate revenue of R$ 497 million in the referred simulation, on December 31, 2014 this amount would be less than 10% in the same scenario.
5 tHe PeRCePtIOnS OF CDM PROCeSS CeRtIFIeRS
In order to strengthen the relationship between theory and practice, and to raise other variables to explain the assessments of sustainability reports, we interviewed representatives from companies and advisor companies that acted as carbon credit project developers and certiiers in Brazil. he idea was to understand why CDM projects – and, consequently, carbon credits – were unsuccessful.
of them were certiied by eight advisor companies (DNV, TUV, SGS, RINA, CVS/BVQI, LRQA, ERMCVS and INCONTEC), and the first three accounted for over 250 projects, therefore revealing a great deal of centralization (MCTI, 2014). All of them are multinational companies. hese were the companies in which we sought to understand the corporate vision of CDM projects and carbon credits.
A questionnaire with ive questions was sent to the mentioned companies, except to ERMCVS, whose address and telephone number could not be found; next, professionals were contacted by phone.
Questions and answers are presented below. Importantly, answers relect the opinions of the respondents, and not the position of the companies for which they work.
5.1 Period of time in which the company has been carrying out carbon credit project consultancy and certiication
In general, companies in the certiication group are centuries-old or come from others of a similar age; are large; are present in several countries and have large networks of collaborators. Generally, they are certifying companies from other ields that have incorporated this branch, and have intensiied it over recent years.
hese companies work, concurrently, with CDM projects, with Certiication Audit Services, with Environmental Management Systems Certiication, with Risk Management, with Food Safety, Classiication, Naval Certiication and Services for the Industry, inspection services, veriication, testing and certiication for industrial products and services in many ields of activity.
The respondents carried out several projects focusing on sustainability. However, the irst carbon credit approval occurred between 1996 and the early 2000s. he years of most intense movement, according to one respondent, were those between 2004 and 2007. Most of the companies started the certiication process
over the same period, that is, they all entered the market when project certiication was recognized.
5.2 As to expectations concerning the carbon market in Brazil and worldwide
Two respondents were conident about the market: they expected returns from negotiations and, therefore, carbon credit valuing. Two were wary about the future of the carbon credit trade. he last said that the current market already satisies the company’s interests. Importantly, at the time of the interview, the market priced the carbon credit at 16 euros, and, on December 31, 2014, at 0.57 euros; therefore, those who were not very conident believed in the continuity of the price reduction trend.
5.3 Corporate overview of energy eiciency projects, habitat restoration and carbon emission reductions that did not result in carbon credits
Respondents were uncomfortable about answering this question. It is clear that operating proits from energy eiciency projects, habitat restoration and carbon emission reductions bring almost immediate returns and generate incentives to them, independently from carbon credits. Moreover, all procedures for the development of carbon credit projects, alongside high investments and long completion periods, added to all other market uncertainties, result in a smaller demand for these projects.
standard that ofers the requirements for energy management systems, energy eiciency itself or carbon emission reductions.
5.4 Main reasons for carrying out carbon credit projects
Three respondents stated that carrying
out carbon credit projects offers additional cash
low, and is a good investment for companies.
The remaining respondents said they can help
mitigate environmental risks by avoiding the
generation of liabilities. Some of them veered
towards environmental responsibility and its
beneits to the market. They were unanimous
about its positive effects on company image.
5.5 Certiications that fall into the social and environmental category
When asking respondents this question, our main interest was to survey best known social and environmental approvals among the advisor companies consulted, and to better understand the relevance of carbon credit project certiication in absolute terms.
In this sense, the most mentioned environmental certiications were: ISO 14000, ISO 14067, PAS 2050, certiications concerning carbon footprints, CDM certifications, development of energy solutions such as energy efficiency processes and ISO 50.001. The interviews directly complemented the indings of documental analysis of sustainability reports, since most of the social and environmental actions carried out by companies observed in ISE and ICO2 focused on energy eiciency measures, which, although they did not add up to carbon credit projects, brought about great and positive environmental impact. Although the respondents expressed positive feelings about the future, some mentioned that the market was declining, a fact that proved to be quite signiicant over the period. Thus, we observed that consulting companies took advantage of the opportunity to include a new service among those they already ofered – emission reduction certiications –;
however, the operational beneits for companies were more positive than the advantages associated with obtaining carbon credits, either because of costs, deadlines or market uncertainties, or because of the lack of a global policy.
6 FInAl COnSIDeRAtIOnS
his paper intended to assess the potential for gaining beneits based on the CDM, including carbon credits, considering information available in the sustainability reports of companies listed in ISE and ICO2 in June 2011. he results were also interpreted with the help of experts in the conversion of GHG emission reductions into carbon credits.
hese results help to bring about awareness as to the operational, social and environmental beneits that energy eiciency measures and habitat protection can generate. his should therefore be encouraged by both the government and the business segment, since Brazil is committed to sustainable development and to the reduction of greenhouse gas emissions by 36.1% as established in the National Climate Change Policy.
Results revealed that companies listed in ISE and ICO2 had potential to obtain approximately 40.3 million reais (about 12.5 million euros) in carbon credits; however, we found, through sustainability reports and the Ministry of Science, Technology and Innovation, that the conversion of GHG reductions into carbon credits did not occur. he companies were restricted to gains generated by energy eiciency, which, in itself, could lead to a inancial return of R$ 538.5 million. In order to obtain the additional economic beneits, they had to face high costs and bureaucracy to have their GHG reductions recognized for the issuance of CERs (carbon credits), also taking into account the instability of the market in which these securities are traded. he aforementioned costs can vary from 47.000 to 220.000 euros.
Experts in the conversion of GHG emission reductions into carbon credits, consulted for better understanding of results, said in the interviews that the costs and time involved in overcoming the bureaucratic procedures inherent to achieving reductions certiicates are discouraging. Companies have chosen to apply the money involved in new certiications that meet requirements for services to remain on the market. hey highlighted the advantages of projects developed under the CDM assumptions, which bring beneits to the community as a whole and also to the business itself, either through cost savings or through the positive impact on the company’s image.
his study contributes to indings and evidence concerning the efective inancial or environmental benefits of implementation and completion of CDM projects. he results
demonstrate that potential benefits are very relevant and deserve encouragement to raise awareness about the advantages of the CDM, both in terms of direct and indirect economic gains, regarding companies’ images as well as the collective beneits of a sustainable and clean environment. Additionally, there are economic potentials to be explored and income distribution to be ofered for the implementation of these referred potentials.
It contributes, too, by highlighting the importance of public policies concerning this issue. Public policies for environmental cost-beneit analysis should be assessed and improved in order to reduce the obstacles for compliance by as many companies as possible, because, to the extent that there is compensation, at a smaller cost and facing less bureaucracy, more companies will help preserve the environment and its conditions for sustainability. he potential for GHG emission reduction must be increasingly encouraged.
he carbon market has a new deadline target, established among countries committed to GHG reductions: 2020, which can be a stimulus towards CDM project continuity. There is sufficient time for overcoming the inancial crises and receiving the beneits from the scientiic and technological developments. What is truly important is the opportunity for possible combinations of factors that can lead to sustainability, which, as demonstrated by this research, carbon credits are only a part of.
he limiting factors in this research result from a data availability constraint, which explains why certain study variables were estimated.
ReFeRenCeS
Agência Nacional de Energia Elétrica (2015). Relatórios do sistema de apoio à decisão. Recovered from: www.aneel.gov.br/area.cfm?idArea=550.
performance: An empirical analysis in Wales International. Journal of Operations and Production Management.33(8), 981-1018.
Centro de Gestão de Estudos Estratégicos. (2010). Manual de capacitação : Mudança climática e projetos de mecanismo de desenvolvimento limpo. Recovered from http://www.cgee.org.br/publicações/ mudancadoclima.php
Costa, A., Jr., Pasini, K., & Andrade, C. (2013). Clean Development Mechanism in Brazil: an instrument for technology transfer and the promotion of cleaner technologies? Journal of Cleaner Production. 46, 67-73.
Das, D., & Sengupta, P. (2011). Social cost of environmental pollution and application of counter measures through clean development mechanism: in the context of developing countries, Environment. Development and Sustainability, 13, (5), 833-844. doi.org/10.1007/ s10668-011-9293-9
Davis, S., Lukomnik, J., & Pitt-Watson, D. (2008). Os novos capitalistas: a inluência dos investidores-cidadãos nas decisões das empresas. Rio de Janeiro: Elsevier.
Decreto n. 7.390, de 9 de dezembro 2010. (2010). Regulates arts. 6o, 11 e 12 from Law n. 12.187, December, 2009, that establish Política Nacional sobre Mudança do Clima - PNMC, and others measures. Recovered from http://www.planalto. gov.br/ccivil_03/_Ato2007-2010/2010/Decreto/ D7390.htm
Eletrobrás, Procel. Gestão energética: Guia técnico. Rio de Janeiro, 2005. Recovered from htpp://arquivos. Portaldaindustria.com. br/app/conteudo_18/2014/04/22/6281/ GuiaGestaoEnergtia.pdf
Elkington, J. (1994). Towards he Sustainable Corporation: Win-Win-Win Business Strategies, For Sustainable Development. California Management Review, 36(2), 90-100.
Fearnside , P.M. (2013) What is at stake for Brazilian Amazonia in the climate negotiations. In Climatic Change. 118 (3), 509–519.
Gomes, G. A., Gonçalves, C. A., Pardini, D. J., & Muniz, R. M. (2010). Responsabilidade Socioambiental Corporativa e Indicador de Maturidade Mediando Desempenho Estratégico para as Organizações. In Revista de Ciências da Administração. 12 (26), 244-269, Recovered from https://periodicos.ufsc.br/index.php/adm/article/ view/2175-8077.2010v12n26p244/17411. Access on 03/19/2015
Hepburn, C. (2010). Enviromental Policy, Government and the Market. Oxford Review of Economic Policy, 26(2), 117-136. Recovered from http://oxrep.oxfordjournals.org/content/26/2/117. full.pdf+html..
Irffi, G., Ferreira, R. T., & Linhares, F. C. (2013) Mercado de Carbono Pós-Quioto: Cotas de Emissão Apenas para os Países Desenvolvidos? In Revista Economia. 14(1c), 587-606. Recovered from http://www.anpec.org.br/ revistaeletronica/14c/#/27/zoomed
Kolk, A., Levy, D., & Pinkse, J. (2008). Corporate responses in an emerging climate regime: The nstitutionalization and commensuration of carbon disclosure. European Accounting Association, 17(4), 719-745.
Lacerda, J. S., Couto, H.T. Z., Hirota, M.M., Pasishnyk, N., & Polizel, L. (2009). Estimativa de Biomassa e Carbono em Áreas Restauradas com Plantio de Essências Nativas. METRVM - Emendabis Mensvram Silvarvm. (5). Recovered from http://cmq.esalq.usp.br/wiki/doku. php?id=publico:metrvm:start
Mecanismo de Desenvolvimento Limpo (MDL) no Brasil e no Mundo. Recovered from http://www. mct.gov.br/upd_blob/0232/232099.pdf
Nossa, V., Nunes, J. G., Teixeira, A. J. C., & Galdi, F. C. (2010). Análise das variáveis que inluenciam a adesão das empresas ao índice BM&F BOVESPA da sustentabilidade empresarial. Revista da Administração e Contabilidade Unisinos, 7(4), 328-340, 2010. Recovered from http://www.base. unisinos.br/index.php?e=8&s=9&a=113.
Pearce, D. (2003). he social cost of carbon and its policy implications. Oxford Review of Economic Policy, 19(3), Recovered from http:// www.climateactionproject.com/docs/SOCIAL_ COST_OF_CARBON.pdf
Poudyal, N. C., Siry, J. P., & Bowker, J. M. (2012). Stakeholders’ Engagement in Promoting Sustainable Development: Businesses and Urban Forest Carbon. In Business Strategy and the Environment. Business. Strategy and the Environment. 21, 157–169.
Puppim De Oliveira, J. A., Dolll, C. N., Kurniawan, T. A., Gebg, Y., Kapshe, M., & Huisingh, D. (2013). Promoting win–win situations in climate change mitigation, local environmental quality and development in Asian cities through co-beneits. Journal of Cleaner Production, 58, 1-6.
Rover, S., Borba, J. A., & Murcia, F. D. R. (2009). Características do Disclosure Ambiental de Empresas Brasileiras Potencialmente Poluidoras: Análise das demonstrações Financeiras e dos Relatórios de Sustentabilidade do período de 2005 a 2009. Contextus: Revista Contemporânea de economia e gestão, 7(1), 23-36.
Rover, S., & Murcia, F. D. R. (2010, June). Inluencia do disclosure voluntário econômico e socioambiental no custo de capital próprio de empresas brasileiras. Congress Anais ANPCONT, Natal, RN, Brazil, 4.
Segreti, J. B., & Bito, N. S. (2006). Crédito de Carbono: Um Estudo de Caso da Empresa NovaGerar. Revista Brasileira de Gestão de Negócios- RBGN. São Paulo. 8(21), 82-91. Recovered from http://rbgn.fecap.br/RBGN/article/ view/63.
Silva, A. C., Jr. (2011). Projetos de Mecanismo de Desenvolvimento Limpo (MDL): promotores de transferência de tecnologia e tecnologias mais limpas no Brasil. Doctor Tese Universidade Federal da Bahia, 2011. Recovered from http:// www.pei.ufba.br/novo/uploads/biblioteca/Tese_ MDL_Versao_Final.pdf.
Silva, L. S., Freire, W. R., Jr., & Basseto, L. I. (2012). Mercado de Carbono e Instituições: Oportunidades na Busca por um Novo Modelo de Desenvolvimento. In Interciência. 37(37). Souza, A. L., Paiva, D. S., Andrade, J. C. S., Silva, A. C., Jr., & Goulart, R. C. (2012). O Mercado Internacional de Créditos de Carbono: Eestudo Comparativo entre as Vertentes Regulada e Voluntária no Brasil no Período de 2004 a 2011. Revista Eletrônica Sistemas & Gestão. 7(4), 526-544. Recovered from http://www.revistasg.uf.br/ index.php/sg/article/viewFile/V7N4A2/V7N4A2