© FECAP
RBGN
Received on
September 04, 2015
Approved on
December 09, 2015
1.Iná Futino Barreto
Doctor in Administration FEA / USP
(Brazil)
2.Edson Crescitelli
Doctor in Administration FEA / USP
(Brazil)
3.Júlio César Bastos Figueiredo
Doctor in Physical IFUSP / USP (Brazil)
Review of Business Management
DOI:10.7819/rbgn.v17i58.2692
Relationship Marketing results:
proposition of a cognitive mapping model
Iná Futino Barreto, Edson Crescitelli
Graduate program in Business Administration, Faculty of Economics, Management and Accounting, Universidade de São Paulo, SP, Brazil
Júlio César Bastos Figueiredo
Master and Doctorate Program in International Management, Escola Superior de Propaganda e Marketing, SP, Brazil
Responsible editor: Guilherme de Farias Shiraishi, Dr. Evaluation process: Double Blind Review
REsuMo
objetivo – his research sought to develop a cognitive model that expresses how marketing professionals understand the relationship between the constructs that deine relationship marketing (RM). It also tried to understand, using the obtained model, how objectives in this ield are achieved.
Método – hrough cognitive mapping, we traced 35 individual mental maps, highlighting how each respondent understands the interactions between RM elements. Based on the views of these individuals, we established an aggregate mental map.
Fundamentação teórica - he topic is based on a literature review that explores the RM concept and its main elements. Based on this review, we listed eleven main constructs.
Resultados – We established an aggregate mental map that represents the RM structural model. Model analysis identiied that CLV is understood as the inal result of RM. We also observed that the impact of most of the RM elements on CLV is brokered by loyalty. Personalization and quality, on the other hand, proved to be process input elements, and are the ones that most strongly impact others. Finally, we highlight that elements that punish customers are much less efective than elements that beneit them.
Contribuições – he model was able to insert core elements of RM, but absent from most formal models: CLV and customization. he analysis allowed us to understand the interactions between the RM elements and how the end result of RM (CLV) is formed. his understanding improves knowledge on the subject and helps guide, assess and correct actions.
1 IntRoduCtIon
In a scenario that is highly competitive and reveals rapid erosion of competitive advantages based on products, relationship marketing (RM) emerges as an alternative way of developing superior value by understanding customer needs and ofering products that are suitable to each individual customer. RM is actually a set of practices that aim to guide companies towards an understanding of their customer bases (in the most individual way possible) and towards adjustment of supply, so as to retain current customers (Gordon, 1998; Vavra, 1993).
However, RM actions require large investments. It is necessary to adapt organizations to receive, store and disseminate customer information (Gordon, 1998; Vavra, 1993); to develop ways of adapting supply to customer needs (Gordon, 1998; McKenna, 1992); and, perhaps the most complex and profound efort of all, to change the focus and culture of companies, transforming them into companies that are focused on relationships (Vavra, 1993). hese changes are only justiied if companies can get back all the beneits that RM actions can bring. And, for this to be so, we need clear understanding of how these results can be achieved.
herefore, it would be adequate to develop a model that reflects the various constructs involved in RM activities and their relationships with each other. A formal model of relationship marketing is useful to visualize the elements that make up RM, the interactions between them and the results of this activity. Only through deep understanding of how RM activities’ actions’ results are achieved can these actions be properly guided and, moreover, assessed and corrected.
There are several methodological possibilities for developing an RM model. Here, we chose to use a cognitive mapping method. The focus is, therefore, on identifying how stakeholders involved with the relationship activity understand its dynamics so as to, based
on the cognitive models of various stakeholders, map a possible RM model.
hus, the objectives of this research are: (a) to identify, through a systemic approach, the interactions between the elements that make up the main results of relationship marketing, especially CLV, according to the vision of the surveyed professionals, and (b) to propose an aggregate cognitive map that represents the overview of the surveyed individuals as to how CLV is formed through the interaction between relationship marketing elements.
2 RElAtIonshIP MARkEtIng
RM is a set of practices that aim to retain current customers through narrowing of the company-customer relationship. To this end, it is necessary to be able to identify each of the individual customers, to sustain with them a constant, two-way dialogue and, through the accumulated information provided, to adapt supplies to the needs expressed by customers (Gordon, 1998; Vavra, 1993).
However, in order to justify companies’ engagement in RM, it is crucial that they perceive solid results. herefore, a irst step in the analysis of the RM activity is understanding what results it may bring.
than customers who are not loyal, due to their increased Customer Lifetime Value, or CLV.
herefore, here we understand customer loyalty and the increase in their CLV as the main results of the RM activity. However, CLV is highlighted as a second-degree result, or as a later consequence of loyalty in the following sequence: RM elements → loyalty → CLV. hus, we understand that there is in fact one great end RM result: CLV. his end result is in turn brokered by loyalty.
Having defined the main objective of RM actions, we must then identify which initial customer-company relationship assessment elements could, together, lead to its end results. As we said before, however, although CLV
is understood as the end of the process, it is highlighted as a second-degree result, or as later consequence of loyalty. herefore, in order to identify which initial elements of RM lead to its end results, we need to understand how loyalty is formed.
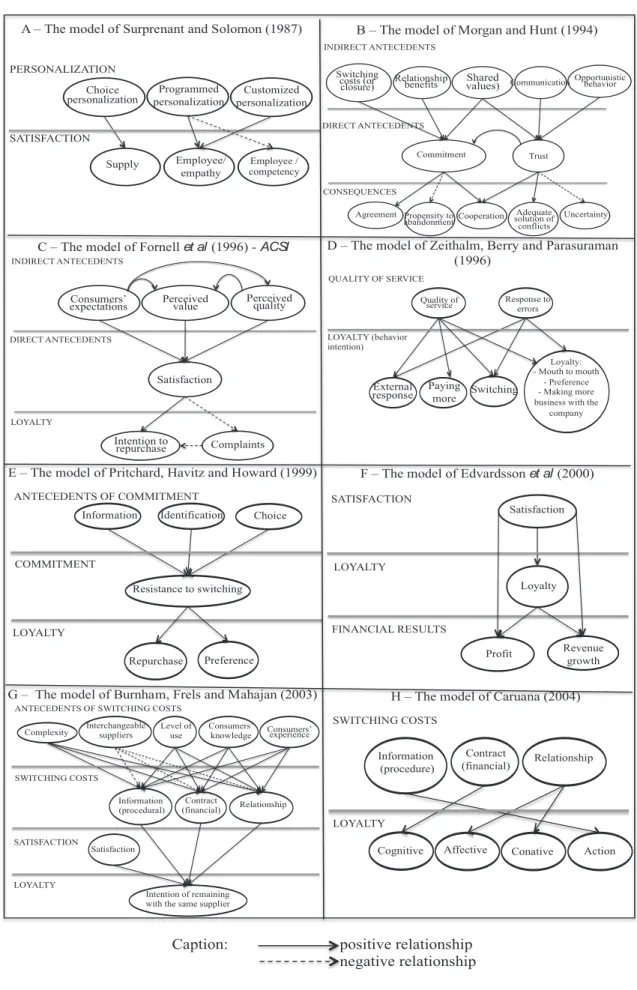
Figure 1
–
Main models surveyed on the subject of loyalty
A – The model of Surprenant and Solomon (1987)
D – The model of Zeithalm, Berry and Parasuraman (1996)
E – The model of Pritchard, Havitz and Howard (1999) F – The model of Edvardsson et al (2000)
Caption: positive relationship negative relationship
B – The model of Morgan and Hunt (1994)
C – The model of Fornell et al (1996) - ACSI
G – The model of Burnham, Frels and Mahajan (2003) H – The model of Caruana (2004)
PERSONALIZATION SATISFACTION Choice personalization Programmed personalization Customized personalization
Supply Employee/ empathy Employee / competency INDIRECT ANTECEDENTS DIRECT ANTECEDENTS CONSEQUENCES Switching costs (or
closure) Relationship benefits
Shared
values) Communication Opportunistic behavior
Commitment Trust
Agreement Propensity to
abandonment Cooperation Uncertainty
Adequate solution of conflicts INDIRECT ANTECEDENTS DIRECT ANTECEDENTS LOYALTY Perceived quality Perceived value Consumers’ expectations Satisfaction Complaints Intention to repurchase Interchangeable suppliers Level of use Complexity SWITCHING COSTS
ANTECEDENTS OF SWITCHING COSTS
Consumers’
knowledge Consumers’ experience
Contract
(financial) Relationship
Information (procedural)
SATISFACTION
LOYALTY
Satisfaction
Intention of remaining with the same supplier
Affective Conative Cognitive
Contract
(financial) Relationship Information
(procedure)
LOYALTY
SWITCHING COSTS
Action Resistance to switching
Information
COMMITMENT
ANTECEDENTS OF COMMITMENT
Repurchase LOYALTY
Preference
Identification Choice Satisfaction
LOYALTY SATISFACTION Profit FINANCIAL RESULTS Revenue growth Loyalty Quality of service LOYALTY (behavior intention)
QUALITY OF SERVICE
Response to errors
Loyalty: - Mouth to mouth
- Preference - Making more business with the
company Switching Paying more External response
Figure 2
–
Main models surveyed on the subject of loyalty
M – The model of Ball, Coelho and Vilares (2006) N – The model of Jones et al (2007)
P – The model of Tong, Wong and Lui (2012)
Caption: positive relationship negative relationship
L – The model of Fullerton (2005) J – The model of Baptista (2005)
K – The model of Brei and Rossi (2005)
I – The model of Lam et al (2004)
O – The model of Ranjbarian et al (2012)
Calculative Affective
Loss of benefits
(financial) Of relationship Procedure
COMMITMENT SWITCHING COSTS
Positive emotions EMOTIONS
Negative mouth to mouth Intention to
purchase RESPONSES
Negative emotions Product
quality
COMMITMENT
Repurchase LOYALTY
Mouth to mouth
Available options
Of continuity (calculative) Affective
Treatment of complaints DIRECT ANTECEDENTS
Loyalty Communi
-cation Satisfaction
Personali- zation Trust Perceived
quality INDIRECT
ANTECEDENTS
Perceived
value Expectations Image
Personalization
LOYALTY
Loyalty
Satisfaction Switching costs LOYALTY
Loyalty
Satisfaction Commitment
Trust Quality
Perceived value
CONSEQUENT ANTECEDENTS
Loyalty Perceived value
Trust LOYALTY
ANTECEDENTS
Indication Satisfaction
Preference Perceived
value Switching costs
LOYALTY ANTECEDENTS
Satisfaction
Repurchase Perceived
quality
Brand image
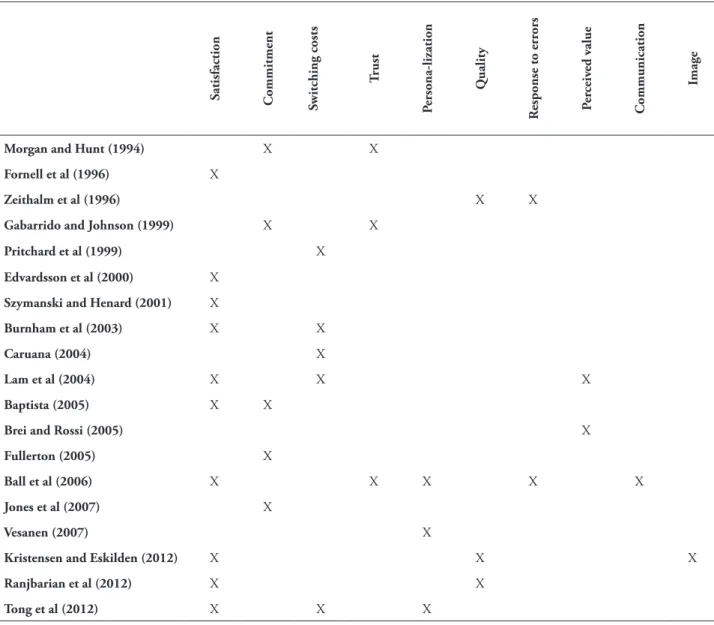
tABlE 1 – Meta-analysis of antecedents with a direct impact on loyalty
s
atisfaction
Commitment switching costs
t
rust
P
ersona-lization
Q
uality
R
esponse to err
ors
P
er
ceiv
ed v
alue
Communication
Image
Morgan and hunt (1994) X X
Fornell et al (1996) X
Zeithalm et al (1996) X X
gabarrido and Johnson (1999) X X
Pritchard et al (1999) X
Edvardsson et al (2000) X
szymanski and henard (2001) X
Burnham et al (2003) X X
Caruana (2004) X
lam et al (2004) X X X
Baptista (2005) X X
Brei and Rossi (2005) X
Fullerton (2005) X
Ball et al (2006) X X X X X
Jones et al (2007) X
Vesanen (2007) X
kristensen and Eskilden (2012) X X X
Ranjbarian et al (2012) X X
tong et al (2012) X X X
In Table 1, we can observe that, among the elements with a direct impact on loyalty, the most mentioned are satisfaction, quality, commitment, trust, personalization and switching costs. hese are, then, the initial RM elements considered potential paths towards loyalty.
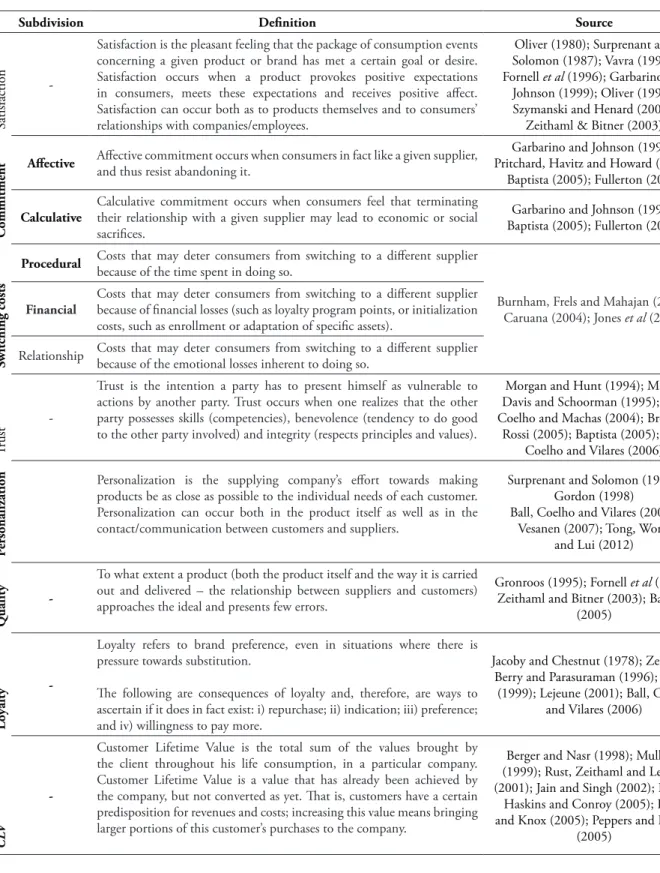
To analyze the relationships between RM elements it is also necessary to have a clear deinition of each construct. For this reason, based on extensive analysis of existing literature, Table 2 presents the deinition of how each element in this study was understood.
We should note that certain activities referring to RM, especially Customer Relationship
tABlE 2 – List of considered constructs
subdivision deinition source
Satisfaction
-Satisfaction is the pleasant feeling that the package of consumption events concerning a given product or brand has met a certain goal or desire. Satisfaction occurs when a product provokes positive expectations in consumers, meets these expectations and receives positive afect. Satisfaction can occur both as to products themselves and to consumers’ relationships with companies/employees.
Oliver (1980); Surprenant and Solomon (1987); Vavra (1993);
Fornell et al (1996); Garbarino and
Johnson (1999); Oliver (1999); Szymanski and Henard (2001);
Zeithaml & Bitner (2003)
Commitment
Afective Afective commitment occurs when consumers in fact like a given supplier, and thus resist abandoning it.
Garbarino and Johnson (1999); Pritchard, Havitz and Howard (1999);
Baptista (2005); Fullerton (2005)
Calculative
Calculative commitment occurs when consumers feel that terminating their relationship with a given supplier may lead to economic or social sacriices.
Garbarino and Johnson (1999); Baptista (2005); Fullerton (2005)
switching costs
Procedural Costs that may deter consumers from switching to a diferent supplier because of the time spent in doing so.
Burnham, Frels and Mahajan (2003); Caruana (2004); Jones et al (2007) Financial
Costs that may deter consumers from switching to a diferent supplier because of inancial losses (such as loyalty program points, or initialization costs, such as enrollment or adaptation of speciic assets).
Relationship Costs that may deter consumers from switching to a diferent supplier because of the emotional losses inherent to doing so.
T
rust
-Trust is the intention a party has to present himself as vulnerable to actions by another party. Trust occurs when one realizes that the other party possesses skills (competencies), benevolence (tendency to do good to the other party involved) and integrity (respects principles and values).
Morgan and Hunt (1994); Mayer, Davis and Schoorman (1995); Ball, Coelho and Machas (2004); Brei and
Rossi (2005); Baptista (2005); Ball, Coelho and Vilares (2006)
P
ersonalization
Personalization is the supplying company’s efort towards making products be as close as possible to the individual needs of each customer. Personalization can occur both in the product itself as well as in the contact/communication between customers and suppliers.
Surprenant and Solomon (1987); Gordon (1998) Ball, Coelho and Vilares (2006);
Vesanen (2007); Tong, Wong and Lui (2012)
Q
uality
-To what extent a product (both the product itself and the way it is carried out and delivered – the relationship between suppliers and customers) approaches the ideal and presents few errors.
Gronroos (1995); Fornell et al (1996);
Zeithaml and Bitner (2003); Baptista (2005)
lo
yalty
-Loyalty refers to brand preference, even in situations where there is pressure towards substitution.
he following are consequences of loyalty and, therefore, are ways to ascertain if it does in fact exist: i) repurchase; ii) indication; iii) preference; and iv) willingness to pay more.
Jacoby and Chestnut (1978); Zeithalm, Berry and Parasuraman (1996); Oliver
(1999); Lejeune (2001); Ball, Coelho and Vilares (2006)
C
LV
-Customer Lifetime Value is the total sum of the values brought by the client throughout his life consumption, in a particular company. Customer Lifetime Value is a value that has already been achieved by the company, but not converted as yet. hat is, customers have a certain predisposition for revenues and costs; increasing this value means bringing larger portions of this customer’s purchases to the company.
Berger and Nasr (1998); Mulhern (1999); Rust, Zeithaml and Lemon (2001); Jain and Singh (2002); Pfeifer,
Haskins and Conroy (2005); Ryals and Knox (2005); Peppers and Rogers
(2005)
3 FIEld REsEARCh MEthod
In order to achieve the outlined goals, we chose to develop a model obtained through cognitive mapping. Despite the diferent uses
mapping is understood as the representation of the understanding of an individual concerning a researched subject.
Causal maps are particularly a subtype of cognitive map focused specifically on identifying constructs that have causal relationships with each other. Causal maps are widely used to capture the understanding of managers and researchers (Markóczy, 1994) and can be very useful for risk analysis, for developing strategy and construction research or theory testing (Markóczy & Goldberg, 1995; Scavarda et al, 2004).
3.1 stages of the causal mapping process
he irst step in the development of a causal map is identiication of constructs referring to the subject to be studied; in the case of this study, RM constructs and their end results. It is important to ensure that all constructs are clearly deined, so that they may be understood in the same way by everyone. he second step is presentation of the constructs, listed for the experts who are to be interviewed and will point out the relationships between them (Bouzdine-Chameeva, 2005; Clarkson & Hodgkinson, 2005; Markóczy & Goldberg, 1995; Scavarda, Bouzdine-Chameeva, Goldstein, Hays, & Hill, 2005). Next, the individual maps of respondents are developed (Bouzdine-Chameeva, 2005; Clarkson & Hodgkinson, 2005; Markóczy & Goldberg, 1995); Finally, we present a consolidated map of all respondents (Bouzdine-Chameeva, 2005; Scavarda et al., 2005). he sequence of stages is presented in Table 3.
tABlE 3 – Stages of research
1 Research of list of constructs referring to RM and its results
2 Selection of experts to be interviewed
3 Identiication of connecting arcs between constructs e signs of causality
4 Creation of individual maps
5 Creation of an aggregated map
For the irst step, the main techniques mentioned for researching constructs are the
following: formal or informal brainstorming (Andersen & Richardson, 1997), web research techniques (Scavarda, 2004), individual interviews (Bouzdine-Chameeva, 2005; Bouzdine-Chameeva & Durrieu & Mandj́k, 2001; Eden, 1988), or document analysis and analysis of existing theory (Bouzdine-Chameeva et al., 2001; Markóczy, 1994).
In this study we followed the proposal of Markóczy (1994): using existing theory analysis, we developed a pre-deined list of constructs, which was then presented to respondents along with a brief explanation about each construct (as observed in Table 2). Using a pre-deined list, according to the author, allows all respondents to work with the same universe of constructs and, more importantly, to understand all the indicated constructs in the same way.
he list was developed in two stages. First, we created an initial list according to existing theory analysis (Table 2). hen, that list was presented to two experts in the ield for content validation (namely, to a scholar with articles published in magazines classiied as A1 or A2 by CAPES’ Qualis system on the subject RM; and a market expert, a consultant involved in RM, whose agency was awarded the best agency of the year in CRM/DBM: a prize awarded by the Brazilian Association of Direct Marketing/ ABEMD). We asked the experts to verify whether they felt any constructs were missing and should be added to the list, if they correctly understood the meaning of all listed constructs and if they believed that any of the presented constructs should be joined to another. hus, we validated the list with 11 constructs presented in Table 2, which was then used in the interviews.
However, there was no control to ensure the same amount of responders in each group.
To select the companies (and individuals) who would be targeted by the research, we considered, at irst, RM service providers who are most remembered by Brazilian companies, according to research published by the Portal Do Mundo do Marketing (2013). hey are as follows: Market Data; he Group; Accentiv’Mimética; Expertise; Casa Nova; Omnion; Rapp Digital; CSU; Total On Demand; E/OU. We contacted the directors, partners and/or presidents of each of these companies. Of these, six agreed to participate. From then on, we asked each respondent to suggest other names who were intensely focused on RM (Snowball technique). At the end, we had contacted 82 potential respondents, of which 35 actually participated in the study, as shown in Table 4 (in the Table, information that, at the request of respondents, had to be omitted, was replaced by XX).
Steps 3 and 4 (Identiication of connecting arcs between constructs and Creation of individual maps) were carried out simultaneously. Since this research works with prior establishment of a list of constructs, listing the arcs was done using that same list. Despite the many proposed procedures that are present in theory, this study
approaches what was presented by Markóczy (1994), Markóczy and Goldberg (1995) and Bouzdine-Chameeva et al (2001). To define which constructs (nodes) will be in the causal map, the authors suggest that respondents are requested to select, among the listed constructs, those they deem most important to the topic that is being studied. Markóczy (1994) and Markóczy and Goldberg (1995) suggest that respondents select the 10 most relevant constructs. Bouzdine-Chameeva et al (2001) limit the choice of respondents to a total 20 to 40 constructs. Crescitelli and Figueiredo (2010), who conducted a study based on the methodology proposed by Markóczy and Goldberg (1995), also work with a total 10 constructs selected by respondents.
In this project, however, since there are only 11 listed constructs, all were compulsorily used by the respondents. Since 11 constructs is a value that is very close to the lowest number of constructs used by the authors we consulted, the risk of the ield procedure becoming excessively dull and time consuming is very small, and, at the same time, there is no forced exclusion of relevant constructs. If there were constructs that respondents judged as not having any impact on others, all they had to do was not point out any links to them.
tABlE 4 – List of respondents
Company position category focus service/good
XX Autonomous third sector professional manager B2B service
E/OU Director - Business Development Director consultant/agency B2C service
Boanerges & Cia President consultant/agency B2B/B2C service Peppers Senior Consultant consultant/agency B2B service
NetPoints Vice-President/Partner manager B2B/B2C service
Indico; ESPM; ABEMD;
LABSSJ Director; Professor consultant/agency B2B/B2C service
IBM Smarter Commerce & Distribution Executive manager B2C service
Omnioin President consultant/agency B2B/B2C service
CSU Market System; FGV; ABEMD
Chief Operating Oicer; Professor; Council
Member consultant/agency B2C service
XX Professor; CRM Manager scholar and manager B2C service
ABEMD Director; ABEMD Course Coordinator consultant/agency and
Company position category focus service/good MasterCard Vice-President Loyalty Solution manager B2C service
XX Head of FIHL Consultant Team consultant/agency B2B service
Smiles Vice-President manager B2C service
he Group Partner consultant/agency B2C service
XX Director/ Partner consultant/agency B2B/B2C service
XX Analytics Controller; Professor manager and scholar B2B service USP Professor scholar B2B/B2C service
Markestrat; FGV Partner; Professor consultant/agency and
scholar B2C
service
Smiles President manager B2B/B2C service
PUC Professor scholar B2B/B2C service
Loyalty; FGV Director; Professor consultant/agency and
scholar B2C
service
XX CRM Manager manager B2B service
XX CEO consultant/agency B2B service
Saraiva Customer director manager B2C service
Horux Consultoria e
Treinamento Ltda; ESPM CEO; Professor
consultant/agency and
scholar B2C
service
Natura CRM Director manager B2C good
Múltiplos President manager B2B/B2C service Papsolutions CEO consultant/agency B2B/B2C service
ESPM Coordinator Stricto Sensu Postgraduate
courses scholar B2C
service
CSU Market System Strategic Planning Head consultant/agency B2B/B2C service
XX Director manager B2C service
XX Latin America Product Director; Professor manager and scholar B2B/B2C service
XX Senior Diretor of CRM Products Latin
America manager B2B/B2C
service
XX Account Executive
Professor manager and scholar B2B/B2C service
hus, all respondents were given a list of constructs (as shown in Table 2); next, the interviewer presented and discussed each element with the respondent. After ensuring that there were no doubts, respondents were asked to evaluate the direct inluence of construct 1 on construct 2, in order to identify the relationship links between the constructs. If the respondent indicated that there was an inluence, he was asked about the strength of this inluence in a scale of -5 (strong negative inluence) to +5 (strong positive influence). To present the ordered pairs, we developed supporting software which presented the constructs under analysis randomly – software implemented in C from algorithms developed by Goldberg (1996).
this type of aggregation, the average map would have to have, in all, 109 links, which would make it confusing and ineicient for understanding the main relationships. Another possibility is to consider only the links listed by at least a given number of respondents, for example, those listed by at least half of the respondents. In this case, however, deinition of what is the limit to be considered (10%, 40% or 50% of respondents) would be arbitrary.
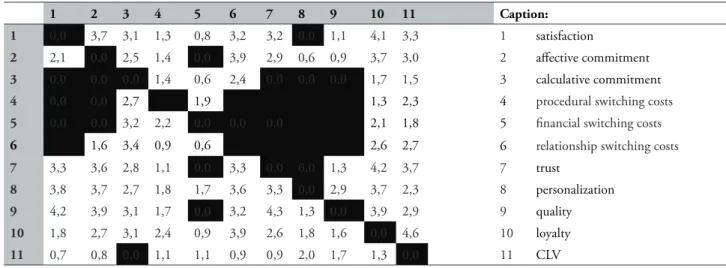
To solve this situation, one possibility would be to consider only the links that presented statistical signiicance. So, we then carried out a t-test with each of the average links and considered only those which – with a 0.05 signiicance level – were diferent from 0. hus, excluding the non-signiicant ones, the number of links considered in the average map was reduced to 83, as shown in Table 5.
tABlE 5 – Average of all links with at least 0,05 signiicance in relationship averages
. 1 2 3 4 5 6 7 8 9 10 11 Caption:
1 0,0 3,7 3,1 1,3 0,8 3,2 3,2 0,0 1,1 4,1 3,3 1 satisfaction
2 2,1 0,0 2,5 1,4 0,0 3,9 2,9 0,6 0,9 3,7 3,0 2 afective commitment
3 0,0 0,0 0,0 1,4 0,6 2,4 0,0 0,0 0,0 1,7 1,5 3 calculative commitment
4 0,0 0,0 2,7 0,0 1,9 0,0 0,0 0,0 0,0 1,3 2,3 4 procedural switching costs
5 0,0 0,0 3,2 2,2 0,0 0,0 0,0 0,0 0,0 2,1 1,8 5 inancial switching costs
6 0,0 1,6 3,4 0,9 0,6 0,0 0,0 0,0 0,0 2,6 2,7 6 relationship switching costs
7 3,3 3,6 2,8 1,1 0,0 3,3 0,0 0,0 1,3 4,2 3,7 7 trust
8 3,8 3,7 2,7 1,8 1,7 3,6 3,3 0,0 2,9 3,7 2,3 8 personalization
9 4,2 3,9 3,1 1,7 0,0 3,2 4,3 1,3 0,0 3,9 2,9 9 quality
10 1,8 2,7 3,1 2,4 0,9 3,9 2,6 1,8 1,6 0,0 4,6 10 loyalty
11 0,7 0,8 0,0 1,1 1,1 0,9 0,9 2,0 1,7 1,3 0,0 11 CLV
Even so, however, the number of links is quite large. Furthermore, there are links with very low values. For example, the link between construct 3 – “calculative commitment” – and construct 5 – “financial switching costs” – is only 0.6. Considering that the scale ranged from -5 to +5, this means that the impact of “calculative commitment” on “financial switching costs” is small.
Thus, it is useful to exclude from the average map links with very low values, in order to consider only the relationships that are not simply signiicant, but also strong. It was necessary, therefore, to establish a criterion for the cut-of point to be considered. he criteria we established was, then, to list links that, with a signiicance level of at least 0.05, have a modulus that is equal or superior to 3. We established the value 3 because it is the median in the range of
5 possible points of link intensity. hus, we got to the average map with only 17 links. hese are exactly the strongest and most signiicant links mentioned by respondents.
4 AnAlysIs oF REsults
We consolidated the visions of the 35 experts who were interviewed and, on based on this, designed a cognitive map that represents the overview of all the individuals analyzed. his aggregate map is here called the “average map.”
the title numbers of rows and columns. A non-zero number in the matrix body means there is
a link between the construct of that line (cause) and the construct of that column (efect).
tABlE 6 – Average map association matrix
1 2 3 4 5 6 7 8 9 10 11 Caption:
1 0,0 3,7 0,0 0,0 0,0 0,0 0,0 0,0 0,0 4,1 0,0 1 satisfaction
2 0,0 0,0 0,0 0,0 0,0 3,9 0,0 0,0 0,0 3,7 0,0 2 afective commitment
3 0,0 0,0 0,0 0,0 0,0 0,0 0,0 0,0 0,0 0,0 0,0 3 calculative commitment
4 0,0 0,0 0,0 0,0 0,0 0,0 0,0 0,0 0,0 0,0 0,0 4 procedural switching costs 5 0,0 0,0 0,0 0,0 0,0 0,0 0,0 0,0 0,0 0,0 0,0 5 inancial switching costs
6 0,0 0,0 0,0 0,0 0,0 0,0 0,0 0,0 0,0 0,0 0,0 6 relationship switching costs
7 0,0 3,6 0,0 0,0 0,0 0,0 0,0 0,0 0,0 4,2 3,7 7 trust
8 3,8 3,7 0,0 0,0 0,0 3,6 0,0 0,0 0,0 3,7 0,0 8 personalization
9 4,2 3,9 0,0 0,0 0,0 0,0 4,3 0,0 0,0 3,9 0,0 9 quality
10 0,0 0,0 0,0 0,0 0,0 3,9 0,0 0,0 0,0 0,0 4,6 10 loyalty
11 0,0 0,0 0,0 0,0 0,0 0,0 0,0 0,0 0,0 0,0 0,0 11 CLV
Through analysis of the average map (Figure 2), we irst observed that there is no kind of link – feedback situations (Pidd, 2001), nor ampliier, nor self-control. he absence of links means that there is no kind of strong feedback on the system.
here are also prominent points regarding nodes and links. Accordingly, first of all, we observed that CLV is, in fact, a inal element of the RM activity. In the model, we see that CLV is essentially a system output. We conirmed that, as was pointed out in the literature review, CLV is the end result of RM work and should be regarded, therefore, as its primary goal.
As with CLV, relationship switching costs appears as a system output. However, unlike CLV, relationship switching costs is not a goal to be
pursued by companies and thus is not a result to aim for.
FIguRE 2 – Average map diagram
his conirms what was pointed out by the meta-analysis carried out based on many diferent models in literature, that is, most of the RM elements have an impact on the CLV that is mediated by loyalty. Five elements (except for loyalty) have a direct or indirect and extremely intense impact on CLV, and all are in some way mediated by loyalty. Of these ive, three have an impact on CLV only through loyalty (satisfaction, afective commitment and personalization); one, quality, has an impact on CLV mediated by loyalty and trust; and the ifth one, trust, has a direct impact on it and is mediated by loyalty. herefore, it is quite reasonable to conjecture that the RM process should be understood by the sequence: RM elements → loyalty → CLV indicated in this paper.
At another extreme, early on in the process, we identiied that personalization and quality are
As for the less relevant nodes, the generated model shows that calculative commitment and switching costs (the three types) do not have a strong impact on any other construct. In fact, calculative commitment and procedural and inancial switching costs do not impact and are not signiicantly afected by any other node, and were therefore excluded from the inal model. his shows that, according to what we have observed, these elements are less important and should be less focused on in the search for the inal results of the company-customer relationship.
Interestingly, positive elements (such as personalization, quality, satisfaction) have far greater impact than elements of penalty, such as switching costs and calculative commitment. his indicates that, according to the surveyed individuals, customer beneits tend to have better results than penalties. his does not mean, of course, that penalty elements have no impact on the CLV, but that, in an efort to prioritize and allocate scarce resources, the impacts of these elements will be smaller.
As well as identifying how the final elements of relationship marketing are formed, average map analysis also allows us to observe relationships between the mean elements. Accordingly, we can observe that:
Satisfaction is strongly formed by quality, as widely noted and discussed (Baptista, 2005; Fornell, Johnson, Anderson, Cha, & Bryant, 1996; Kristensen & Eskilden, 2012; Ranjbarian, Sanayei, Kaboli, & Hadadian, 2012; Szymanski & Henard, 2001), and by pesonalization. Also as to satisfaction, this study validated the direct impact of satisfaction on loyalty, as pointed out by Fornell et al (1996) – Figure 1C – Edvardsson
et al (2000) – Figure 1F – Burnham Frels and Mahajan (2003 ) – Figure 1G – Lam et al (2004) – Figure 1I – Baptista (2005) – Figure 1J – Ball, Coelho and Vilares (2006) – Figure 1M – and Tong, Wong and Lui (2012) – Figure 1P.
As pointed out in the theory (Jones et al, 2007; Fullerton, 2005), afective commitment was also shown here as an antecedent of loyalty (impact 3.7). As for the shapers, affective
commitment is strongly formed by the junction of personalization, quality, satisfaction and trust.
Trust, on the other hand, appears as a direct shaper of loyalty, as indicated by Gabarino and Johnson (1999) and Ball, Coleho and Villares (2006) – Figure 1M, but is rejected by Baptista (2005) – Figure 1J and Brei and Rossi (2005) – Figure 1K. We also conirmed the commitment-trust theory of Morgan and Hunt (1994), in which trust has an inluence on commitment. We highlight the direct impact of trust on the CLV, which was not shown by researched theory. As for its shapers, in the model developed here, the only element with a strong impact on conidence is quality, as pointed out only by the Baptista model (2005) – Figure 1J.
Besides the main objective of analyzing the relationship between RM elements, it could be interesting to analyze whether there is some sort of diference in the thoughts of individuals with diferent characteristics. In order to explore this possibility, we carried out cluster analysis of individual maps of all 35 respondents. However, no formation of groups with diferent patterns of behavior was observed. In fact, after the formation of two small groups (the irst comprised by eight respondents, and the second of three respondents), which then come together, we basically added one respondent at a time to one same larger group. hus, there is no evidence, in this research, to suppose that the thoughts of scholars, managers and consultants is diferent from each other’s; or that individuals with greater experience in the B2B or B2C markets make up groups that have diferent thoughts.
5 FInAl ConsIdERAtIons
loyalty and CLV; and CLV as the ultimate goal of relationship actions. Each one of these elements was analyzed in the light of theory. In addition, we listed existing and tested theoretical models to indicate the relationship between the surveyed elements.
Based on this survey, a inal list of RM constructs was developed. In order to identify the relationships between these elements, we employed cognitive mapping, to ind out how Brazilian professionals who are highly involved in relationship management with customers see the interactions between the formed factors of loyalty and, consequently, the ultimate goal: CLV. Besides individual maps expressing how each of the surveyed experts understand the relationships between the constructs, an average map was drawn. his average map shows the average pooled overview of all respondents and it is through it that we carried out our analysis.
As for the main findings, first, we emphasize that CLV, considered throughout the research as the ultimate goal of the RM activity, was conirmed as an output variable in the model. his means that the method adopted in this study validated the hypothesis that conceptual CLV should be understood as the inal result of the RM activity.
his inding is important, since it is in line with the central concept that RM activity cannot exist if it does not bring higher returns. Furthermore, it allowed the inclusion of CLV in the structural models of the company-customer relationship. The inclusion of CLV in the structural model developed in this research is relevant because, although it is a central concept, CLV is not part of the structural models identiied in the developed theoretical review.
he analyzes carried out allowed us to understand the interactions between the various RM elements and, in particular, how its inal element is formed: CLV. Instead of analyzing formulas to estimate the individual CLV of each client, such as most CLV models research do, this study investigated the relationship between elements that form it. he identiication of the
aggregate map and of the elements with higher and lower importance in the formation of CLV can be useful to increase awareness on the issue and assist managers to better invest their eforts and optimize results. We were able to identify, for example, where better to invest to maximize results on CLV, or performance indicators of intermediate elements that can predict future variations of CLV in the customer base.
While this study was able to point out the results or output elements referring to RM, it was also able to identify key input elements. Personalization and quality appear as exogenous elements in the designed model. hat is, even considering low intensity impacts, personalization and quality are much more strongly causative constructs than consequences, and at the same time have an important impact on the other process elements. hese two elements should be, therefore, the starting points of relationship eforts with customers.
Some limitations, however, need to be identiied. he irst refers to the type of research and to the research universe. hrough the method we used, we only identiied how the ield experts see the interrelationships between constructs that are relevant to RM. We could not, however, assess whether consumers in fact behave the way the experts point out. To this end, it would be necessary to list the opinions of consumers. his type of veriication would be quite rich to validate the model that was developed here and is highlighted as a suggestion for future studies.
Finally, the third limitation we consider important to emphasize refers to the variables analyzed. Only the constructs regarding the RM activity were analyzed, and that could somehow influence their results. There are, however, a number of other exogenous factors that can enhance the impact of these elements. As examples, we can mention the exogenous variables that we did not deal with: customer engagement with the purchase, number of previous purchases (Johnson & Sivadas; Gabarino, 2008) and the degree of market competitiveness (Lee & Lee and Feick, 2001).
REFEREnCEs
Andersen, D., & Richardson, G. (1997). Scripts for group model building. System Dynamics Review, 13(4), 107-129.
Anderson, E. W., & Mittal, V. (2000). Strengthening the satisfaction-profit chain.
Journal of Service Research, 3(2), 107-120.
Ball, D., Coelho, P. S., & Mach́s, A. (2004). he role of communication and trust in explaining customer loyalty: An extension to the ECSI model. European Journal of Marketing, 38(9/10), 1272-1293.
Ball, D., Coelho, P. S., & Vilares, M. J. (2006). Service personalization and loyalty. Journal of Services Marketing, 20(6), 391-403.
Baptista, P. P. (2005) Lealdade do consumidor e os seus antecedentes: Um estudo aplicado ao setor varejista na internet (Tese de doutorado). Universidade de São Paulo, São Paulo, SP, Brasil.
Bastos, A. V. (2002). Mapas cognitivos e a pesquisa organizacional: Explorando aspectos metodológicos. Estudos de Psicologia, 7, 65-77.
Berger, P. D., & Nasr, N. I. (1998). Customer lifetime value: Marketing models and applications.
Journal of Interactive Marketing, 12(1), 17-30.
Berry, L. L. (1995). Relationship marketing of services—growing interest, emerging perspectives.
Journal of the Academy of Marketing Science, 23(4), 236-245.
Bouzdine-Chameeva, T. (2005). Ancom- 2: A support tool for collective decisions based on causal mapping. Cahier de Recherche Cerebem: Centre de Recherché de Bordeaux Ecole de Management, 5(87).
Bouzdine-Chameeva, T. (2007). he Ancom-2 solution to support knowledge work. International Business Management, 1(2), 12-19.
Bouzdine-Chameeva, T., Durrieu, F., & Mandj́k, T. (2001) Application of causal mapping methodology to measure business relationship value. Euro-Gdss Annual Worksho, La Rochelle, França.
Brei, V. A., & Rossi, C. A. V. (2005). Coniança, valor percebido e lealdade em trocas relacionais de serviço: Um estudo com usúrios de internet banking no Brasil. Revista de Administração Contemporânea, 9(2), 145-168.
Burnham, T. A., Frels, J. K., & Mahajan, V. (2003). Consumer switching costs: A typology, antecedents, and consequences. Journal of the Academy of Marketing Science, 31(2), 109-126.
Caruana, A. (2004). he impact of switching costs on customer loyalty: A study among corporate customers of mobile telephony. Journal of Targeting, Measurement and Analysis for Marketing,
12(3), 256-268.
Clarkson, G. P., & Hodgkinson, G. P. (2005). Introducing Cognizer™: A comprehensive computer package for the elicitation and analysis of cause maps. Organizational Research Methods,
8(3), 317-341.
Crescitelli, E., & Figueiredo, J. (2010). Uso de diagramas causais na construção de um modelo de brand equity. Florianópolis/SC: EMA.
Edvardsson, B., Johnson, M. D., Gustafsson, A., & Strandvik, T. (2000). he efects of satisfaction and loyalty on proits and growth: Products versus services. Total Quality Management, 11(7), 917-927.
Ensslin, L., & Montibeller, N. (1999). Inferência causal em mapas cognitivos. Rio de Janeiro:
ENEGEP.
Fornell, C., Johnson, M. D., Anderson, E. W., Cha, J., & Bryant, B. E. (1996). he American customer satisfaction index: nature, purpose, and indings. he Journal of Marketing, 60, 7-18.
Fullerton, G. (2005). How commitment both enables and undermines marketing relationships.
European Journal of Marketing, 39(11/12), 1372-1388.
Garbarino, E., & Johnson, M. S. (1999). The different roles of satisfaction, trust, and commitment in customer relationships. The Journal of Marketing, 63(2), 70-87.
Goldberg, J. (1996). The distrat/askmap suite of programs for cause map analysis A user’s guide. Unpublished manuscript. United Kingdom: Cranfield University Computer Centre. Recuperado de goldmark.org/jeff/programs/ distrat/software/drdoclet.ps.gz
Gordon, I. H. (1998). Relationship marketing: new strategies, techniques and technologies to win the customer you want and feet them forever. Toronto: John Wiley & Sons Canada.
Groesser, S. N., & Bruppacher, S. (2007, July). Decisions in the Construction Planning Process: Development of a Dynamic Model about Individual’s Energy Eiciency Intention over Time. Proceedings of the International Conference of the System Dynamics Society, Boston, USA, 25.
Gronroos, C. (1995). Marketing: Gerenciamento e serviços. Rio de Janeiro: Campus.
Jacoby, B., & Chestnut, R. (1978) Brand Loyalty: Mesurement and manegement. New York: John Wiley & Sons.
Jain, D., & Singh, S. S. (2002). Customer lifetime value research in marketing: A review and future directions. Journal of Interactive Marketing, 16(2), 34-46.
Johnson, M. S., Sivadas, E., & Garbarino, E. (2008). Customer satisfaction, perceived risk and affective commitment: An investigation of directions of influence. Journal of Services Marketing, 22(5), 353-362.
Jones, M. A., Reynolds, K. E., Mothersbaugh, D. L., & Beatty, S. E. (2007). he positive and negative efects of switching costs on relational outcomes.
Journal of Service Research, 9(4), 335-355.
Kristensen, K., & Eskildsen, J. (2012). The relationship between SERVQUAL, national customer satisfaction indices, and consumer sentiment. The Quality Management Journal,
19(2), 47.
Lam, S. Y., Shankar, V., Erramilli, M. K., & Murthy, B. (2004). Customer value, satisfaction, loyalty, and switching costs: An illustration from a business-to-business service context. Journal of the Academy of Marketing Science, 32(3), 293-311.
Lee, J., Lee, J., & Feick, L. (2001). he impact of switching costs on the customer satisfaction-loyalty link: mobile phone service in France.
Journal of Services Marketing, 15(1), 35-48.
Lejeune, M. A. (2001). Measuring the impact of data mining on churn management. Internet Research, 11(5), 375-387.
Markóczy, L. A. (1994). Barriers to shared belief: he role of strategic interest, managerial characteristics and organisational factors (Doctoral dissertation). The University of Cambridge, Cambridge, United Kigdom.
Markóczy, L. A., & Goldberg, J. (1995). A method for eliciting and comparing causal maps.
Journal of management, 21(2), 305-333.
trust. Academy of management review, 20(3), 709-734.
Mckenna, R. (1992) Marketing de relacionamento: Estratégias bem-sucedidas para a era do cliente. Rio de Janeiro: Campus.
Morgan, R. M., & Hunt, S. D. (1994). he commitment-trust theory of relationship marketing. he Journal of Marketing, 58, 20-38.
Mulhern, F. J. (1999). Customer proitability analysis: Measurement, concentration, and research directions. Journal of Interactive Marketing, 13(1), 25-40.
Oliver, R. L. (1980). A cognitive model of the antecedents and consequences of satisfaction decisions. Journal of Marketing Research, 17, 460-469.
Oliver, R. L. (1999). Whence consumer loyalty?
he Journal of Marketing, 63(1), 33-44.
Peppers, D., & Rogers, M. (2005) Retorno sobre clientes: Um modo revolucionário de medir e fortalecer o seu negócio. Rio de Janeiro: Elsevier.
Pfeifer, P. E., Haskins, M. E., & Conroy, R. M. (2005). Customer lifetime value, customer proitability, and the treatment of acquisition spending. Journal of Managerial Issues, 17(1), 11-25.
Pidd, M. (2001). Modelagem empresarial:
Ferramentas para tomada de decisão. Porto Alegre: Bookman.
Portal mundo do marketing - Conheça a visão e praticas de marketing de relacionamento no Brasil. recuperado em 03 agosto, 2013, de http:// www.mundodomarketing.com.br/reportagens/ relacionamento/27530/conheca-a-visao-e- praticas-de-marketing-de-relacionamento-no-brasil.html
Pritchard, M. P., Havitz, M. E., & Howard, D. R. (1999). Analyzing the commitment-loyalty
link in service contexts. Journal of the Academy of Marketing Science, 27(3), 333-348.
Ranjbarian, B., Sanayei, A., Kaboli, M. R., & Hadadian, A. (2012). An analysis of brand image, perceived quality, customer satisfaction and re-purchase intention in Iranian department stores.
International Journal of Business and Management,
7(6), 40-48.
Rust, R. T., Zeithaml, V. A., & Lemon, K. N. (2001). O valor do cliente. Porto Alegre: Bookman.
Ryals, L. J., & Knox, S. (2005). Measuring risk-adjusted customer lifetime value and its impact on relationship marketing strategies and shareholder value. European Journal of Marketing, 39(5/6), 456-472.
Scavarda, A. J. R. R. (2004). Metodologia evocativa para mapeamento causal e sua perspectiva na gerência de operações com aplicações via internet em gestão da cadeia de suprimento e administração de serviços (Tese de doutorado). Pontifícia Universidade Católica do Rio de Janeiro-PUC-Rio, Rio de Janeiro, RJ, Brasil.
Scavarda, A., Bouzdin-Chameeva, T., Goldstein, S., Hays, J., & Hill, A. (2004, April). A review of the causal mapping practice and research literature. Proceedings of the Second World Conference on POM and 15th Annual POM Conference, Cancun, Mexico.
Scavarda, A. J., Bouzdine-Chameeva, T., Goldstein, S. M., Hays, J. M., & Hill, A. V. (2005). A methodology for constructing collective causal maps. Decision Sciences, 37(2), 263-283.
Surprenant, C. F., & Solomon, M. R. Predictability and personalization in the service encounter.
Journal Of Marketing, 51(02), 86-96.
Szymanski, D. M., & Henard, D. H. (2001). Customer satisfaction: A meta-analysis of the empirical evidence. Journal of the Academy of Marketing Science, 29(1), 16-35.
customer satisfaction and switching costs on e-loyalty. International Journal of Economics and Finance, 4(3), 105-114.
Vavra, T. G. (1993). Marketing de relacionamento: Aftermarketing. São Paulo: Atlas.
Vesanen, J. (2007). What is personalization? A conceptual framework. European Journal of Marketing, 41(5/6), 409-418.
Zeithaml, V. A., Berry, L. L., & Parasuraman, A. (1996). he behavioral consequences of service quality. he Journal of Marketing, 60(2), 31-46.