Dietary patterns in pregnancy
and birth weight
I Programa de Pós-Graduação de Epidemiologia em Saúde Pública. Escola Nacional de Saúde Pública. Fundação Oswaldo Cruz. Rio de Janeiro,RJ, Brasil II Departamento de Epidemiologia. Instituto
de Medicina Social. Universidade do Estado do Rio de Janeiro. Rio de Janeiro, RJ, Brasil III Instituto de Nutrição Josué de Castro.
Universidade Federal do Rio de Janeiro. Rio de Janeiro, RJ, Brasil
Correspondence:
Natália de Lima Pereira Coelho Rua Ferreira de Castro, 79 Agriões 25963-010 Teresópolis, RJ, Brasil E-mail: [email protected] Received: 2/21/2014
Approved: 2/8/2015
ABSTRACT
OBJECTIVE: To analyze if dietary patterns during the third gestational trimester are associated with birth weight.
METHODS: Longitudinal study conducted in the cities of Petropolis and Queimados, Rio de Janeiro (RJ), Southeastern Brazil, between 2007 and 2008.
We analyzed data from the irst and second follow-up wave of a prospective
cohort. Food consumption of 1,298 pregnant women was assessed using a
semi-quantitative questionnaire about food frequency. Dietary patterns were
obtained by exploratory factor analysis, using the Varimax rotation method.
We also applied the multivariate linear regression model to estimate the
association between food consumption patterns and birth weight.
RESULTS: Four patterns of consumption – which explain 36.4% of the
variability – were identiied and divided as follows: (1) prudent pattern (milk, yogurt, cheese, fruit and fresh-fruit juice, cracker, and chicken/beef/ish/liver),
which explained 14.9% of the consumption; (2) traditional pattern,
consisting of beans, rice, vegetables, breads, butter/margarine and sugar, which explained 8.8% of the variation in consumption; (3) Western pattern (potato/cassava/yams, macaroni, lour/farofa/grits, pizza/hamburger/deep
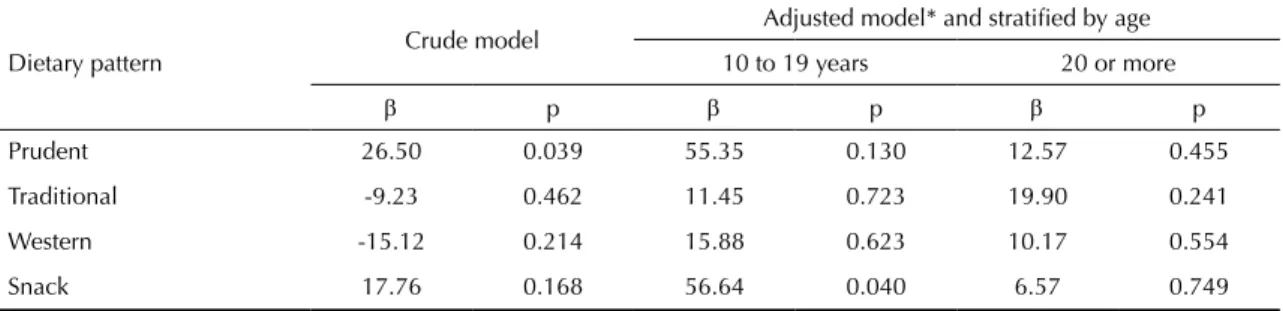
fried pastries, soft drinks/cool drinks and pork/sausages/egg), which accounts for 6.9% of the variance; and (4) snack pattern (sandwich cookie, salty snacks, chocolate, and chocolate drink mix), which explains 5.7% of the consumption variability. The snack dietary pattern was positively associated with birth weight (β = 56.64; p = 0.04) in pregnant adolescents.
CONCLUSIONS: For pregnant adolescents, the greater the adherence to
snack pattern during pregnancy, the greater the baby’s birth weight.
DESCRIPTORS: Pregnant Women. Prenatal Nutrition. Pregnancy Third Trimester. Food Consumption. Birth Weight.
Natália de Lima Pereira CoelhoI
Diana Barbosa CunhaII
Ana Paula Pereira EstevesI
Elisa Maria de Aquino LacerdaIII
Birth weight is an important indicator of child survival and relects the risk of death and hazards to health during the irst year of life.a Several factors are related to
vari-ations in birth weight, standing out the maternal food consumption.15 It is essential for the pregnant diet sufi-cient energy and nutrients to maintain maternal health,
to allow for adequate fetal growth and development.7,30 However, assessing food consumption becomes a
chal-lenge due to the human diet complexity, something
that solicits researchers to reine assessment methods
of food consumption.
Historically, most epidemiological studies had the main focus on assessing the association between consump
-tion of nutrients and disease development.20 However, this evaluation is considered reductionist because it
dis-regards the complex interaction between nutrients and
foods. This occurs because individuals do not ingest isolated nutrients but meals composed of a wide variety
of foods that interact with each other.29
Addressing food consumption with the identiication
of food patterns has been described as a method that are close to the complex act of feeding,31 given that it
considers different combinations and compositions of
meals. Moreover, the study of food patterns allows the formulation of food-based dietary recommendations.31 However, few studies have assessed the pattern of food
consumption among pregnant women, particularly its effects on the foetus.10,22
This study aimed to analyze whether dietary patterns during the third gestational trimester are associated with birth weight.
METHODS
This study is part of the project Capital Social e Fatores Psicossociais associados à Prematuridade e ao Baixo Peso ao Nascer (Social Capital and Psychosocial Factors associated with Prematurity and Low Birth Weight) conducted in the cities of Petropolis and Queimados,
RJ, Southeastern Brazil, between December 2007 and
August 2008.b It is a prospective cohort with four waves of follow-up: pregnancy, puerperium, three and six months after birth. We analyzed data from the irst
(ges-tation) and the second stage (postpartum) of follow up.
All pregnant women with up to 22 weeks of gestation were invited to participate in the cohort, assisted by
INTRODUCTION
prenatal services of 11 municipal health units of Uniied Health System (SUS) – eight in Queimados and three
in Petropolis, RJ, which had 90.0% of the prenatal care
coverage of SUS.
For the calculation of the cohort sample size, we conside
-red a prevalence of 10.0% of premature and low weight births, a signiicance level of 5% and 90.0% of power to detect differences of at least 5.0%.11 After adjustments for inite populations and increase of 20.0% for possi-ble losses during the follow-up of pregnant women, the
sample size was established with 940 pregnant women in Petropolis and 840 in Queimados.
Due to premature births (n = 167), loss of follow-up (n = 104), refusals (n = 71), miscarriages (n = 62), lack of information on birth weight (n = 31), and occurrence of twin pregnancy (n = 17), the sample of this study
was composed of 1,298 women.
Food consumption was assessed with a semi-quantitative food frequency questionnaire (FFQ), referring to the last gestational quarter, with 29 food items and obtained by simplifying a 80-item FFQ, validated by Sichieri and Everhart.28 To this simpliication, we performed a
sec-ondary analysis of the database employed in the elab -oration of the original FFQ, using stepwise regression
to explain 95.0% of variance for the following nutri-ents: energy, carbohydrates, lipids, saturated fatty acids,
monounsaturated and polyunsaturated fats, cholesterol,
calcium and vitamin C.c
The birth weight information came from medical records.
When data were not available, we analyzed child book-lets or certiicates of born alive.
The following variables were evaluated: (i) sociode-mographic: age of pregnant women, marital status (lives with a partner; does not live with a partner), self-referred skin color (white; black; mixed race), education level according to years of study, work outside home (no; yes), economic class (B or C; D or E); (ii) tobacco (no; yes); (iii) self-referred chro-nic diseases: arterial hypertension (not; yes), dia-betes mellitus (not; yes); (iv) obstetric antecedents: parity (primipara; 2-3 children; 4 or more children),
prior history of perinatal death, low birth weight or
prematurity; (v) maternal nutritional status
(pre-gestational BMI and (pre-gestational weight gain), and
(vi) adequacy of prenatal care. The obstetric
his-tory and complications in pregnancy, such as diabe -tes and arterial hypertension, were referred by the
a World Health Organization. The global burden of disease: 2004 update. Geneva; 2008 [cited 2015 Apr 17]. Available from: http://www.who. int/healthinfo/global_burden_disease/2004_report_update/en/
b Projeto: “Capital Social e Fatores Psicossociais Associados a Prematuridade e ao Baixo Peso ao Nascer”. Edital MCT/CNPq/MS-SDTIE-DECIT 26/2006 – Estudo de Determinantes Sociais da Saúde, Saúde da Pessoa com Deficiência, Saúde da População Negra, Saúde da População Masculina. Processo nº 409805/2008-8.
woman during the interview in the maternity ward after giving birth with the question: “Did you have
any of these health issues during pregnancy?” High blood pressure or eclampsia (yes; no); gestational diabetes (yes; no).
The socioeconomic classiication followed the
crite-rion adopted by Associação Brasileira de Empresas de Pesquisa (ABEP – Brazilian Association of Research Companies) and was based on the family property
and householder’s educational level, which compo-sed the inal score that deines socioeconomic groups: A (highest), B, C, D and E (lowest).1 Socioeconomic classes were aggregated for multivariate analysis in B or C, and D or E – no women classiied in the A cate-gory. To assess the adequacy of prenatal care, we used Kotelchuck index,16 which is based on the gestational
age at the beginning of prenatal care and on the ade
-quacy percentage of the number of visits. These two dimensions were grouped into three categories:
pre-natal care more than appropriate; appropriate; partly inappropriate; and inappropriate.
The datum about pregestational weight was obtained from the pregnant medical record until the thirteenth
gestational or, if unavailable, it was self-reported by
the patient. This weight was used to calculate body mass index (BMI) before pregnancy, allowing to classify the nutritional status of pregnant women
in four categories: underweight (pregestational BMI < 18.5 kg/m2), adequate weight
(pregestatio-nal BMI between 18.5 and 24.9 kg/m2), overweight
(pregestational BMI between 25 and 29.9 kg/m2) and
obesity (pregestational BMI ≥ 30 kg/m2).26 Based on
these information, we determined the ranges of wei
-ght adequacy for each expectant mother, which were equivalent to the total gestational weighted gain: 12.5 to 18 kg for women with low pregestational weight; 11.5 to 16 kg for eutrophic women; 7 to 9 kg for
overweight women; and 7 kg for obese women.26
The weight at the end of pregnancy was referred to
by women during the postpartum interview. For the
calculation of the total gestational weight gain, we subtracted pregestational weight from weight at the end of pregnancy.
For the identiication of dietary patterns, the 29 items
lis-ted in FFQ were grouped in 20 food groups based on their
nutritional characteristics and consumption frequency. The exploratory factor analysis was used to derive
dietary patterns based on the daily portion of con -sumption of each food group. A correlation matrix
was used to check if the variables were correlated
and if the factorial model was appropriate for the
data. For this, we used the Bartlett’s sphericity test (BST) and the Kaiser-Meyer-Olkin (KMO) measure of sampling adequacy.
The factor extraction was performed by principal com -ponent analysis (PCA), orthogonally transformed, with Varimax rotation to obtain a structure with independent factors, which helped in the interpretation.
The deinition of factors to be retained was based on scree plot (a graph that shows eigenvalues in relation
to the number of factors in their order of extraction),
on the percentage of variance explained by factors and on the knowledge of the researchers (considerations on
interpretability and simplicity of patterns). Then a new factor analysis was conducted with the establishment of the number of factors to be extracted.
We kept in the factors (patterns) the items with factor
loading higher than 0.30 and considered acceptable mini
-mum commonalities of 0.25.23 The internal consistency of each extracted factor was veriied by Cronbach’s alpha. Subsequently, the patterns were named based
on data interpretation.
The association between dietary patterns and birth
weight was assessed by the multivariate linear regres-sion model. Initially, we conducted the bivariate linear regression analysis between all exposure variables and birth weight, in addition to bivariate linear regression analysis between all covariates of the study and
die-tary patterns to detect possible confounding factors. A separate analysis was conducted for each dietary pat
-tern. All covariates with p < 0.20 in both analyses were considered feasible elements for the inal model. The inal model was also mutually adjusted by other dietary patterns, given that, in this kind of analysis,
individu-als participate in more than one pattern, which are not correlated due to the rotation method used.
The study was approved by the Research Ethics Committee of Escola Nacional de Saúde Pública (ENSP/ Fiocruz – CAAE 0156.0.031.000-06), in accordance
with the ethical principles stipulated by Resolution
196/96 of the National Health Council (CNS, 1996).
The statistical analyses were carried out with the sof
-tware Statistical Package for Social Sciences (SPSS) for Windows, version 16.0.
RESULTS
The average age of the women interviewed was 24.7 years, and the average years of study was less than eight. Most women had no paid job (59.7%) and were
in the economic classes B or C (66.4%). Most of them already had more than one child and 12.8% had prior history of newborn infants with low birth weight, pre -maturity or perinatal death (Table 1).
adequate prenatal care. Of the interviewed women, smoking was reported by 12.0% of them (Table 1);
19.0% were diagnosed with gestational arterial hyper
-tension and 2.5% with diabetes.
It was observed that 28.8% of women started preg-nancy under an inadequate nutritional status and, of these, 20.0% were overweight. The average of weight gain in pregnancy was 13.3 kg, but less than 1/3 of women had appropriate weight gain, and 37.5% had excessive gain. There was a predominance of vaginal birth (55.7%) and the average birth weight of newborns was 3,253 g (Table 1).
Initially, we identiied seven factors with eigenvalues
higher than 1.0, which explained the food consumption
variance of 51.3% (data not presented in the tables). Based on the scree plot, eigenvalues and considering
interpretability of patterns, four factors should be retai -ned, which, altogether, explained 36.4% of the con
-sumption variability (Table 2).
The four patterns of consumption were named and compo
-sed as follows: (1) prudent pattern (milk, yogurt, cheese, fruit and natural juice, cracker and chicken/beef/ish/liver),
which explained 14.9% of the consumption; (2) traditional
pattern (beans, rice, vegetables, bread, butter/margarine, and sugar), which explained 8.8% of the variation in consumption; (3) Western pattern (pizza/hamburger/ deep fried pastries, potato/cassava/yams, soft drinks/ cool drinks, lour/farofa/grits, and pork/sausages/egg,
which accounts for 6.9% of the variance; and (4) snack pattern (sandwich cookies, salty snacks, chocolate, and chocolate drink mix), which explains 5.7% of the variance (Table 2).
All food groups were associated to one of the four pat
-terns identiied and only one food item was excluded from the analysis (coffee/black tea or mate tea) for having very low commonality and not adjusting in any
of the patterns established.
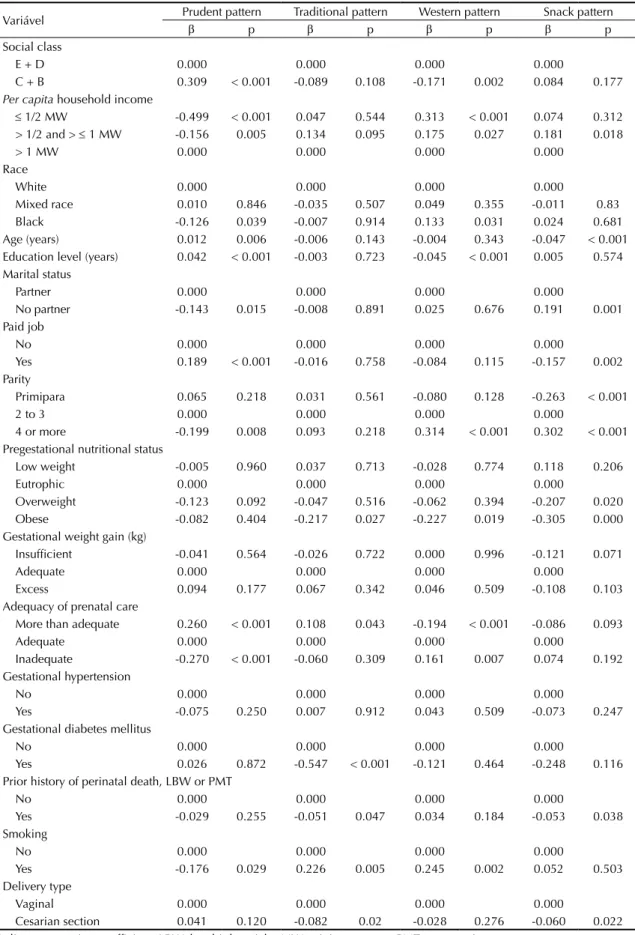
In bivariate analysis, considering the statistical sig-niicance lower than 20.0%, the prudent pattern was associated positively with economic class B or C, paid work, age, education level, more than adequate prena-tal and excessive weight gain in pregnancy, and was inversely associated with smoking in pregnancy. The pregnant women classiied in traditional or Western pattern had some common features, such as: higher parity, smoking in pregnancy and lower pregestatio-nal obesity. The pregnant women classiied in snack pattern were signiicantly younger, with less overwei-ght and pregestational obesity, and more inadequate
prenatal (Table 3).
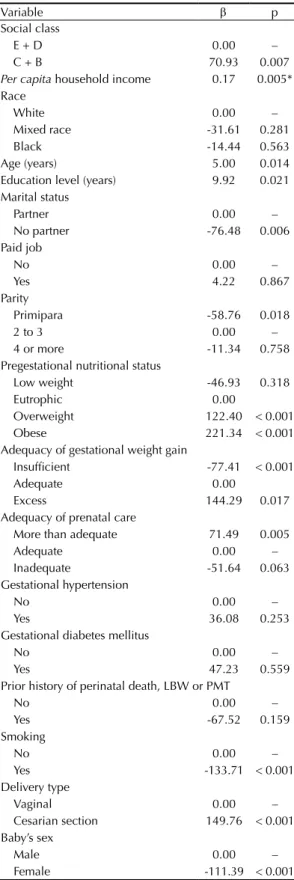
In relation to birth weight, we observed positive asso-ciation for the following variables: social class B or C, maternal age, education level, pregestational overweight
Table 1. Sociodemographic characteristics, obstetric antecedents;
characteristics of pregnancy, delivery and newborn in cohorts of pregnant women. Petropolis and Queimados, RJ, Southeastern Brazil, 2007-2008.
Variable Total
n %
Social class
C + B 862 66.4
E + D 436 33.6
Race/Skin color
White 440 33.9
Mixed race 557 42.9
Black 301 23.2
Marital status
Partner 957 73.7
No partner 341 26.3 Paid job
No 775 59.7
Yes 523 40.3
Prior history of perinatal death, low birth weight or prematurity*
No 635 87.2
Yes 93 12.8
Parity
Primipara 570 43.9
2 to 3 558 43.0
4 or more 170 13.1 Pregestational nutritional status
Low weight 96 8.9
Eutrophic 768 71.2 Overweight 214 19.9 Adequacy of gestational weight gain
Insufficient 358 32.5
Adequate 330 30.0
Excessive 412 37.5 Adequacy of prenatal care
More than adequate 508 39.2
Adequate 436 33.7
Inadequate 351 27.1 Gestational hypertensive
No 1,051 81.0
Yes 246 19.0
Gestational diabetes mellitus
No 1,266 97.5
Yes 32 2.5
Smoking in pregnancy
No 1,141 88.0
Yes 155 12.0
Delivery type
Vaginal 723 55.7
Cesarian section 575 44.3 Mean SD Age (in years) 24.7 6.1 Years of education 7.8 2.9 Birth weight (in grams) 3.25 444.8
or obesity, excessive gestational weighted gain, and cesarean delivery. In contrast, not living with a
part-ner, being primipara, starting prenatal care with low
weight, having inadequate weight gain, receiving ina-dequate prenatal care, and smoking during pregnancy were negatively associated with birth weight (Table 4). The variables that had association with signiicance level
of 20.0% with birth weight and dietary patterns, and which
were adjusted in the inal model, in addition to other die-tary patterns, were: economic class, age, education level
of the mother, marital status, parity, pregestational nutri
-tional status, adequacy of prenatal care, perinatal death history, low birth weight or prematurity, smoking during pregnancy and delivery type (Tables 3 and 4).
In the multivariate analysis, we observed positive asso-ciation between snack pattern and birth weight, after adjustment according to maternal age, education level
of the mother, marital status, social class, parity, pre
-gestational BMI, adequacy of prenatal care, previous history of low birth weight/prematurity, smoking during pregnancy, newborn sex and type of delivery (data not shown). This association was observed after the
inclu-sion of maternal age in the model, and not in the crude
analysis, which showed the presence of negative confu-sion. It was observed that the distribution of the average factor score of the snack pattern also differed according
to age group (0.44 in women between 10 and 19 years
old and -0.13 in women 20 or more years of age) (data not presented in tables). These indings explain the
Table 2. Rotated factorial matrix, factor loading, variance and Cronbach’s alpha for the four dietary patterns identified among
pregnant women from the city of Petropolis and Queimados, RJ, Southeastern Brazil, 2007-2008.
Food group Factor loading
Prudent Traditional Western Snack
Milk 0.49
Yogurt 0.62
Cheese 0.59
Cracker 0.48
Poultry/Beef/Fish/Liver 0.42
Fruit or fresh-fruit juice 0.56
Beans 0.51
Rice 0.61
Sugar 0.64
Butter/Margarine 0.68
Bread 0.58
Vegetables 0.36
Potato/Cassava/Yam 0.60
Macaroni 0.69
Flour/Farofa/Grits 0.55
Soft drinks/Cool drinks 0.45
Pork/Sausages/Egg 0.44
Pizza/Burger/Deep fried pastries 0.37
Chocolate 0.61
Chocolate drink mix 0.47
Sandwich cookie 0.68
Salty snacks 0.65
Eigenvalues 3.28 1.94 1.53 1.26
% of variance explained 14.94 8.80 6.94 5.74
% of accumulated variance explained 14.94 23.74 30.68 36.42
attenuation of the effect observed in the crude analy-sis. Thus, the inal model was stratiied by maternal age
(10 to 19 years; 20 years or more).
The multivariate linear regression analysis adjusted for confounding factors showed a positive association between the snack pattern and birth weight among preg-nant adolescents (Table 5).
DISCUSSION
The results of this study show that, in general, pregnant women who had prenatal care at the selected health
units (SUS) of Queimados and Petropolis were young
and from low socioeconomic class, features similar to other studies with pregnant women and recent mothers
who used the services of SUS basic unities.17,24
Regarding anthropometric assessment of these women,
although 64.9% of them were in an adequate
nutri-tional status at the beginning of pregnancy, the pre
-valence of overweight was high (26.9%). This result
is similar to that found in the study of Nucci et al21 (2001) who, following up 5,564 pregnant women in six Brazilian cities, found prevalence of 24.7% for overweight and obesity.
The average weight gain in pregnancy (13.3 kg) is
sim-ilar to that found by Lacerda et al17 (2007) among preg -nant women living in Rio de Janeiro, in 2001 (13.4 kg).
The results for gestational weight gain – 37.4% with
excessive gain and 30.0% with adequate weight gain
according to BMI – are in line with those found in other studies.5,13
The information on birth weight show that, in this study,
the average weight (3,253 g) was a little bit higher
(3,142 g) to the one found in another location.4 This average of birth weight can be explained by excluding
premature newborns from the sample studied. Thus,
the average birth weight found in this study does not reach the range between 3,400 and 3,500 g, expected values of birth weight under optimum conditions of
fetal growth.d
The factor analysis allowed identifying four dietary pat
-terns that have food in common with dietary pat-terns identiied by other researches.
The prudent pattern, also called “healthy” in other stud-ies with pregnant women, has fruit, fresh-fruit juice, vegetables, ish, and poultry.7,15,20
The traditional pattern – beans, rice, vegetables, bread and butter/margarine – represents foods that are part of the Country’s eating habits and are similar
to the traditional pattern found in studies that used
the same analysis procedures for the extraction of dietary patterns.8,19
The Western pattern is composed by foods with
high-energy density, low nutritional value (low amount or free from micronutrients) and low inancial cost,
in addition to containing foods with a high propor
-tion of carbohydrates (macaroni, potato/yam/cassava, lour/farofa/grits, soft drinks/cool drinks). This
pat-tern also includes source of proteins such as pork, egg, sausages – the latter with low nutritional quality, as it
contains large amounts of saturated fat, cholesterol
and sodium. Fast foods (pizza/hamburger/deep fried pastries) are also present in this pattern and have low nutritional value and high energy density.
The snack pattern (sandwich cookies, salty snacks, chocolate, and chocolate drink mix) is also composed of foods of low nutritional value and with high-energy
density. In the study conducted by Northstone et al,20 we found a dietary pattern called “confectionery” (choco-late, sweets, biscuits, and cakes) that has items in com-mon to the snack pattern.
The variables selected as confusion factors in the inal statistical model have a theoretical rationale. Birth
weight is an important health indicator and indirectly
relects the living conditions of populations.4 Thus, bet -ter socioeconomic situations as higher education level
of mothers, better social class and greater access to
health services during pregnancy are commonly
asso-ciated with healthy food consumption, as well as with an appropriate birth weight.4,7,10,20 The family struc
-ture is also an important factor capable of affecting maternal food consumption and birth weight. Women
living with a partner and having lower parity tend to have access to a better quality diet and giving birth to
babies with higher weight.6,10,20,27 Early or advanced maternal age, as well as smoking, have been indicated as risk factors for deviations in birth weight.6 At the
same time, literature shows that pregnant adolescents,
smokers and who consume alcohol during pregnancy have a worse dietary pattern.4,7,20 The type of birth also inluences birth weight, because in many cases
pregnancy is surgically interrupted before the onset of labor, reducing the time of intrauterine growth and weight gain.4 In addition, cesarian section is more fre -quent among women with gestational intercurrences like diabetes, hypertension, anemia, and other
com-plications.25 Many of these diseases area result of the
inadequate food consumption of these women.3 Finally, the maternal BMI also directly inluences maternal
food consumption and birth weight.4,9
The analysis of the relationship between food con -sumption and birth weight showed that, for pregnant
Table 3. Estimation of bivariate linear regression parameters between dietary pattern and maternal variables in cohort of pregnant women. Petropolis and Queimados, RJ, Southeastern Brazil, 2007-2008.
Variável Prudent pattern Traditional pattern Western pattern Snack pattern
β p β p β p β p
Social class
E + D 0.000 0.000 0.000 0.000
C + B 0.309 < 0.001 -0.089 0.108 -0.171 0.002 0.084 0.177
Per capita household income
≤ 1/2 MW -0.499 < 0.001 0.047 0.544 0.313 < 0.001 0.074 0.312 > 1/2 and > ≤ 1 MW -0.156 0.005 0.134 0.095 0.175 0.027 0.181 0.018
> 1 MW 0.000 0.000 0.000 0.000
Race
White 0.000 0.000 0.000 0.000
Mixed race 0.010 0.846 -0.035 0.507 0.049 0.355 -0.011 0.83 Black -0.126 0.039 -0.007 0.914 0.133 0.031 0.024 0.681 Age (years) 0.012 0.006 -0.006 0.143 -0.004 0.343 -0.047 < 0.001 Education level (years) 0.042 < 0.001 -0.003 0.723 -0.045 < 0.001 0.005 0.574 Marital status
Partner 0.000 0.000 0.000 0.000
No partner -0.143 0.015 -0.008 0.891 0.025 0.676 0.191 0.001 Paid job
No 0.000 0.000 0.000 0.000
Yes 0.189 < 0.001 -0.016 0.758 -0.084 0.115 -0.157 0.002 Parity
Primipara 0.065 0.218 0.031 0.561 -0.080 0.128 -0.263 < 0.001
2 to 3 0.000 0.000 0.000 0.000
4 or more -0.199 0.008 0.093 0.218 0.314 < 0.001 0.302 < 0.001 Pregestational nutritional status
Low weight -0.005 0.960 0.037 0.713 -0.028 0.774 0.118 0.206
Eutrophic 0.000 0.000 0.000 0.000
Overweight -0.123 0.092 -0.047 0.516 -0.062 0.394 -0.207 0.020 Obese -0.082 0.404 -0.217 0.027 -0.227 0.019 -0.305 0.000 Gestational weight gain (kg)
Insufficient -0.041 0.564 -0.026 0.722 0.000 0.996 -0.121 0.071
Adequate 0.000 0.000 0.000 0.000
Excess 0.094 0.177 0.067 0.342 0.046 0.509 -0.108 0.103 Adequacy of prenatal care
More than adequate 0.260 < 0.001 0.108 0.043 -0.194 < 0.001 -0.086 0.093
Adequate 0.000 0.000 0.000 0.000
Inadequate -0.270 < 0.001 -0.060 0.309 0.161 0.007 0.074 0.192 Gestational hypertension
No 0.000 0.000 0.000 0.000
Yes -0.075 0.250 0.007 0.912 0.043 0.509 -0.073 0.247 Gestational diabetes mellitus
No 0.000 0.000 0.000 0.000
Yes 0.026 0.872 -0.547 < 0.001 -0.121 0.464 -0.248 0.116 Prior history of perinatal death, LBW or PMT
No 0.000 0.000 0.000 0.000
Yes -0.029 0.255 -0.051 0.047 0.034 0.184 -0.053 0.038 Smoking
No 0.000 0.000 0.000 0.000
Yes -0.176 0.029 0.226 0.005 0.245 0.002 0.052 0.503 Delivery type
Vaginal 0.000 0.000 0.000 0.000
Cesarian section 0.041 0.120 -0.082 0.02 -0.028 0.276 -0.060 0.022 β: linear regression coefficient; LBW: low birth weight; MW: minimum wage; PMT: prematurity
adolescents, the greater the adherence to the snack pat-tern, the greater the baby’s birth weight. This associa-tion was probably observed only among younger
preg-nant women because they are the biggest consumers of
this pattern, since they presented mean positive factor score, whereas this mean was negative among women with 20 years of age or over.
The snack pattern consists of foods with high
concentra-tions of simple carbohydrates, lipids and low amounts of protein and micronutrients. This combination of
nutrients gives these foods high-energy density,
favo-ring gestational weight gain.
A diet with a lot of energy is associated with higher gestational weight gain18 which, in its turn, is direc -tly related to the baby’s birth weight.26 This happens
because the higher weight gain during pregnancy incre
-ases availability and transfer of amino acids, glucose,
free fatty acids and triglycerides from the mother to
the foetus by increasing its growth and development.14 According to IOM26 (2009), for every increase of 1 kg
in GPG, there is an increase of 16.7 to 22.6 g in the birth weight.
Uusitalo et al32 (2009) assessed the association between
dietary patterns and gestational weight gain, identifying
seven patterns, of which two were associated to gestatio-nal weight gain: fast food and alcohol and fat patterns.
The authors concluded that women who belonged to
the highest quartile of fast food consumption gained, on average, 1.3 kg more than the lowest quartile of this pattern. On the other hand, women in the highest quar-tile of alcohol and fat consumption gained on average 0.7 kg less than those from the lowest quartile of
con-sumption of this pattern.
Some methodological limitations of this study should be mentioned. Among them, the small number of foods
listed in the FFQ and the lack of standardized portions
for all items. In addition, the FFQ used was not tested regarding accuracy of food estimation, but only in rela
-tion to nutrients. Despite these limita-tions, the results obtained by the questionnaire are consistent with other
studies, as the one performed by Barros et al,2 which used similar questionnaire to assess gestational food
consumption of 1,228 adolescents and also found results consistent with the literature.
Another important factor related to subjectivity, which involves factor analysis, is the speciicity of results obtained with this technique for the population inves-tigated, making dificult the comparison between stu-dies. Moreover, although most women included in our study live in poverty, the factors related to
socio-economic characteristics and lifestyle had relation to eating habits.
Table 4. Estimation of bivariate linear regression parameters*
between birth weight and maternal variables in cohort of pregnant women. Petropolis and Queimados, RJ, Southeastern Brazil, 2007-2008.
Variable β p
Social class
E + D 0.00 –
C + B 70.93 0.007
Per capita household income 0.17 0.005*
Race
White 0.00 –
Mixed race -31.61 0.281
Black -14.44 0.563
Age (years) 5.00 0.014 Education level (years) 9.92 0.021 Marital status
Partner 0.00 –
No partner -76.48 0.006 Paid job
No 0.00 –
Yes 4.22 0.867
Parity
Primipara -58.76 0.018
2 to 3 0.00 –
4 or more -11.34 0.758 Pregestational nutritional status
Low weight -46.93 0.318
Eutrophic 0.00
Overweight 122.40 < 0.001 Obese 221.34 < 0.001 Adequacy of gestational weight gain
Insufficient -77.41 < 0.001
Adequate 0.00
Excess 144.29 0.017 Adequacy of prenatal care
More than adequate 71.49 0.005
Adequate 0.00 –
Inadequate -51.64 0.063 Gestational hypertension
No 0.00 –
Yes 36.08 0.253
Gestational diabetes mellitus
No 0.00 –
Yes 47.23 0.559
Prior history of perinatal death, LBW or PMT
No 0.00 –
Yes -67.52 0.159
Smoking
No 0.00 –
Yes -133.71 < 0.001 Delivery type
Vaginal 0.00 –
Cesarian section 149.76 < 0.001 Baby’s sex
Male 0.00 –
Female -111.39 < 0.001 β: linear regression coefficient; LBW: low birth weight; PMT: prematurity
There is consensus in the literature that the
evalua-tion of maternal food consumpevalua-tion during pregnancy
is important, and studies that address this subject are still scarce. We have not found studies conducted in
Brazil on the effect of maternal dietary pattern on
the baby’s birth weight. Thus, this study sought to
Table 5. Final multivariate model between birth weight and dietary pattern in cohort of pregnant women. Petropolis and
Queimados, RJ, Southeastern Brazil, 2007-2008.
Dietary pattern Crude model
Adjusted model* and stratified by age
10 to 19 years 20 or more
β p β p β p
Prudent 26.50 0.039 55.35 0.130 12.57 0.455
Traditional -9.23 0.462 11.45 0.723 19.90 0.241
Western -15.12 0.214 15.88 0.623 10.17 0.554
Snack 17.76 0.168 56.64 0.040 6.57 0.749
* Multivariate model adjusted for age and maternal education level, marital status, social class, parity, pregestational body mass index, prenatal adequacy, smoking during pregnancy, delivery type, and dietary patterns.
contribute to determine dietary patterns during preg -nancy. The epidemiological importance of these results, based on the cohort study in two Brazilian cities, lies
in the provision of subsidies for the rationality of most appropriate nutritional intervention strategies
for pregnant women.
1. Associação Nacional de Empresas de Pesquisa.Critério de Classificação Econômica Brasil: manual. São Paulo (SP); 1997.
2. Barros FC, Victora CG, Matijasevich A, Santos IS, Horta BL, Silveira MF, et al. Preterm births, low birth weight, and intrauterine growth restriction in three birth cohorts in Southern Brazil: 1982, 1993 and 2004. Cad Saude Publica. 2008;24 Suppl 3:s390-8. DOI:10.1590/S0102-311X2008001500004
3. Brantsaeter AL, Haugen M, Samuelsen SO, Torjusen H, Trogstad L, Alexander J, et al. A dietary pattern characterized by high intake of vegetables, fruits, and vegetable oils is associated with reduced risk of preeclampsia in nulliparous pregnant Norwegian women. J Nutr. 2009;139(6):1162-8. DOI:10.3945/jn.109.104968
4. Carniel EF, Zanolli ML, Antonio MARGM, Morcillo AM. Determinantes do baixo peso ao nascer a partir das Declarações de Nascidos Vivos. Rev Bras Epidemiol. 2008;11(1):169-79. DOI:10.1590/S1415790X2008000100016
5. Chasan-Taber L, Schmidt MD, Pekow P, Sternfeld B, Solomon CG, Markenson G. Predictors of excessive and inadequate gestational weight gain in Hispanic women. Obesity (Silver Spring). 2008;16(7):1657-66. DOI:10.1038/oby.2008.256
6. Costa CE, Gotlieb SLD. Estudo epidemiológico do peso ao nascer a partir da Declaração de Nascido Vivo. Rev Saude Publica. 1998;32(4):328-34. DOI:10.1590/S0034-89101998000400004
7. Cucó G, Fernández-Ballart J, Sala J, Viladrich C, Vila J, Arija V. Dietary patterns and associated lifestyles in preconception, pregnancy and
postpartum. Eur J Clin Nutr. 2006;60(3):364-71. DOI:10.1038/sj.ejcn.1602324
8. Cunha DB, Almeida RMVR, Sichieri R, Pereira RA. Association of dietary patterns with BMI and waist circumference in a low-income neighbourhood in Brazil. Br J Nutr. 2010;104(6):908-13. DOI:10.1017/S0007114510001479
9. Fazio ES, Nomura RMY, Dias MCG, Zugaib M. Consumo dietético de gestantes e ganho ponderal materno após aconselhamento nutricional.
Rev Bras Ginecol Obstet. 2011;33(2):87-92.
DOI:10.1590/S0100-72032011000200006
10. Ferrér C, Garcia-Esteban R, Mendez M, Robieu I, Sunyer MTJ. Determinantes sociales de los patrones dietéticos durante el embrazo. Gac Sanit.
2009;23(1):38-43.
11. Fleiss JL. Statistical methods for rates and proportions. 2.ed. New York: John Wiley & Sons; 1981.
12. Hedderson MM, Weiss NS, Sacks DA, Pettitt DJ, Selby JV, Quesenberry CP, et al. Pregnancy weight gain and risk of neonatal complications: macrosomia, hypoglycemia, and hyperbilirubinemia.
Obstet Gynecol. 2006;108(5):1153-61.
DOI:10.1097/01.AOG.0000242568.75785.68
13. Kac G, Velásquez-Meléndez G. Ganho de peso gestacional e macrossomia em uma coorte de mães e filhos. J Pediatr.
2005;81(1):47-53. DOI:10.2223/JPED.1282
14. Kitajima M, Oka S, Yasuhi I, Fukuda M, Rii Y, Ishimaru T. Maternal serum triglyceride at 24–32 weeks’ gestation and newborn weight in nondiabetic women with positive diabetic screens. Obstet Gynecol. 2001;97(5 Pt 1):776-80.
15. Knusden VK, Orozova-Bekkevold IM, Mikkelsen TB, Wolff S, Olsen SF. Major dietary patterns in pregnancy and fetal growth. Eur J Clin Nutr. 2008;62(4):463-70. DOI:10.1038/sj.ejcn.1602745
16. Kotelchuck M. An evaluation of the Kessner Adequacy of Prenatal Care Index and a proposed Adequacy of Prenatal Care Utilization Index. Am J Public
Health.1994;84(9):1414-20.
17. Lacerda EMA, Kac G, Cunha CB, Leal MC. Consumo alimentar na gestação e no pós-parto segundo cor de pele no município do Rio de Janeiro. Rev Saude Publica. 2007;41(6):985-94. DOI:10.1590/S0034-89102007000600014
18. Lagiou P, Tamimi RM, Mucci LA, Adami HO, Hsieh CC, Trichopoulos D. Diet during pregnancy in relation to maternal weight gain and birth size. Eur J Clin Nutr. 2004;58(2):231-7. DOI:10.1038/sj.ejcn.1601771
19. Marchioni DML, Latorre MRDO, Eluf-Neto J, Wunsch-Filho V, Fisberg RM. Identification of dietary patterns using factor analysis in an epidemiological study in São Paulo.
Sao Paulo Med J. 2005;123(3):124-7.
DOI:10.1590/S1516-31802005000300007
20. Northstone K, Emmet P, Rogers I. Dietary patterns in pregnancy and associations with socio-demographic and lifestyle factors. Eur J Clin Nutr. 2008;62(4):471-9. DOI:10.1038/sj.ejcn.1602741
21. Nucci LB, Duncan BB, Mengue SS, Branchtein L, Schmidt MI, Fleck ET. Assessment of weight gain during pregnancy in general prenatal care services in Brazil. Cad Saude Publica. 2001;17(6)1367-74. DOI:10.1590/S0102-311X2001000600020
22. Okubo H, Miyake Y, Sasaki S, Tanaka K, Murakami K, Hirota Y, et al. Maternal dietary patterns in pregnancy and fetal growth in Japan: the Osaka Maternal and Child Health Study. Br J Nutr. 2012;107(10):1526-33. DOI:10.1017/S0007114511004636
23. Olinto MTA. Padrões de consumo alimentar: análise por componentes principais. In: Kac G, Sichieri R, Gigante D, organizadores. Epidemiologia nutricional. Rio de Janeiro (RJ): Editora Fiocruz; 2007. p.181-200.
24. Oliveira LC, Pacheco AHRN, Rodrigues PL, Schlüssel MM, Spyrides MHC, Kac G. Fatores determinantes da incidência de macrossomia em um estudo com mães e filhos atendidos em uma Unidade Básica de Saúde no município do Rio de Janeiro.
Rev Bras Ginecol Obstet 2008;30(10):486-93.
DOI:10.1590/S0100-72032008001000002
25. Padua KS, Osis MJD, Faúndes A, Barbosa AH, Moraes Filho OB. Factors associated with cesarean sections in Brazilians hospitals.
Rev Saude Publica. 2010;44(1):70-9.
DOI:10.1590/S0034-89102010000100008
26. Rasmussen KM, Yaktine AL, editors. Weight gain during pregnancy: reexamining the guidelines. Washington (DC): National Academies Press; 2009.
27. Santos GHN, Martins MG, Souza MS. Gravidez na adolescência e fatores associados com baixo peso ao nascer. Rev Bras Ginecol Obstet. 2008;30(5):224-31. DOI:10.1590/S0034-89102001000100011
28. Sichieri R, Everhart JE. Validity of a Brazilian food frequency questionnaire against dietary recalls and estimated energy intake. Nutr Res 1998;18:1649-59.
29. Sieri S, Krogh V, Pala V, Muti P, Micheli A, Evangelista A, et al. Dietary patterns and risk of breast cancer in the ORDET cohort. Cancer Epidemiol Biomarkers Prev. 2004;13(4):567-2.
30. Thompson JMD, Wall C, Becroft DMO, Robinson E, Wild CJ, Mitchell EA. Maternal dietary patterns in pregnancy and the association with small-for-gestational-age infants. Br J Nutr. 2010;103(11):1665-73. DOI:10.1017/S0007114509993606
31. Timmermans S, Steegers-Theunissen RP, Vujkovic M, Den Breeijen H, Russcher H, Lindemans J, et al. The Mediterranean diet and fetal size parameters: the Generation R Study. Br J Nutr. 2012;108(8):1399-409. DOI:10.1017/S000711451100691X
32. Uusitalo U, Arkkola T, Ovaskainen M-L, Kronberg-Kippilä C, Kenward MG, Veijola R, et al. Unhealthy patterns are associated with weight gain during pregnancy among Finnish women. Public Health Nutr. 2009;12(12):2392-9. DOI:10.1017/S136898000900528X
Research supported by the Conselho Nacional de Desenvolvimento Científico e Tecnológico (CNPq – Process 409805/2008-8). Based on the masters dissertation by Natália de Lima Pereira Coelho, titled: “Associação entre padrões de consumo alimentar gestacional e peso ao nascer”, presented in the Graduate Program in Epidemiology at Escola Nacional de Saúde Pública Sergio Arouca, in 2011.