ABSTRACT:Introduction: Inadequate dietary patterns in childhood and adolescence are a major risk factor
for the early onset of obesity and other chronic diseases. Objectives: To identify and to analyze dietary patterns among Brazilian adolescents. Methods: Data from the Brazilian National School Health Survey (PeNSE) of 2015 were used (n = 10,926 adolescents). The identification and analyses of dietary patterns were calculated using principal component analysis and linear regression, respectively. Results: Two dietary patterns were identified. The first one was characterized by the presence of markers of unhealthy eating, and the second one by markers of healthy eating. The adherence to the unhealthy pattern was positively associated with female adolescents, which mothers had completed, at least, the elementary school, residents in developed regions and urban areas, as well as those students who usually chose to skip breakfast, to not have meals with their parents/ guardians, and who usually had meals while watching TV/studying, and at fast food restaurants. Discussion: Analyses of the consumption of isolated food groups, which do not consider the diet in all its complexity, have been insufficient in explaining the main outcomes of the public health nutrition area. Conclusion: Our findings contributed to the identification of the most vulnerable population groups to unhealthy dietary patterns and to the understanding of the coexistence of different food habit determinants among adolescents.
Keywords: Food consumption. Multivariate analysis. Feeding behavior. Adolescent. Public health.
Dietary patterns, sociodemographic
and behavioral characteristics among
Brazilian adolescents
Padrões alimentares, características sociodemográficas
e comportamentais entre adolescentes brasileiros
Emanuella Gomes MaiaI, Luiza Eunice Sá da SilvaII, Maria Aline Siqueira SantosIII,
Laura Augusta BarufaldiIII, Simoni Urbano da SilvaIII, Rafael Moreira ClaroIV
ORIGINAL ARTICLE / ARTIGO ORIGINAL
INursing Postgraduate Program, Universidade Federal de Minas Gerais – Belo Horizonte (MG), Brazil. IINutrition and Health Postgraduate Course, Universidade Federal de Minas Gerais – Belo Horizonte (MG), Brazil. IIIDepartment of Noncommunicable Disease Surveillance and Health Promotion, Ministério da Saúde – Brasília (DF), Brazil. IVDepartment of Nutrition, School of Nursing, Universidade Federal de Minas Gerais – Belo Horizonte (MG), Brazil.
Corresponding author: Emanuella Gomes Maia. Avenida Professor Alfredo Balena, 190, Santa Efigênia, CEP: 30130-100, Belo Horizonte, MG, Brazil. E-mail: [email protected]
INTRODUCTION
In Brazil, the eating habits of adolescents have been characterized by the high consump-tion of pre-cooked meals, with easy preparaconsump-tion, and ultraprocessed foods (rich in fats, sug-ars, and sodium)1,2, in addition to the insufficient intake of fresh foods that are traditional in
the Brazilian staple diet, such as beans and vegetables3,4. Such a pattern is influenced, among
other things, by the increasing adoption of unhealthy eating behaviors, such as the habit of eating in front of the TV5 or not having family meals6.
Inadequate eating habits in childhood and adolescence is considered a major risk factor for the early onset of obesity and other chronic noncommunicable diseases (NCD), such as cardiovascular diseases, diabetes and cancer7,8, with serious repercussions during
adult-hood9,10. It is known, however, that excessive weight gain and NCD do not result from the
consumption of isolated food groups but from inadequate dietary patterns. In this per-spective, robust analytical approaches have been requested in order to identify dietary pat-terns11,12, allowing a broader and more realistic representation of how foods are consumed,
in addition to allowing the analysis of these dietary patterns, exposing sociodemographic and behavioral characteristics, as well as the risk factors for NCD.
In order to subsidize youth-friendly health policies, the World Health Organization (WHO) has proposed the creation of surveillance systems for adolescent-specific risk and protection factors for NCD, to be developed in the school environment13. Based on regular
surveys conducted in schools, the current version of the Brazilian National School Health Survey (PeNSE) was carried out in 201514.
RESUMO:Introdução: Padrões inadequados de alimentação na infância e na adolescência são um dos principais fatores de risco para o aparecimento precoce da obesidade e de outras doenças crônicas. Objetivos: Identificar e analisar os padrões alimentares entre os adolescentes brasileiros. Métodos: Foram utilizados dados da Pesquisa Nacional de Saúde do Escolar de 2015 (n = 10.926 adolescentes). A identificação e a análise dos padrões alimentares foram realizadas por meio da análise de componentes principais e pela regressão linear, respectivamente. Resultados: Dois padrões foram identificados: o primeiro, caracterizado por marcadores de uma alimentação não saudável; e o segundo, por marcadores de uma alimentação saudável. A adesão ao padrão não saudável esteve positivamente associada aos adolescentes do sexo feminino, que possuem mães com, ao menos, ensino fundamental completo, que residem em regiões mais desenvolvidas e em área urbana, bem como entre aqueles que possuem o hábito de não tomar café da manhã, não realizar as refeições com os pais/responsáveis, se alimentar enquanto estuda ou assiste TV e frequentar restaurantes fast-food. Discussão: Análises do consumo de grupos alimentares isolados, que não consideram a dieta em toda a sua complexidade, têm se mostrado insuficientes na explicação dos principais desfechos da área de nutrição em saúde pública. Conclusão: Os achados contribuíram para a identificação de grupos populacionais mais vulneráveis ao padrão alimentar não saudável e para a compreensão da coexistência de diferentes determinantes ao hábito alimentar entre os adolescentes.
In this context, the relevance of the present study is not only to analyze a representative database of the country’s adolescents, but also to use a multivariate analytical approach to identify dietary patterns. This proposal allows the contextualization of risk behaviors for poor nutrition and, consequently, contributes to the country’s nutritional epidemiology. Thus, this study aims to identify patterns formed by markers of healthy and unhealthy food consumption among Brazilian adolescents and to analyze their association with the socio-demographic characteristics and eating behaviors of this population.
METHODOLOGY
STUDY POPULATION, SAMPLING AND DATA COLLECTION
This cross-sectional study was carried out with data from PeNSE 2015. This survey has been carried out periodically (every three years) as a result of a partnership between the Ministry of Health (MS), the Ministry of Education (MEC), and the Brazilian Institute of Geography and Statistics (IBGE). The sample plan adopted in PeNSE 2015 differs from that used in previous surveys (2009 and 2012)15,16 to represent not only the students in the
9th grade of elementary school, but also the entire population of Brazilian adolescents (13
to 17 years old)14.
PeNSE 2015 uses a complex sample involving the stratification of the national territory, which was composed of the five major regions of the country (North, Northeast, Southeast, South and Midwest) with a sample of schools scaled and selected randomly in each stra-tum. In these schools, classes of students from the 6th grade (old 5th grade) of elementary
school to the 3rd grade of high school were chosen and asked to respond to the survey
ques-tionnaire14. More details on sample size scaling can be found in the survey’s initial
publica-tion14. Finally, although data were collected from all students in the participating classes, the
analysis was carried out in the 13-17 age group, due to the initial plan of guaranteeing the study’s external validity to international studies, with a final sample of 10,926 adolescents.
Data collection was performed between April and September 2015, using smartphones containing a structured and self-administered questionnaire divided into thematic modules. Although the themes investigated in 2015 were similar to those discussed in previous edi-tions (such as sociodemographic characteristics, eating habits, physical activity, smoking, sexual behavior, among others)15,16, adaptations were made to facilitate its understanding
by adolescents and to standardize the response options according to recommendations of the Global School-Based Student Health Survey (GSHS), developed by WHO14.
STUDY VARIABLES
(except for manioc/cassava), fresh fruits or fruit salad, treats (such as sweets, candy, choc-olate, chewing gum, lollipops), deep-fried pastries (such as coxinha, fried kibe, potato fries, except for packet chips), soft drinks, and processed/ultraprocessed salted foods (such as hamburger, ham, mortadella, salami, sausages, hotdogs, instant noodles, packet chips or salty crackers). The first three items are markers of healthy food consumption7,8, while
the others indicate unhealthy food consumption7,8. The questions to identify the
con-sumption of each of the food groups had the following structure: “In the last 7 days, how many days did you eat (name of food group)? [Did not eat (food) in the last 7 days | 1 day in the last 7 days | 2 days in the last 7 days | 3 days in the last 7 days | 4 days in the last 7 days | 5 days in the last 7 days | 6 days in the last 7 days | every day in the last 7 days]”.
Eating behavior was characterized by regular breakfast, lunch/dinner with parents or guardians, eating while watching TV or studying, and eating at fast food restaurants. Eating behaviors were evaluated based on the following questions: “Do you usually eat breakfast?”, “Do you usually have lunch or dinner with your mother, father or guardian?”, “Do you usually eat when you are watching TV or studying?”, with similar response cate-gories: “[Yes, every day | Yes, 5 to 6 days a week | Yes, 3 to 4 days a week | Yes, 1 to 2 days a week | Rarely | No]”. In addition, the following question was asked: “In the last 7 days, how many days have you eaten at fast-food restaurants, such as snack bars, hot dog stalls, pizzeria, etc.?” With the following possible answers: “[Did not eat at fast food restaurant in the last 7 days | 1 day in the last 7 days | 2 days in the last 7 days | 3 days in the last 7 days | 4 days in the last 7 days | 5 days in the last 7 days | 6 days in the last 7 days | Every day in the last 7 days]”. Subsequently, all these variables were recoded in dichotomous indicators (<5 days/week | ≥ 5 days/week).
The following sociodemographic characteristics were also analyzed: gender [male | female]; two age groups [13 to 15 years old | 16 and 17 years]; maternal schooling [the mother did not study, or started elementary school, but did not finish | the mother finished elementary school, or started high school, but did not finish | the mother finished high school, or started higher education, but did not finish | the mother finished higher educa-tion]; geographic region [North, Northeast | Southeast, South, Midwest]; Situation [Rural | Urban]; and school type [Private | Public].
DATA ANALYSIS
The population studied was characterized by the distribution (%) of their sociodemo-graphic characteristics and eating behaviors. Measurements of central tendency (mean weekly frequency) and dispersion (95% confidence interval) were then estimated for mark-ers of healthy and unhealthy diet.
the composition of the patterns17. Then, the Varimax orthogonal rotation was applied
in order to achieve a simpler structure and to facilitate the interpretation of the results. Factors with a load magnitude greater than 0.30 (in modulus) were considered significant for the pattern, since negative loads indicate that the factor is inversely associated with the pattern, and positive loads indicate a direct association. Therefore, the greater the magni-tude of the factor load, the greater its contribution to the pattern17. It is worth
mention-ing that in PCA, the first extracted pattern represents the greater part of the variability of the set of variables, while the second pattern, independently of the first one, explains the maximum possible of the remaining variability, and so on, without any correlation between the components17.
Therefore, the contextualization of the first pattern identified was performed using lin-ear regression models, with the sociodemographic and eating behavior characteristics ana-lyzed as explanatory variables, and the dietary pattern as outcome variable. In the adjusted model, sociodemographic characteristics and eating behaviors were inserted in increasing order of significance (p-value).
Weighting was used in all analyzes, except in the estimation of the simultaneous adher-ence of the individual to more than one pattern.
Stata statistical software (version 13.1) was used to organize and analyze data, taking into account the complex design of the PeNSE sample. Significance was determined at p < 0.05.
PeNSE was approved by the National Commission on Ethics in Research (CONEP) of the National Health Council (CNS).
RESULTS
The population studied by PeNSE 2015 comprised 10,926 adolescents (aged 13 to 17 years), 50.3% were male, 61.9% were aged between 13 and 15 years old, and almost half had mothers with no schooling or incomplete elementary school (48.7%). The majority of the adolescents lived in the Center-South Region of the country (62.2%), in urban areas (94.5%) and came from public schools (87.1%) (Table 1).
In the totality of the research, the highest weekly frequencies of consumption were observed for the intake of beans (4.57 days/week) and vegetables (3.43 days/week), among markers of healthy eating; and for the consumption of treats (3.76 days/week) and ultrap-rocessed salted foods (3.26 days/week), among markers of unhealthy eating (Table 2). Regarding eating behaviors, about two-thirds of the adolescents had the habit of eating breakfast and having meals with parents or guardians for five or more days in the week (63.5% and 68.5%, respectively); while nearly half of the adolescents had a habit (≥ 5 days/ week) of eating while studying or watching TV (48.8%), and about one in twenty reported a habit of eating at fast-food restaurants (5.5%) (Table 3).
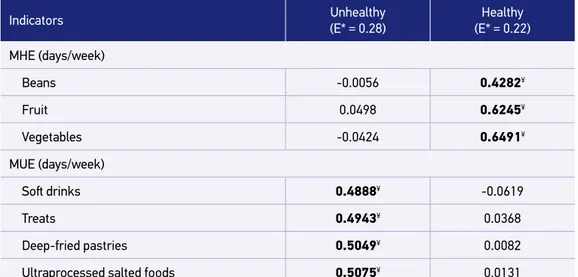
rotation, the two patterns explained 50% of the total variability, and pattern 1 represents a measure-synthesis of the analysis and is responsible for the largest portion of explana-tion of the model (28%). Pattern 1 was characterized by the consumpexplana-tion of markers of an unhealthy diet (soft drinks, treats, deep-fried pastries and ultraprocessed salted foods), while pattern 2 was marked by the consumption of markers of a healthy diet (beans, fruits and vegetables) (Table 4).
In the unadjusted (bivariate) analysis, adherence to the unhealthy pattern was positively associated with females (p < 0.05), whose mothers had at least completed elementary school
Sociodemographic characteristics n %* 95%CI
Gender
Male 5,522 50.3 48.6 – 51.9
Female 5,404 49.7 48.1 – 51.4
Age (years)
13 to 15 7,119 61.9 58.1 – 65.6
16 to 17 3,807 38.1 34.4 – 41.9
Maternal schooling
Did not study, did not complete ES 4,722 48.7 46.1 – 51.3
Completed ES, did not complete HS 1,352 13.6 12.5 – 14.8
Completed HS, did not complete HE 2,748 24.0 22.4 – 25.7
Completed HE 2,104 13.7 11.9 – 15.8
Geographic region
North, Northeast 4,416 37.8 34.9 – 40.7
Southeast, South, Midwest 6,510 62.2 59.3 – 65.1
Situation
Rural 487 5.5 3.7 – 8.2
Urban 10,439 94.5 91.8 – 96.3
School type
Private 2,639 12.9 11.0 – 15.1
Public 8,287 87.1 84.9 – 89.0
Total 10,926 100.0
Table 1. Distribution of sociodemographic characteristics among Brazilian adolescents (aged 13 to 17 years). PeNSE, 2015.
(p < 0.001), residing in more developed regions (p < 0.001), in an urban area (p < 0.001) and from private schools (p < 0.05). As for eating behaviors, there was a direct association between the unhealthy dietary pattern and the habits of not having breakfast (< 5 days/ week) (p < 0.001), not having meals with parents or guardians (< 5 days/week) (p < 0.001), eating while studying or watching TV (≥ 5 days/week) and eating at fast food restaurants (≥ 5 days/week) (p < 0.001) (Table 5). These coefficients of association remained similar in multivariate regression models. Although, the association coefficients were reduced in magnitude after adjustment, the meaning and significance of the relationships observed in the bivariate models remained constant, except for the school type, which became non-sig-nificant (p ≥ 0.05) (Table 5).
Table 2. Average weekly frequency of markers of healthy and unhealthy eating among Brazilian adolescents (aged 13 to 17 years). PeNSE, 2015.
Indicators Mean* 95%CI
MHE (days/week)
Beans 4.57 4.46 – 4.68
Fruit 3.09 3.00 – 3.17
Vegetables 3.43 3.35 – 3.52
MUE (days/week)
Soft drinks 2.97 2.87 – 3.06
Treats 3.76 3.68 – 3.84
Deep-fried pastries 2.01 1.95 – 2.07
Ultraprocessed salted foods 3.26 3.16 – 3.35
PeNSE: Brazilian National School Health Survey; CI: confidence interval; MHE: markers of healthy eating; MUE: markers of unhealthy eating; *weekly consumption (days/week).
Table 3. Frequency of eating behaviors among Brazilian adolescents (aged 13 to 17 years). PeNSE, 2015.
Eating behaviors (≥ 5 days/week) n %* 95%CI
Having breakfast 6,856 63.5 61.6 – 65.3
Having meals with parents/guardians 7,541 68.5 66.6 – 70.4
Eating while studying or watching TV 4,933 48.8 47.2 – 50.4
Eating at fast food restaurants 623 5.5 4.8 – 6.3
DISCUSSION
Data on the health status of Brazilian adolescents from public and private schools in the country collected by PeNSE 2015 allowed the identification, in an unprecedented way, of the association between sociodemographic characteristics and eating behaviors of about 11,000 adolescents and the dietary patterns of this population. Based on the record of mark-ers of healthy and unhealthy food consumption, two significant patterns were identified. Pattern 1, characterized by the consumption of markers of unhealthy eating, and pattern 2, by the consumption of markers of healthy eating. Female adolescents, whose mothers had at least completed elementary school, who lived in more developed regions (Southeast, South, Midwest) and in urban areas, had a positive association with the non-healthy pat-tern. This same association was observed among those adolescents who had a habit of not eating breakfast, not having meals with their parents or guardians, eating while studying or watching TV and eating at fast food restaurants.
The demand for studies that consider the complexity of food consumption in data anal-ysis has increased in recent years11,18. Analysis of the consumption of isolated food groups
(or foods), which do not consider the diet in all its complexity, have been insufficient in explaining the main outcomes of interest in the area of nutrition in public health. However, comparing the results of the present study with the literature using a similar (comparable) methodological approach requires caution, especially because of the variety of instruments available for recording food consumption and the statistical procedures applied in the iden-tification of patterns, both capable of directly influencing the results.
Table 4. Factorial loads (rotated) for the first two patterns obtained in the principal component
analysis with Brazilian adolescents (aged 13 to 17 years). PeNSE, 2015.
Indicators Unhealthy
(E* = 0.28)
Healthy (E* = 0.22)
MHE (days/week)
Beans -0.0056 0.4282¥
Fruit 0.0498 0.6245¥
Vegetables -0.0424 0.6491¥
MUE (days/week)
Soft drinks 0.4888¥ -0.0619
Treats 0.4943¥ 0.0368
Deep-fried pastries 0.5049¥ 0.0082
Ultraprocessed salted foods 0.5075¥ 0.0131
Table 5. Coefficients of association of unhealthy dietary patterns with sociodemographic characteristics and eating behaviors among Brazilian adolescents (aged 13 to 17 years old). PeNSE, 2015.
Indicators Crude Coefficient
≈
(95%CI)
Adjusted Coefficient≈≈
(95%CI)
Sociodemographic characteristics
Gender
Male Reference Reference
Female 0.10 (0.01 – 0.18)* 0.10 (0.02 – 0.19)*
Age (years)
13 to 15 Reference Reference
16 to 17 0.08 (-0.03 – 0.18) 0.02 (-0.07 – 0.11)
Maternal schooling
Did not study, did not complete ES Reference Reference
Completed ES, did not complete HS 0.21 (0.11 – 0.31)** 0.19 (0.09 – 0.29)**
Completed HS, did not complete HE 0.21 (0.12 – 0.30)** 0.15 (0.07 – 0.23)**
Completed HE 0.22 (0.11 – 0.34)** 0.17 (0.07 – 0.28)*
Geographic region
North, Northeast Reference Reference
Southeast, South, Midwest 0.23 (0.12 – 0.34)** 0.16 (0.07 – 0.26)*
Situation
Rural Reference Reference
Urban 0.60 (0.38 – 0.82)** 0.39 (0.18 – 0.60)**
School type
Private Reference Reference
Public -0.13 (-0.25 – -0.02)* -0.07 (-0.17 – 0.04)
Eating behaviors¥
Having breakfast in the morning -0.22 (-0.30 – -0.14)** -0.13 (-0.21 – -0.06)*
Having meals with parents/guardians -0.16 (-0.24 – -0.07)** -0.07 (-0.14 – 0.00◊)*
Eating while studying or watching TV 0.48 (0.42 – 0.55)** 0.45 (0.39 – 0.52)**
Eating at fast food restaurants 1.54 (1.37 – 1.71)** 1.50 (1.34 – 1.67)**
PeNSE: Brazilian National School Health Survey; ES: elementary school; HS: high school; HE: higher education; CI: confidence interval; ¥ the reference category is non-regular eating behavior (< 5 days/week); ≈coefficient obtained by
bivariate linear regression; ≈≈coefficient obtained by multivariate linear regression, adjusted for sociodemographic
As in the present study, it is common to identify two to three dietary patterns composed exclusively of healthy or unhealthy foods11,19,20. The pattern characterized by markers of an
unhealthy diet, in turn, has stood out for presenting greater explanation of the total variance of the model, be it in studies developed in Brazil19 or elsewhere20. A cross-sectional study
carried out in the city of Salvador, Bahia, with adolescents from public schools, identified three food patterns (according to 19 food items or food groups), and the one considered to be a non-healthy, the western pattern, accounted for almost half of the model’s total vari-ance (42.48%)19. A similar scenario was observed in a longitudinal study developed in Spain,
in which, according to 17 food items or food groups, three patterns were identified with a total of 37.89% of the variance answered. Of these, the first two significant patterns, both characterized by unhealthy food markers, accounted for 29.26%, being: “sweet and fatty food pattern” (18.03%) and “western pattern” (11.23%)20. Adherence to these patterns may
reflect changes in the population’s lifestyle, including not only a higher frequency of the habit of eating out, but also increased consumption of ultraprocessed foods2,21.
It is known that many factors are capable of influencing food consumption, from the biological ones, pertinent to the individual, to aspects of the family environment and of the built environment22,23. Especially with regard to the food consumption of children and
adolescents, it is known that the family environment plays a decisive role in the adoption of healthy eating habits24. The findings of this research corroborate those of studies from
other countries6,25, since behaviors such as the habit of eating breakfast and having a meal
with the parents/guardians showed an inverse association with the unhealthy dietary pat-tern, and behaviors such as eating while studying or watching TV and eating at fast food restaurants regularly presented a direct association with this standard. It is worth mention-ing that adolescent adherence to the unhealthy dietary pattern had a greater magnitude in the habitual presence (≥ 5 days/week) of risk behaviors than in the absence (< 5 days/ week) of protective behaviors.
The association between the composition of dietary patterns and the sociodemographic characteristics of adolescents was also identified in the present study. Consistent with data from PeNSE 2009 on consumption and eating behaviors among Brazilian adolescents26, female
adolescents were positively associated with the pattern characterized by markers of unhealthy eating (soft drinks, sweets, deep-fried pastries and ultraprocessed salted foods) in comparison to male adolescents. However, no significant association between age and dietary patterns was identified, possibly because the sample was made up only of adolescents, and with a low amplitude of age range (13 to 17 years). Although the economic conditions of the adolescent or their family were not directly verified, more adherence to the unhealthy dietary pattern was observed among adolescents whose mothers had at least completed elementary school, resid-ing in more developed regions of the country (Southeast, South, Midwest), and in urban areas. The association between dietary patterns and the health condition of adolescents has been strongly highlighted in recent decades18,27. However, a scenario of inadequate food
consumption, the high prevalence of overweight and associated diseases still persist in this population14. In 2015, one in four Brazilian adolescents was overweight (23.7%), which is
Some limitations should be noted. The use of a simplified and self-administered food consumption frequency questionnaire, as well as self-reported information for eating behav-iors, does not allow a detailed analysis of the adolescents’ eating habits. However, such an approach is considered valid and widely used in large surveys on health and lifestyle con-ditions13,28 because of its simplicity and of the low cost of obtaining it in large population
samples. In addition, the ethical implications of conducting the survey are minimized, as the adolescents participate in the survey without identifying themselves.
These results point to the need to expand and intensify actions to promote, protect and support healthy diets for young people. The expansion of the actions of the School Health Program (PSE)29, both with adolescents and with their parents or guardians, could benefit
the adherence of adolescents to the pattern characterized by markers of healthy eating, since behaviors such as having breakfast or having meals in company could be stimulated. On the other hand, regulation of the presence of canteens or alternative points of sale of food, as well as control of the products marketed in these establishments in schools, also need to be strengthened30.
CONCLUSION
The use of data representative of the universe of Brazilian adolescents, together with the use of a multivariate analytical approach, allowed the identification of the main dietary patterns of this population group, as well as the dietary behaviors and sociodemographic characteristics associated with the unhealthy dietary pattern. Such results benefit the mon-itoring, evaluation and strengthening of actions directed to the promotion of healthy eat-ing in the country.
ACKNOWLEDGEMENTS
The authors would like to thank the Coordination of Improvement of Higher Education Personnel (CAPES) for the scholarship funding.
1. Monteiro CA, Moubarac JC, Cannon G, Ng SW, Popkin B. Ultraprocessed products are becoming dominant in the global food system. Obes Rev. 2013; 14(Supl. 2): 21-8. https://doi.org/10.1111/ obr.12107
2. Martins APB, Levy RB, Claro RM, Moubarac JC, Monteiro CA. Participação crescente de produtos ultraprocessados na dieta brasileira (1987-2009). Rev
Saúde Pública. 2013; 47(4): 656-65. http://dx.doi.org /10.1590/S0034-8910.2013047004968
3. Castro IRR, Cardoso LO, Egstrom EM, Levy RB, Monteiro CA. Vigilância de fatores de risco para doenças não transmissíveis entre adolescentes: a experiência da cidade do Rio de Janeiro, Brasil. Cad Saúde Pública. 2008; 24: 2279-88. http://dx.doi. org/10.1590/S0102-311X2008001000009
4. Azeredo CM, de Rezende LFM, Canella DS, Claro RM, de Castro IRR, Luiz Odo C, et al. Dietary intake of Brazilian adolescents. Public Health Nutr. 2015; 18(7): 1215-24. https://doi.org/10.1017/ S1368980014001463
5. Camelo LDV, Rodrigues JFDC, Giatti L, Barreto SM. Lazer sedentário e consumo de alimentos entre adolescentes brasileiros: Pesquisa Nacional de Saúde do Escolar (PeNSE), 2009. Cad Saúde Pública. 2012; 28: 2155-62. http://dx.doi.org/10.1590/ S0102-311X2012001100015
6. Larson N, MacLehose R, Fulkerson JA, Berge JM, Story M, Neumark-Sztainer D. Eating breakfast and dinner together as a family: Associations with sociodemographic characteristics and implications for diet quality and weight status. J Acad Nutr Diet. 2013; 113(12): 1601-9. https://doi.org/10.1016/j. jand.2013.08.011
7. World Health Organization. Diet, Nutrition and the Prevention of Chronic Diseases. Report of a Joint WHO/FAO Expert Consultation. Genebra: World Health Organization; 2003.
8. Dauchet L, Amouyel P, Hercberg S, Dallongeville J. Fruit and vegetable consumption and risk of coronary heart disease: a meta-analysis of cohort studies. J Nutr. 2006; 136: 2588-93. https://doi.org/10.1093/jn/136.10.2588 9. Mikkilä V, Räsänen L, Raitakari OT, Pietinen P, Viikari J. Consistent dietary patterns identified from childhood to adulthood: the cardiovascular risk in Young Finns Study. Br J Nutr. 2005; 93(6): 923-31. https://doi. org/10.1079/BJN20051418
10. Craigie AM, Lake AA, Kelly SA, Adamson AJ, Mathers JC. Tracking of obesity-related behaviours from childhood to adulthood: a systematic review. Maturitas. 2011; 70(3): 266-84. https://doi.org/10.1016/j. maturitas.2011.08.005
11. Tavares LF, Castro IRR, Levy RB, Cardoso LO, Claro RM. Padrões alimentares de adolescentes brasileiros: resultados da Pesquisa Nacional de Saúde do Escolar (PeNSE). Cad Saúde Pública. 2014; 30(12): 1-13. http:// dx.doi.org/10.1590/0102-311X00016814
12. Mu M, Xu L, Hu D, Wu J, Bai M. Dietary Patterns and Overweight/Obesity: A Review Article. Iran J Public Health. 2017; 46(7): 869-76.
13. World Health Organization. Global school-based student health survey. Genebra: World Health Organization; 2011.
14. Instituto Brasileiro de Geografia e Estatística. Pesquisa Nacional de Saúde Escolar 2015. Rio de Janeiro: Instituto Brasileiro de Geografia e Estatística; 2016.
15. Instituto Brasileiro de Geografia e Estatística. Pesquisa Nacional de Saúde Escolar 2009. Rio de Janeiro: Instituto Brasileiro de Geografia e Estatística; 2009.
16. Instituto Brasileiro de Geografia e Estatística. Pesquisa Nacional de Saúde Escolar 2012. Rio de Janeiro: Instituto Brasileiro de Geografia e Estatística; 2013.
17. Hair JF, Black WC, Babin BJ, Anderson RE. Multivariate Data Analysis. 7ª ed. Nova Jersey: Prentice Hall; 2010. 18. Silva DFO, Lyra CO, Lima SCVC. Padrões alimentares de adolescentes e associação com fatores de risco cardiovascular: uma revisão sistemática. Ciên Saúde Coletiva. 2016; 21(4): 1181-96. http://dx.doi. org/10.1590/1413-81232015214.08742015
19. Silva RCR, Fiaccone RL, Machado MEPC, Ruiz AS, Barreto ML, Santana MLP. Body image dissatisfaction and dietary patterns according to nutritional status in adolescents. J Pediatr. 2018; 94(2): 155-61. https://doi. org/10.1016/j.jped.2017.05.005
20. Aparicio E, Canals J, Voltas N, Valenzano A, Arija Va. Emotional Symptoms and Dietary Patterns in Early Adolescence: A School-Based Follow-up Study. J Nutr Educ Behav. 2017; 49(5). https://doi.org/10.1016/j. jneb.2017.01.015
21. Braithwaite I, Stewart AW, Hancox RJ, Beasley R, Murphy R, Mitchell EA, et al. Fast-food consumption and body mass index in children and adolescents: an international cross-sectional study. BMJ Open. 2014; 4: e005813. https://doi.org/10.1136/ bmjopen-2014-005813
22. Cleveland M, Laroche M, Hallab R. Globalization, culture, religion, and values: Comparing consumption patterns of Lebanese Muslims and Christians. J Business Res. 2013; 66: 958-67. https://doi.org/10.1016/j. jbusres.2011.12.018
23. Yee AZH, Lwin MO, Ho SS. The influence of parental practices on child promotive and preventive food consumption behaviors: a systematic review and meta-analysis. Int J Behav Nutr Phys Act. 2017; 14: 47. https://doi.org/10.1186/s12966-017-0501-3 24. Orihuela CA, Mrug S, Boggiano MM. Reciprocal
relationships between emotion regulation and motives for eating palatable foods in African American adolescents. Appetite. 2017; 117: 303-9. https://doi. org/10.1016/j.appet.2017.07.008
25. Slater ME, Sirard JR, Laska MN, Pereira MA, Lytle LA. Relationships between energy balance knowledge and the home environment. J Am Diet Assoc. 2011; 111(4): 556-60. https://dx.doi.org/10.1016%2Fj. jada.2011.01.011
27. Santaliestra-Pasías AM, Mouratidou T, Huybrechts I, Beghin L, Cuenca-García M, Castillo MJ, et al. Increased sedentary behaviour is associated with unhealthy dietary patterns in European adolescents participating in the HELENA study. Eur J Clin Nutr. 2014; 68(3): 300-8. https://doi.org/10.1038/ejcn.2013.170
28. Instituto Brasileiro de Geografia e Estatística. Pesquisa Nacional de Saúde 2013. Percepção do estado de saúde, estilos de vida e doenças crônicas. Ministério do Planejamento, Orçamento e Gestão. Rio de Janeiro: Instituto Brasileiro de Geografia e Estatística; 2014. 29. Brasil. Ministério da Educação. Ministério da Saúde.
Decreto nº 6.286, de 5 de dezembro de 2007. Institui
o Programa Saúde na Escola - PSE, e dá outras providências. Brasil; 2007.
30. Azeredo CM, Rezende LF, Canella DS, Claro RM, Peres MF, Luiz Odo C, et al. Food environments in schools and in the immediate vicinity are associated with unhealthy food consumption among Brazilian adolescents. Prev Med. 2016; 88: 73-9. https://doi.org/10.1016/j. ypmed.2016.03.026
Received on: 10/13/2017
Final version presented on: 12/12/2017 Accepted on: 02/02/2018