Julio A PotericoI
Antonio Bernabé-OrtizI,II
Christian Loret de MolaI,III,IV
J Jaime MirandaI,V
I Centro de Excelencia en Enfermedades Crônicas. Universidad Peruana Cayetano Heredia. Lima, Perú
II Unidad de Epidemiología, Facultad de Salud Pública y Administración, Universidad Peruana Cayetano Heredia. Lima, Perú
III Programa de Pós-Graduação em Epidemiologia, Universidade Federal de Pelotas. Pelotas, RS, Brasil
IV Grupo Latinoamericano de Investigaciones Epidemiológicas. Organización
Latinoamericana para el Fomento de la Investigación en Salud. Bucaramanga, Colombia
V Departamento de Medicina. Facultad de Medicina, Universidad Peruana Cayetano Heredia. Lima, Perú
Correspondence: Julio A. Poterico
Av. Armendariz 497, 2do piso Mirafl ores, Lima 18, Perú E-mail: [email protected] Received: 7/15/2011 Approved: 3/11/2012
Article available from: www.scielo.br/rsp
Association between television
viewing and obesity in Peruvian
women
ABSTRACT
OBJECTIVE: To assess the association between frequency of television viewing, overweight and obesity in a nationally representative sample of Peruvian women.
METHODS: Secondary analysis of the Demographic and Health Survey 2008 including women aged from 15 to 49 years old. The outcome variables were obesity (body mass index ≥ 30 kg/m2) and overweight (body mass index ≥ 25 but < 30 kg/m2) whereas the exposure variable was frequency of television viewing (never, occasionally, almost every day). Logistic regression taking into account the multistage study design and adjusting for potential confounders was used. Results were presented as adjusted odds ratios (aOR) with 95% confi dence intervals (95%CI).
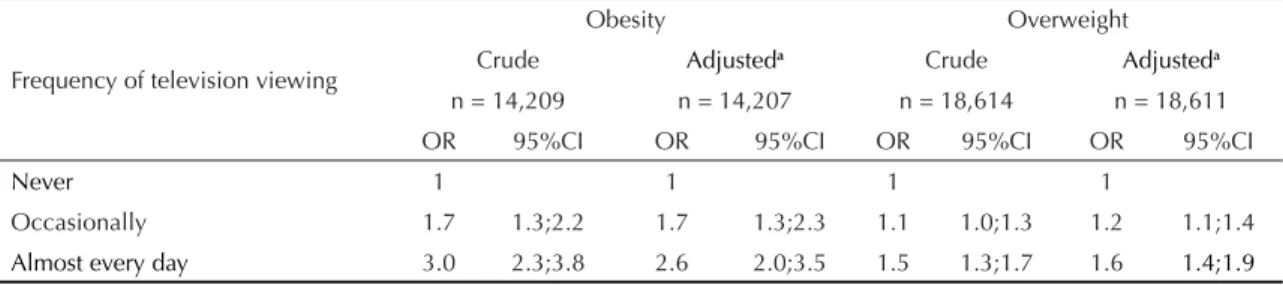
RESULTS: A total of 21,712 women were included in the analysis. The prevalence of overweight was 34.7% (95%CI 33.8%;35.7%), and obesity prevalence was 14.3% (95%CI 13.6%;15.1%). Compared to women who never watched television, those who reported watching television occasionally and almost daily were more likely to be obese: aOR 1.7 (95%CI 1.3;–2.3) and aOR 2.6 (95%CI 2.0;3.5), respectively. The magnitude of this association was lower for overweight: aOR 1.2 (95CI 1.3;2.3) and aOR 1.6 (95%CI 1.1;1.4), respectively. The strength of the association was greater in urban areas.
CONCLUSIONS: Frequency of television viewing was associated with overweight and obesity in Peruvian women and the strength of this association varied by area of residence. These fi ndings can provide input to strategies for obesity prevention in the Peruvian context.
DESCRIPTORS: Women. Obesity, epidemiology. Sedentary Lifestyle. Television, utilization. Health Surveys.
INTRODUCTION
Several chronic conditions including obesity have signifi cantly increased in recent years, especially in developing countries.19 At the same time there has been an increase in cardiovascular deaths in Peru.10 Certain activities such as television viewing for several hours may contribute to a sedentary lifestyle with increased caloric intake and low levels of physical activity predisposing to overweight and obesity, which in turn contributes to the development of
chronic non-communicable diseases (NCDs).13
mellitus.4,9 A prospective study carried out in British adults found an independent association between frequency of television viewing and mortality from all causes including those from cardiovascular diseases.25
In the light of the epidemiological10 and nutritional transition17 that Peruvian society is experiencing, it is crucial to better understand potential risk factors associ-ated with high rates of obesity. Thus, the present study aimed to assess the association between frequency of television viewing and obesity in women.
METHODS
Cross-sectional study that analyzed secondary data from the Peruvian National Demographic and Health Survey (DHS) conducted by the National Institute of Statistics and Informatics in 2008 (ENDES Línea de Base). This survey is regularly conducted as part of the DHS global program. It has a multistage, self-weighted design using random sampling of areas and a represen-tative population at the national level.
According to the World Bank, Peru is an upper-middle income country with an estimated population of 29 million people. About 80% of the population lives in urban areas, and about 30% are below the poverty line. The offi cial language is Spanish, but there are other native languages spoken in Peru such as Quechua and Aymara, among others, especially spoken in Andean and jungle areas.a
The DHS is a national survey conducted in urban and rural areas of 24 departments in Peru. The DHS 2008 comprised women aged between 15 and 49 years. A total of 1,097 clusters were selected comprising 29,196 households. There was collected sociodemo-graphic and health information, including anthropo-metric measurements. In rural areas, primary sampling units were villages with 500 to 2,000 inhabitants. In urban areas, primary sampling units were blocks or groups of blocks that together consisted on average of 120 households. The secondary units of analysis for both rural and urban areas were private households, which were part of their corresponding primary sampling units.
The study outcomes were obesity and overweight, evaluated using the body mass index (BMI). Both weight and height were measured using standard techniques. Weight measures were taken with light clothing and without shoes, using an electronic balance with 0.1 kg precision. Height was measured using a measuring tape to the nearest 0.1cm. Obesity and overweight were defi ned according to interna-tional standards as BMI ≥ 30 kg/m2 and BMI ≥ 25 but
a The World Bank. Peru: Data.[cited 2012 May 14] Available from: http://data.worldbank.org/country/peru
< 30 kg/m2; respectively. Normal weight was defi ned as BMI between 18.5 and 24.9 kg/m2.1
The exposure of interest was self-reported frequency of television viewing. Following the DHS methodology, respondents were asked: “Do you watch television almost every day, at least once a week, several times a week or never?” Of all respondents, 2.7% answered “at least once a week.” Thus, the exposure variable analyzed was divided into three categories: almost every day; occasionally (several times a week and at least once a week); and never.
The covariates used in the analysis were: age (5-year age groups); area of residence (urban or rural); assets index (used as a proxy for socioeconomic status); quar-tiles of education level (based on years of schooling); and self-reported current smoking (yes/no).
The variables assets index and education level were divided into quartiles separately for both rural and urban areas. The assets index, including owing a television, and therefore the frequency of television viewing, varies by area of residence. Moreover, it has been reported that the prevalence of obesity in Peru varies by area (urban or rural) and socioeconomic status.20
For statistical analysis we used Stata version 11 (StataCorp LP, College Station, TX, U.S.). Weighted estimates were obtained taking into account the complex design of the DHS 2008. Thus, both descrip-tive analyses, and univariate and multivariate models
were performed using the svy command for complex
sample designs.
Proportions were compared using the chi-square test. We used logistic regression analysis to assess the asso-ciation between frequency of television viewing and obesity and overweight, using those with normal BMI (BMI 18.5 - 25 kg/m2)) as a reference group.
We calculated crude (OR) and adjusted odds ratios (aOR) and their related 95% confi dence intervals (95% CI). The variables area of residence and educa-tion level were analyzed as potential effect modifi ers based on a previous fi nding of our research group.20 Variables that showed no signifi cance were assessed as potential confounders.
The study was approved by the Institutional Ethics Committee of the Universidad Peruana Cayetano Heredia (Protocol number: SIDISI 58833, 2011).
RESULTS
reasons: BMI data not available (n = 8,645); pregnancy (n = 1,102); low weight or BMI < 18.5 kg/m2 (n = 439); and foreign language spoken at home (n = 13). A total of 21,712 women were included in the analysis.
The mean age of respondents was 30.6 years old (SD ± 10.1). The overall prevalence of overweight was 34.7% (95%CI 33.8;35.7) while the prevalence of obesity was 14.3% (95%CI 13.6;15.1). The preva-lence of overweight and obesity was 32.2% (95%CI 30.7; 33.8) and 8.5% (95%CI 7.6;9.5) in rural areas and 35.7% (95%CI 34.5;36.8) and 16.5% (95%CI 15.6;17.5) in urban areas, respectively. Table 1 shows the study variables when BMI data was available and when it was not available. Table 2 shows the demo-graphic characteristics of the study population with overweight and obesity.
Of all respondents, 92.1% in urban areas and 41.8% in rural areas reported having a television set at home (p < 0.0001). The highest proportions of obesity were found among women who reported television viewing occasionally and almost every day. The prevalence of obesity was lower in those with lower assets index and higher in those with lower education level (Table 3).
We found an association between frequency of televi-sion viewing and both obesity and overweight (Table 3). The magnitude of this association was more pronounced in the estimates of association with obesity and those who reported greater frequency of television viewing (Table 3).
When we assessed whether the strength of association varied according to area of residence, a stronger associa-tion with obesity was found in urban (OR = 2.2, 95%CI 1.3;3.5) than rural area (OR = 1.6, 95%CI 1.1;2.4). Similar results were found with overweight in urban and rural areas (OR = 1.8; 95%CI 1.2;2.7 and OR = 1.3, 95%CI 1.1;1.7, respectively). However, these associa-tions were attenuated among the category of those who reported occasional habit of watching television.
DISCUSSION
This study conducted in Peru, a transitional country with specific geographical and socioeconomic variations, evidenced a strong association between frequency of television viewing and obesity among Peruvian women aged 15 to 49. This association remained after adjusting for potential confounders such as age, area of residence, education level, assets index and self-reported current smoking. Also, the association between frequency of television viewing and obesity was stronger in women living in urban areas.
Obesity is an increasing public health concern in several developing countries,19 including Peru. An analysis
of DHS 1996 showed 9.4% prevalence of obesity in
Peruvian women.15 Data from the DHS 2008 showed
a 14.3% prevalence of obesity, which is an increase by 52% in obesity rates in Peruvian women. Our study explored the association between frequency of televi-sion viewing and obesity, corroborating fi ndings of studies conducted in developed countries.
Previous studies have shown an association between frequency of television viewing and obesity. Tucker22 reported in the Nurses’ Health Study that women who watched television at least four hours a day were twice
Table 1. Characteristics of respondents according to the availability of body mass index data. Peru, 2008.
Variable BMI data
BMI data not
available p-valuea
% %
Frequency of
television viewing n = 23,264 n = 7,940
Never 8.9 6.6
Occasionally 30.6 27.0 < 0.005
Almost every day 60.5 66.4
Assets index n = 23,252 n=8,199
0.66 1st (lowest) 19.3 21.0
2nd 23.0 22.0
3rd 26.2 26.2
4th (highest) 31.5 30.9 Education level n = 23,252 n = 7,930
0.91 1st (lowest) 28.6 27.9
2nd 35.1 34.8
3rd 19.6 20.1
4th (highest) 16.7 17.2 Age (years) n = 23,252 n = 7,930
0.14
15-19 19.0 18.3
20-24 15.2 15.2
25-29 15.2 13.7
30-34 14.4 14.9
35-39 13.4 13.2
40-44 12.1 13.5
45-49 10.8 11.1
Self-reported
current smoking n = 22,164 n = 7,931
0.53
No 92.4 91.9
Yes 7.6 8.1
Area of residence n = 23,252 n = 8,635
Urban 72.3 74.8 0.34
Rural 27.7 25.2
aDifferences in proportions were determined by the Chi-square test.
as likely to be obese compared with those who did it less than an hour a day. In a prospective study, Hu et al9 found that television viewing was independently associated with obesity and type 2 diabetes mellitus. This same study found a trend of obesity increasing proportionally to time (number of hours) spent watching television.9 Bowman2 reported that television viewing for more than two hours a day was associated with increased BMI in both men and women. It should be noted that these data come from observational studies in the United States population.
An earlier study carried out in six cities in Peru reported a positive relationship between television viewing of four hours or more and BMI ≥ 25 kg/m2 (overweight) in women.11 Other countries undergoing
epidemiological transition, like Brazil,6 have reported an association between frequency of television viewing and overweight or obesity in women but not in men. Not all studies have found a positive association between obesity and frequency of televi-sion viewing. A cross-sectional study conducted in the Iranian population did not fi nd any relationship between BMI and time spent (minutes per week) watching television.21 This type of evidence presents a challenge and points to the need to explore these associations in specifi c contexts, hence justifying the importance of conducting the present study.
The mechanism by which television viewing is associ-ated with obesity is not yet clearly established. It might be due to lack of physical activity,9 and unhealthy
Table 2. Characteristics of the study population according to nutritional status. Peru, 2008.
Variables
Populationa Normal weight Overweight Obesity
p-valueb
n % % % %
n = 21,712 n = 11,113 n =7,503 n = 3,096
Frequency of television viewing < 0.0001
Never 2,186 8.7 61.1 31.6 7.3
Occasionally 7,465 30.5 56.3 32.2 11.5
Almost every day 12,059 60.8 46.8 36.4 16.8
Assets index < 0.0001
1st (lowest) 5,428 20.0 55.8 33.2 11.0
2nd 5,431 22.9 49.1 35.9 15.0
3rd 5,426 26.1 50.5 34.4 15.1
4th (highest) 5,427 31.0 49.6 35.1 15.3
Education level < 0.0001
1st (lowest) 6,625 28.8 42.8 37.1 20.1
2nd 7,266 34.8 52.8 34.7 12.5
3rd 4,028 19.6 55.8 33.2 11.0
4th (highest) 3,793 16.8 55.4 32.6 12.0
Age (years) < 0.0001
15-19 4,043 18.4 78.6 18.9 2.5
20-24 3,239 14.8 65.6 29.1 5.3
25-29 3,204 15.1 54.0 35.2 10.8
30-34 3,113 14.2 44.5 40.6 14.9
35-39 3,014 13.7 36.5 42.4 21.1
40-44 2,732 12.5 30.8 42.8 26.4
45-49 2,367 11.3 30.9 41.5 27.6
Self-reported current smoking 0.83
No 20,481 92.3 50.9 34.8 14.3
Yes 1,231 7.7 51.7 33.6 14.7
Area of residence < 0.0001
Urban 14,120 72.6 47.8 35.7 16.5
Rural 7,592 27.4 59.3 32.2 8.5
eating (consumption of high sugar-sweetened bever-ages and processed foods) while watching television,5 or the effect that television commercials might have on people’s behavior patterns with increased consumption of high-energy foods and consequent weight gain.14 In addition, these effects may vary depending on exposure time and content of television programs. Longitudinal studies have found that television viewing during child-hood and adolescence for long periods of time may have an impact on BMI in adulthood.24 On the other hand, a recent study reported that changes in television viewing time in adults are independently associated with long-term weight gain.18
One of the strengths of this population-based study is that the fi nal sample comprised more than 20,000 women nationwide including urban and rural areas, which could provide information to better understand how indirect factors affect physical activity among Peruvian women. However, our study has certain limi-tations. First, information about BMI was not available in 27% of respondents, which could potentially bias the results of our study. The DHS 2008 comprises a group of surveys conducted from 2004 to 2008 in a nationally representative sample. However, anthropo-metric measurements were carried out only in 2005, 2007 and 2008, thus explaining missing data on the outcome variable. Although measures were not taken in all waves of this survey, the women sample with available anthropometric data was nationally represen-tative. A comparison of characteristics of respondents with and without BMI data available showed no differ-ences except for the variable assessing frequency of television viewing. However, our study showed results that are consistent with those from other studies.2,9,11
A second limitation of this study is that information on frequency of television viewing analyzed in the DHS survey comes from self-reports and is collected as categories, whereas it would have been more objec-tive to collect information on the number of hours that women spent exclusively watching television. Another limitation is the cross-sectional design that does not allow making any inferences on a causal relationship between the variables of interest. Other studies with prospective designs have shown a causal effect of tele-vision viewing on obesity in adults.12 Finally, because the DHS usually does not assess cardiovascular risk factors, we could not explore other variables associated with obesity such as dietary patterns,5 calorie intake by frequency of television viewing,2 alcohol consumption,3 and levels of physical activity,16 among others.
In conclusion, this study showed a strong association between frequency of television viewing and over-weight and obesity among Peruvian women, espe-cially in those of urban areas. Findings of the present study are relevant in assessing the effect of television viewing, and indirectly assessing the sedentary lifestyle, on obesity in the Peruvian context. We found strong evidence of an association that varies according to area of residence, which could impact future interven-tion strategies. Further studies are needed to explore the effects of television viewing in males, to better understand the mechanisms associating this sedentary activity with increased risk of obesity, and to suggest adequate strategies that can reduce obesity and physical inactivity in the Peruvian population.
Table 3. Crude and adjusted models of the association between frequency of television viewing and obesity/overweight. Peru, 2008.
Frequency of television viewing
Obesity Overweight
Crude Adjusteda Crude Adjusteda
n = 14,209 n = 14,207 n = 18,614 n = 18,611
OR 95%CI OR 95%CI OR 95%CI OR 95%CI
Never 1 1 1 1
Occasionally 1.7 1.3;2.2 1.7 1.3;2.3 1.1 1.0;1.3 1.2 1.1;1.4
Almost every day 3.0 2.3;3.8 2.6 2.0;3.5 1.5 1.3;1.7 1.6 1.4;1.9
aModel adjusted for age, area of residence, quartiles of education level, assets index and self-reported current smoking. All estimates were calculated using logistic regression for complex sample designs.
1. Overweight, obesity, and health risk. National Task Force on the Prevention and Treatment of Obesity. Arch Intern Med. 2000;160(7):898-904.
2. Bowman SA. Television-viewing characteristics of adults: correlations to eating practices and overweight and health status. Prev Chronic Dis. 2006;3(2):A38.
3. Breslow RA, Smothers BA. Drinking patterns and body mass index in never smokers: National Health Interview Survey, 1997-2001. Am J Epidemiol. 2005;161(4):368-76. DOI:10.1093/aje/kwi061
Study funded by the National Heart, Lung and Blood Institute (NHLBI), National Institutes of Health, Department of Health and Human Services, US, USA (Protocol HHSN268200900033C).
The authors declare no confl icts of interest. the risk of metabolic syndrome in a community-based population. BMC Public Health. 2008;8:193. DOI:10.1186/1471-2458-8-193
5. Cleland VJ, Schmidt MD, Dwyer T, Venn AJ. Television viewing and abdominal obesity in young adults: is the association mediated by food and beverage consumption during viewing time or reduced leisure-time physical activity? Am J Clin Nutr. 2008;87(5):1148-55.
6. Fernandes RA, Christofaro DG, Casonato J,
Costa Rosa CS, Costa FF, Freitas Junior IF, et al. Leisure time behaviors: prevalence, correlates and associations with overweight in Brazilian adults. A
cross-sectional analysis. Rev Med Chil. 2010;138(1):29-35. DOI:10.4067/S0034-98872010000100004
7. Gomez LF, Parra DC, Lobelo F, Samper B, Moreno J, Jacoby E, et al. Television viewing and its association with overweight in Colombian children: results from the 2005 National Nutrition Survey: a cross sectional study. Int J Behav Nutr Phys Act. 2007;4:41. DOI:10.1186/1479-5868-4-41
8. Hancox RJ, Milne BJ, Poulton R. Association between child and adolescent television viewing and adult health: a longitudinal birth cohort study. Lancet. 2004;364(9430):257-62. DOI:10.1016/S0140-6736(04)16675-0
9. Hu FB, Li TY, Colditz GA, Willett WC, Manson JE. Television watching and other sedentary behaviors in relation to risk of obesity and type 2 diabetes mellitus in women. JAMA. 2003;289(14):1785-91. DOI:10.1001/jama.289.14.1785
10. Huicho L, Trelles M, Gonzales F, Mendoza W, Miranda J. Mortality profi les in a country facing epidemiological transition: an analysis of registered data. BMC Public Health. 2009;9:47. DOI:10.1186/1471-2458-9-47
11. Jacoby E, Goldstein J, López A, Núñez E, López T. Social class, family, and life-style factors associated with overweight and obesity among adults in Peruvian cities. Prev Med. 2003;37(5):396-405. DOI:10.1016/S0091-7435(03)00159-2
12. Jakes RW, Day NE, Khaw KT, Luben R, Oakes S, Welch A, et al. Television viewing and low participation in vigorous recreation are independently associated with obesity and markers of cardiovascular disease risk: EPIC-Norfolk population-based study. Eur J Clin Nutr. 2003;57(9):1089-96. DOI:10.1038/sj.ejcn.1601648
13. Klein S, Burke LE, Bray GA, Blair S, Allison DB, Pi-Sunyer X, et al. Clinical implications of obesity with specifi c focus on cardiovascular disease: a statement for professionals from the American Heart Association Council on Nutrition, Physical Activity, and Metabolism: endorsed by the American College of Cardiology Foundation. Circulation. 2004;110(18):2952-67. DOI:10.1161/01.CIR.0000145546.97738.1E
14. Martin CK, Coulon SM, Markward N, Greenway FL, Anton SD. Association between energy intake and viewing television, distractibility, and memory for advertisements. Am J Clin Nutr. 2009;89(1):37-44. DOI:10.3945/ajcn.2008.26310
15. Martorell R, Khan LK, Hughes ML, Grummer-Strawn LM. Obesity in Latin American women and children. J Nutr. 1998;128(9):1464-73.
16. Masterson Creber RM, Smeeth L, Gilman RH, Miranda JJ. Physical activity and cardiovascular risk factors among rural and urban groups and rural-to-urban migrants in Peru: a cross-sectional study. Rev Panam Salud Publica. 2010;28(1):1-8. DOI:10.1590/S1020-49892010000700001
17. Mispireta ML, Rosas AM, Velazquez JE, Lescano AG, Lanata CF. Transición Nutricional en Perú, 1991-2005. Rev Peru Med Exp Salud Publica. 2007;24(2):129-35.
18. Mozaffarian D, Hao T, Rimm EB, Willett WC, Hu FB. Changes in diet and lifestyle and long-term weight gain in women and men. N Engl J Med. 2011;364(25):2392-404. DOI:10.1056/NEJMoa1014296
19. Popkin BM. The nutrition transition: an overview of world patterns of change. Nutr Rev. 2004;62(7 Pt 2):S140-3. DOI:10.1111/j.1753-4887.2004.tb00084.x
20. Poterico JA, Stanojevic S, Ruiz-Grosso P, Bernabe-Ortiz A, Miranda JJ. The Association Between Socioeconomic Status and Obesity in Peruvian Women. Obesity (Silver Spring). 2011 Sep 29.
21. Saidie M, Rabiei K, Kelishadi R, Sadeghi M. The Association of Leisure Time Physical Activity, Watching Television, Obesity & Lipid Profi le in an Iranian Population. Pak J Med Sci. 2005;21(4):476-81.
22. Tucker LA, Bagwell M. Television viewing and obesity in adult females. Am J Public Health. 1991;81(7):908-11. DOI:10.2105/AJPH.81.7.908
23. Vereecken CA, Todd J, Roberts C, Mulvihill C, Maes L. Television viewing behaviour and associations with food habits in different countries. Public Health Nutr. 2006;9(2):244-50. DOI:10.1079/PHN2005847
24. Viner RM, Cole TJ. Television viewing in early childhood predicts adult body mass Index. J Pediatr. 2005;147(4):429-35. DOI:10.1016/j.jpeds.2005.05.005