5 0 2 5 0 25 0 2 5 0 2
5 0 2 Rev Saúde Pública 2001;35(6):502-7
www.fsp.usp.br/rsp
Nutritional status of pregnant women:
prevalence and associated pregnancy outcomes
Estado nutricional de gestantes: prevalência e
desfechos associados à gravidez
Luciana Bertoldi Nuccia, Maria Inês Schmidta, Bruce Bartholow Duncana, Sandra Costa
Fuchsa, Eni Teresinha Fleckb and Maria Margarida Santos Brittoc
aDepartamento de Medicina Social da Faculdade de Medicina da Universidade Federal do Rio
Grande do Sul. Porto Alegre, RS, Brasil. bCentro de Ciências da Saúde da Universidade de Fortaleza.
Fortaleza, CE, Brasil. CFaculdade de Medicina da Universidade Federal da Bahia. Salvador, BA, Brasil
Correspondence to:
Luciana Bertoldi Nucci Rua da Granja Julieta, 9/34 04721-060 São Paulo, SP, Brasil E-mail: [email protected]
Partial supported by “Ministério da Saúde”; “Programa de Apoio a Núcleos de Excelência” (PRONEX, Process nº 661041/1998-4); “Conselho Nacional de Desenvolvimento Científico e Tecnológico” (CNPq, Process nº 520368/95-9); “Fundação de Apoio à Pesquisa do Rio Grande do Sul” (FAPERGS); ; Organização Pan-Americana da Saúde (OPAS); Fundo de Incentivo à Pesquisa (FIPE, Process nº 97217 do Hospital de Clínicas de Porto Alegre, and Bristol-Myers Squibb Foundation.
Submitted on 5/4/2001. Reviewed on 29/8/2001. Approved on 27/9/2001.
Keywords
Obesity.# Pregnancy complications.#
Body mass index.# Nutritional status.#
Prevalence. Prenatal care. Risk factors. Brazil.
Descritores
Obesidade.# Complicações na
gravidez.# Índice de massa corporal.#
Estado nutricional.# Prevalência.
Cuidado pré-natal. Fatores de risco. Brasil.
Abstract
Introduction
Although obesity is well recognized as a current public health problem, its prevalence and impact among pregnant women have been less investigated in Brazil. The objective of the study was to evaluate the impact of pre-obesity and obesity among pregnant women, describing its prevalence and risk factors, and their association with adverse pregnancy outcomes.
Methods
A cohort of 5,564 pregnant women, aged 20 years or more, enrolled at aproximately 20 to 28 weeks of pregnancy, seen in prenatal public clinics of six state capitals in Brazil were followed up, between 1991 and 1995. Prepregnancy weight, age, educational level and parity were obtained from a standard questionnaire. Height was measured in duplicate and the interviewer assigned the skin color. Nutritional status was defined using body mass index (BMI), according to World Health Organization (WHO) criteria. Odds ratios and 95% confidence interval were calculated using logistic regression.
Results
Age-adjusted prevalences (and 95% CI) based on prepregnancy weight were: underweight 5.7% (5.1%-6.3%), overweight 19.2% (18.1%-20.3%), and obesity 5.5% (4.9%-6.2%). Obesity was more frequently observed in older black women, with a lower educational level and multiparous. Obese women had higher frequencies of gestational diabetes, macrosomia, hypertensive disorders, and lower risk of microsomia.
Conclusions
Overweight nutritional status (obesity and pre-obesity) was seen in 25% of adult pregnant women and it was associated with increased risk for several adverse pregnancy outcomes, such as gestational diabetes and pre-eclampsia.
Resumo
Introdução
5 0 3 5 0 3 5 0 3 5 0 3 5 0 3 Rev Saúde Pública 2001;35(6):502-7
www.fsp.usp.br/rsp
Nutritional status of pregnant women Nucci LB et al.
Métodos
Uma coorte de 5.564 gestantes, com idade maior ou igual a 20 anos, com 20 a 28 semanas de gestação, atendidas em serviços de pré-natal geral do Sistema Único de Saúde em seis capitais brasileiras, foram seguidas entre 1991 e 1995. Medidas de peso pré-gravídico, idade, escolaridade e paridade foram obtidas mediante entrevistas utilizando-se questionário padronizado. A altura foi medida em duplicata, e a cor da pele, descrita pelo entrevistador. O estado nutricional foi estabelecido a partir do índice de massa corporal (IMC), utilizando-se os critérios da Organização Mundial da Saúde. Razão de chances e intervalo de confiança de 95% foram calculados por meio de regressão logística.
Resultados
As prevalências (IC95%) ajustadas para idade foram: magreza (IMC<18,5 kg/m2),
5,7% (5,1%-6,3%); pré-obesidade (25<IMC<30 kg/m2), 19,2% (18,1%-20,3%); e
obesidade (30<IMC kg/m2), 5,5% (4,9%-6,2%). A obesidade foi mais freqüente em
mulheres mais velhas, negras, com menor grau de escolaridade e multíparas. Mulheres obesas apresentaram risco maior para diabetes gestacional, macrossomia, distúrbios hipertensivos, e menor risco para microssomia.
Conclusões
Sobrepeso (pré-obesidade ou obesidade) ocorreu em 25% das gestantes adultas estudadas e associou-se a vários riscos de complicações de gravidez, como diabetes gestacional e pré-eclampsia.
INTRODUCTION
According to the World Health Organization (WHO), the increased frequency of obesity in many countries can be characterized as a pandemia of ma-jor public health concern.13 Maternal nutritional sta-tus is an important determinant of pregnancy out-comes since prepregnancy underweight has been tra-ditionally considered a risk factor for adverse gesta-tion outcomes.3 Obesity also increases pregnancy complications, such as gestational diabetes, hyper-tensive disorders, and perinatal morbimortality.12
Brazil is a heterogeneous country regarding its population characteristics, and health problems of pre-obesity and pre-obesity coexist with undernutrition. Re-cent trend analyses of nutritional status have placed the problem of obesity squarely on the Brazilian pub-lic health agenda.8
The objective of the present study was to assess prepregnancy nutritional status among women seen in prenatal clinics of the Brazilian national health sys-tem, its population correlates and its associated ad-verse pregnancy outcomes.
METHODS
The study was conducted in prenatal care clinics of the national health system (Sistema Único de Saúde – SUS) of six state capitals in Brazil, between 1991 and 1995. A cohort of 5,564 consecutive women aged 20 years and more, otherwise non-diabetic, were followed from about weeks 20-28 of gestationtill delivery.
Ana-lysis was carried out for 5,314 women, as in 250 there was a lack of information required to calculate pre-pregnancy body mass index (BMI).
At enrollment, a standardized questionnaire pro-vided information on age, prepregnancy weight (in kilograms), years of education, and parity. Maternal height was measured in duplicate and recorded in centimeters according to the standard protocol. Skin color was subjectively assigned. Prepregnancy nutri-tional status was classified based on BMI, according to the World Health Organization (WHO) criteria: un-derweight (BMI<18.5 kg/m2), normoweight (18.5 kg/ m2≤ BMI <25 kg/m2), pre-obesity (25 kg/m2 ≤ BMI< 30 kg/m2), and obesity (BMI≥30 kg/m2). Women who fall in the latter two categories were also character-ized as overweight.13
disor-5 0 4 5 0 45 0 4 5 0 4
5 0 4 Rev Saúde Pública 2001;35(6):502-7
www.fsp.usp.br/rsp
Nutritional status of pregnant women Nucci LB et al.
ders were ascertained through chart review and classi-fied according to the National High Blood Pressure Education Program Working Group. Pre-eclampsia (hy-pertension after week 20 of gestation associated with proteinuria or seizures) included only cases of new on-set hypertension.
Frequencies of underweight, pre-obesity and obesi-ty – and their 95% confidence intervals –, both crude and adjusted, are displayed, the latter obtained through logistic regression.11,15 Odds ratios for preg-nancy outcomes were also calculated using logistic regression. Statistical analyses were performed using the statistical software SAS.
The Ethical Committees of the Institutions ap-proved the study protocol, and participants signed the study consent.
RESULTS
Table 1 shows the distribution of characteristics of
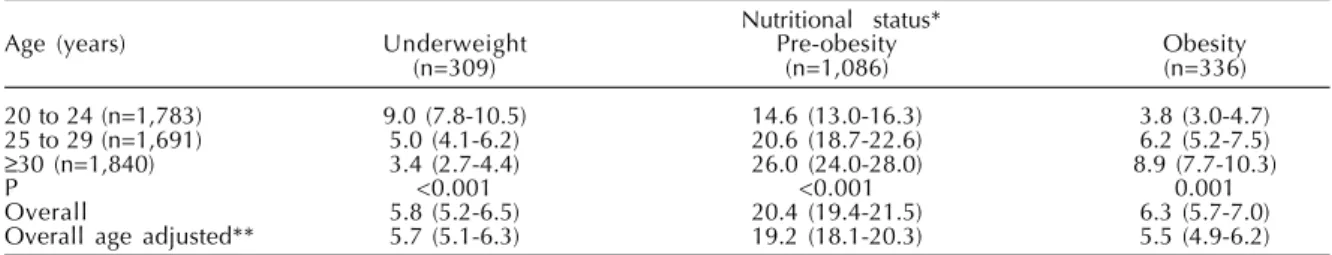
Table 2 - Frequency (95%CI) of prepregnancy World Health Organization nutritional status* categories among 5,314 women aged 20 to 48, 1990 to 1994.
Nutritional status*
Age (years) Underweight Pre-obesity Obesity
(n=309) (n=1,086) (n=336)
20 to 24 (n=1,783) 9.0 (7.8-10.5) 14.6 (13.0-16.3) 3.8 (3.0-4.7)
25 to 29 (n=1,691) 5.0 (4.1-6.2) 20.6 (18.7-22.6) 6.2 (5.2-7.5)
≥30 (n=1,840) 3.4 (2.7-4.4) 26.0 (24.0-28.0) 8.9 (7.7-10.3)
P <0.001 <0.001 0.001
Overall 5.8 (5.2-6.5) 20.4 (19.4-21.5) 6.3 (5.7-7.0)
Overall age adjusted** 5.7 (5.1-6.3) 19.2 (18.1-20.3) 5.5 (4.9-6.2)
*BMI cut points according to WHO13: underweight (BMI<18.5 kg/m2), pre-obesity (25.0 kg/m2
≤BMI<30 kg/m2) and obesity (BMI≥30.0 kg/m2)
**Adjusted to represent frequencies for 27 year old women
5,314 women included in the analysis and of those excluded due to missing information. Inability to cal-culate prepregnancy BMI was more frequently seen among multiparous women with lower educational level and miscellaneous skin color in the Salvador center.
Age specific prevalences of prepregnancy nutritional status are presented in Table 2. Prevalences of under-weight decreased in the age groups from 9% for women aged 20 to 24 years to 3.4% for those 30 years and more. In contrast, for pre-obesity and obesity, prevalences increased with age. Overall age-adjusted prevalences (95% CI) based on prepregnancy weight were: under-weight 5.7% (5.1%-6.3%), pre-obesity 19.2% (18.1%– 20.3%), and obesity 5.5% (4.9%-6.2%) (p<0.001).
Table 3 describes age-adjusted prevalences (95% CI) of prepregnancy nutritional status, according to study center, educational level, skin color, and parity. Although the Salvador center had the highest preva-lence of underweight, the obesity prevapreva-lence in this
Table1 - Characteristics of studied and excluded pregnant women aged 20 to 48, 1990 to 1994.
Characteristics Studied sample* Women with missing BMI* P value
(n=5,314) (n=250)
N % N %
Age
20 to 24 1,783 33.6 83 33.2
25 to 29 1,691 31.8 78 31.2
≥30 1,840 34.6 89 35.6 0.9
Education
<8 years 2,303 43.4 180 72.0
8-11 years 2,480 46.8 67 26.8
≥12 years 518 9.8 3 1.2 <0.001
Skin color
White 2,391 45.2 51 20.7
Mixed 2,188 41.4 45 61.1
Black 710 13.4 151 18.2 <0.001
Parity
0 1,449 30.6 39 16.5
1 1,589 33.6 59 24.9
2 904 19.1 50 21.1
≥3 788 16.7 89 37.6 <0.001
Study center
Porto Alegre 1,072 20.2 38 15.2
São Paulo 1,232 23.2 4 1.6
Rio de Janeiro 549 10.3 8 3.2
Salvador 881 16.6 104 41.6
Fortaleza 1,122 21.1 51 20.4
Manaus 458 8.6 45 18.0 <0.001
5 0 5 5 0 5 5 0 5 5 0 5 5 0 5 Rev Saúde Pública 2001;35(6):502-7
www.fsp.usp.br/rsp
Nutritional status of pregnant women Nucci LB et al.
Table 3 - Age adjusted* prevalence (95%CI) of prepregnancy World Health Organization nutritional status** among 5,314 women aged 20 to 48, by study center, years of education, skin color and parity, 1990 to 1994.
Characteristics Nutritional status**
Underweight Pre-obesity Obesity
% (95%CI) % (95%CI) % (95%CI)
Center of study
Porto Alegre (n=1,059) 3.7 (2.7-5.1) 23.5 (21.0-26.3) 8.6 (7.0-10.6)
São Paulo (n=1,221) 4.7 (3.6-6.1) 22.5 (20.2-25.1) 5.3 (4.1-6.7)
Rio de Janeiro (n=536) 5.8 (4.0-8.4) 25.2 (21.6-29.1) 8.5 (6.4-11.2)
Salvador (n=877) 9.2 (7.4-11.3) 16.5 (14.1-19.2) 7.4 (5.8-9.5)
Fortaleza (n=1,108) 6.9 (5.5-8.5) 16.7 (14.5-19.1) 4.1 (3.1-5.5)
Manaus (n=447) 4.6 (3.1-6.9) 18.7 (15.2-22.8) 4.5 (2.8-7.2)
P <0.001 <0.001 <0.001
Years of education
<8 (n=2,271) 6.1 (5.1-7.1) 21.3 (19.6-23.2) 7.1 (6.0-8.3)
8-11 (n=1,134) 5.9 (5.0-6.9) 20.1 (18.5-21.8) 6.0 (5.0-7.0)
≥11 (n=1,829) 4.2 (2.7-6.6) 18.8 (15.6-22.4) 4.2 (2.8-6.2)
P 0.33 0.33 0.03
Skin color
White (n=2,355) 5.3 (4.4-6.3) 20.7 (19.0-22.4) 5.5 (4.6-6.5)
Mixed (n=2,164) 6.6 (5.6-7.7) 19.4 (17.8-21.2) 6.6 (5.6-7.8)
Black (n=705) 5.5 (4.0-7.5) 22.4 (19.4-25.7) 8.4 (6.5-10.8)
P 0.16 0.23 0.01
Parity
0 (n=1,433) 6.8 (5.6-8.2) 16.6 (14.7-18.8) 5.2 (4.0-6.6)
1 (n=1,572) 5.1 (4.1-6.3) 22.1 (20.1-24.3) 6.9 (5.7-8.4)
2 (n=887) 5.0 (3.7-6.8) 24.5 (21.7-27.6) 5.8 (4.4-7.6)
≥3 (n=779) 6.3 (4.6-8.7) 21.1 (18.2-24.3) 9.4 (7.4-11.9)
P 0.15 <0.001 0.002
*Adjusted to represent frequencies for 27 year old women
**BMI cut points according to WHO13: underweight (BMI<18.5 kg/m2), pre-obesity (25.0 kg/m2
≤BMI<30 kg/m2) and obesity (BMI≥30.0 kg/m2)
Table 4 - Odds ratio (95%CI) for pregnancy outcomes according to nutritional status* among 5,314 women aged 20 to 48, 1990 to 1994.
Pregnancy outcomes Nutritional status
Underweight Pre-obesity Obesity
OR (95%CI) OR (95%CI) OR (95%CI)
GDM 0.40 (0.19-0.85) 1.98 (1.56-2.53) 2.36 (1.65-3.39)
Microsomia 2.03 (1.42-2.90) 0.65 (0.48-0.88) 0.47 (0.26-0.84)
Macrosomia 0.56 (0.33-0.95) 1.61 (1.30-2.00) 1.53 (1.08-2.17)
Hypertensive disorders 0.72 (0.42-1.23) 2.46 (1.99-3.04) 6.60 (5.06-8.60)
Pre-eclampsia 0.70 (0.25-1.93) 1.26 (0.79-2.00) 3.92 (2.40-6.38)
*BMI cut points according to WHO13: underweight (BMI<18.5 kg/m2), pre-obesity (25.0 kg/m2
≤BMI<30 kg/m2) and obesity (BMI≥30.0 kg/m2); reference group is those with normal BMI (18.5 kg/m2
≤BMI<25 kg/m2). GDM - Gestational diabetes mellitus
center was also high. Overweight was more frequent in study centers in the more industrialized south and southeast regions (Porto Alegre, São Paulo, and Rio de Janeiro) (p<0.001). Porto Alegre and Rio de Ja-neiro showed the highest adjusted frequencies for obesity. Educational level was inversely related to nutritional status, obesity being more prevalent a-mong less educated women (p=0.03). Overweight was commonly seen among black women, and obesity was more prevalent in black than in white or miscel-laneous skin color women (p=0.01). Nulliparous wo-men presented a different nutritional status distribu-tion than multiparous ones, the age-adjusted preva-lence of underweight was higher and pre-obesity and obesity was lower than among parous women. Those having three or more previous pregnancies had higher age-adjusted prevalence of obesity (p=0.002).
Table 4 demonstrates an inverse association of nutri-tional status and microsomia. Pre-obese and obese women had lower risk of microsomia (OR=0.65, 95%
CI 0.48-0.88, and OR=0.47, 95% CI 0.260-0.84, re-spectively). On the other hand, they showed a higher risk of having gestational diabetes mellitus (OR=2.0, 95% CI 1.60-2.5 and OR=2.4, CI 95% 1.7-3.4), macro-somia (OR=1.6, 95% CI 1.3-2.0 and OR=1.5, CI 95% 1.1-2.2), and hypertensive disorders (OR=2.5, 95% CI 2.0-3.0 and OR=6.6, 95% CI 5.0-8.6), than women with normal nutritional status. Obesity was also a risk factor for pre-eclampsia (OR=3.9, 95% CI 2.4-6.4).
DISCUSSION
sig-5 0 6 5 0 65 0 6 5 0 6
5 0 6 Rev Saúde Pública 2001;35(6):502-7
www.fsp.usp.br/rsp
Nutritional status of pregnant women Nucci LB et al.
nificant overweight prevalences were present in all categories studied. These data are of a major impor-tance given the increased risk of adverse outcomes among overweight here demonstrated.
The study findings are consistent with recent popu-lation-based surveys of nutritional status in Brazil. Monteiro et al7 reported an obesity prevalence of 13.3% in a probability sample of Brazilian women aged 25-64 years8 conducted in 1989. While not all women in these population surveys have equal probability of becoming pregnant, it is important to add to these data from clinical samples in order to obtain a more com-plete picture of the significance of these recent changes in nutritional status to current obstetric practice.
The study data illustrate important risks at both extremes of the nutritional status spectrum, as both under and overweight at the beginning of gestation are associated with adverse pregnancy outcomes, sistent with other authors’ findings in different con-texts. While underweight women presented a higher frequency of microsomia,6 overweight was related to macrosomia and other disease conditions, such as gestational diabetes mellitus and hypertensive disor-ders.6,12 As being overweight is commonly seen and confers risk not only to the mother but also to the neonate, the study findings, along with the literature, call for greater attention to the prevention and man-agement of obesity in childbearing age women, both prior to and during pregnancy.
The dilemma of weight control strategies for over-weight pregnant women should be stressed. Although a lesser weight gain during pregnancy might be desir-able for overweight women, insufficient weight gain is associated with an increased risk of microsomia,6 per se a risk for several undesirable outcomes, both immediate and chronic.1 Thus, international limits for adequate weight gain have been set for specific nutri-tional categories, from lean to obese. It was previ-ously reported here that only ¼ of the overweight women studied gained weight within these recom-mended limits.9
There are some limitations in the interpretation of these results. As the study was conducted in selected clinics of the national health system of six capitals, rep-resentativeness cannot be assured. However, compari-sons of data on educational level, nutritional status and gestational age at delivery5 suggest that the study sample characteristics are comparable with those of pregnant women living in large metropolitan areas of Brazil. In this regard, the data are also less likely to be representative of those women seen outside of the na-tional health system. An addina-tional limitation is that prepregnancy weight was reported and not objectively measured, and thus subject to recall bias. However, based on previous findings concerning weight recall for Brazilian women studied outside of pregnancy10 and other studies about referred weight,2 it seems that weight measure bias is probably small.
As a conclusion, overweight nutritional status is highly prevalent among women seen in prenatal pub-lic clinics of major Brazilian cities, even for the age range of 20–24 years. Approximately 25% of women are overweight at conception. Older black multiparous women with lower educational level and living in the southern or southeastern regions are more likely to be overweight at the onset of pregnancy. Maternal over-weight status is associated with adverse pregnancy outcomes. Greater awareness of these facts are key for minimizing the risks of obesity for pregnant women and their offspring.
ACKNOWLEDGEMENTS
To the following people for the study regional coordi-nation in the centers: AJ Reichelt of Santa Casa de Misericórdia and Hospital de Clínicas de Porto Alegre; JMD Pousada of Instituto de Perinatologia da Bahia (IPERBA); T Yamashita of Hospital do Servidor Público Estadual “Francisco Morato de Oliveira”, São Paulo); ERS Spichler of Instituto Fernandes Figueira. Fundação Oswaldo Cruz, Rio de Janeiro; MM Teixeira of Serviço de Obstetrícia do Posto de Assistência Médica da Cadajás, Manaus; A Costa e Forti of Maternidade Escola Assis Chateaubriand da Universidade do Ceará, Fortaleza.
REFERENCES
1. Barker D. Mothers, babies and health in later life. 2nd ed. Edinburgh: Churchill Livingstone; 1998.
2. Chor D, Coutinho E, Laurenti R. Reliability of self-reported weight and height among state bank employees. Rev Saúde Pública 1999;33:16-23.
3. Cnattingius S, Bergstrom R, Lipworth L, Kramer MS. Prepregnancy weight and the risk of adverse pregnancy outcomes. N Engl J Med 1998;338:147-52.
4. Faquim L. Planos de saúde: os dois lados da regula-mentação. RH em síntese [serial online] 1999;27:6-15. Disponível em: http://www.gestaoerh.com.br/ artigos/legi_010.shtml [2000 ago 12]
5. Fundação IBGE. DATASUS [online] 1996. Disponível em: http://www.datasus.gov.br/tabnet/tabnet.htm [2000 ago 5]
5 0 7 5 0 7 5 0 7 5 0 7 5 0 7 Rev Saúde Pública 2001;35(6):502-7
www.fsp.usp.br/rsp
Nutritional status of pregnant women Nucci LB et al.
7. Monteiro CA, Mondini L, Medeiros de Souza AL, Popkin BM. The nutritional transition in Brazil. Eur J Clin Nutr 1995;49:105-13.
8. Monteiro CA, D’A Benicio MH, Conde WL, Popkin BM. Shifting obesity trends in Brazil. Eur J Clin Nutr
2000;54:342-6.
9. Nucci L, Duncan BB, Mengue S, Branchtein L, Schmidt MI, Fleck E. Assessment of weight gain during pregnancy in general prenatal care services of Brazil. Cad Saúde Pública, 2001;17(6). In press.
10. Schmidt MI, Duncan BB, Tavares M, Polanczyk CA, Pellanda L, Zimmer PM. Validity of self-reported weight: a study of urban Brazilian adults. Rev Saúde Pública 1993;27:271-6.
11. Wilcosky TC, Chambless LE. A comparison of direct adjustment and regression adjustment of epidemiologic measures. J Chronic Dis 1985;38:849-56.
12. Wolfe H. High prepregnancy body-mass index: a maternal-fetal risk factor. N Engl J Med
1998;338:191-2.
13. World Health Organization. WHO Consultation on Obesity. Obesity: preventing and managing the global epidemic. Geneva; 1998.
14. World Health Organization. WHO Study Group on Diabetes Mellitus. Prevention of Diabetes Mellitus: report of a WHO Study Group. Geneva;1994. [WHO Technical Report Series, 844].
15. Zhao PY. Logistic regression adjustment of proportion and its macro procedure.In: Proceedings of the Twenty-Second Annual SAS Users Group