Classi
fi
cation of different degrees of adiposity
in sedentary rats
A.S. Leopoldo
1, A.P. Lima-Leopoldo
1, A.F. Nascimento
2, R.A.M. Luvizotto
2, M.M. Sugizaki
2,
D.H.S. Campos
3, D.C.T. da Silva
3, C.R. Padovani
4and A.C. Cicogna
31Departamento de Desportos, Centro de Educac
¸ão Física e Esportes, Universidade Federal do Espírito Santo, Vitória, ES, Brasil
2Instituto de Ciências da Saúde, Universidade Federal do Mato Grosso, Sinop, MT, Brasil 3Departamento de Clínica Médica, Faculdade de Medicina, Universidade Estadual Paulista, Botucatu, SP, Brasil 4Departamento de Bioestatística, Instituto de Biociências, Universidade Estadual Paulista, Botucatu, SP, Brasil
Abstract
In experimental studies, several parameters, such as body weight, body mass index, adiposity index, and dual-energy X-ray absorptiometry, have commonly been used to demonstrate increased adiposity and investigate the mechanisms underlying obesity and sedentary lifestyles. However, these investigations have not classified the degree of adiposity nor defined adiposity categories for rats, such as normal, overweight, and obese. The aim of the study was to characterize the degree of adiposity in rats fed a high-fat diet using cluster analysis and to create adiposity intervals in an experimental model of obesity. Thirty-day-old male Wistar rats were fed a normal (n=41) or a high-fat (n=43) diet for 15 weeks. Obesity was defined based on the adiposity index; and the degree of adiposity was evaluated using cluster analysis. Cluster analysis allowed the rats to be classified into two groups (overweight and obese). The obese group displayed significantly higher total body fat and a higher adiposity index compared with those of the overweight group. No differences in systolic blood pressure or nonesterified fatty acid, glucose, total cholesterol, or triglyceride levels were observed between the obese and overweight groups. The adiposity index of the obese group was positively correlated withfinal body weight, total body fat, and leptin levels. Despite the classification of sedentary rats into overweight and obese groups, it was not possible to identify differences in the comorbidities between the two groups.
Key words: Obesity; Adiposity index; Rats; Cluster analysis
Introduction
Obesity is characterized by excessive body fat accumu-lation. It is considered a global epidemic and constitutes a major public health concern (1). Although the etiology of obesity is complex, certain risk factors have been implicated in its development, including increased caloric intake and physical inactivity (2). Recent investigations have demon-strated that obesity decreases life expectancy and is asso-ciated with numerous medical complications, such as type 2 diabetes mellitus, dyslipidemia, and cardiovascular disease (3). To better understand the physiopathology of abnormalities associated with obesity, various animal models using either genetic or dietetic approaches have been proposed (4,5). Although genetic factors clearly contribute to the propensity of an individual to become obese, overconsumption of a high-energy diet may promote a positive high-energy balance and lead to overweight and obesity (6). Administering a high-fat diet to rodents reproduces many features of human obesity (7). Both humans and rodents tend to gain weight with high caloric
intake (8). However, despite ad libitum feeding of a high-fat diet, obesity occurs in some but not all experiments (9,10).
Fat storage in humans can be easily estimated using various indicators, such as waist circumference, the waist/hip ratio, skin-fold thickness, and bioimpedance (1). However, body mass index (the ratio of weight to height2) is most often used to quantify body fat in humans (11). In experimental studies in rats, several parameters, such as body weight (BW) (12,13), body mass index (14), total body fat (15), fat pad mass (15,16), adiposity index (14,17), the Lee index (18,19), magnetic resonance imaging (20), and dual-energy X-ray absorptiometry (21), have commonly been used to demon-strate increased adiposity and investigate the mechanisms underlying obesity. Studies have observed energy intake, nutrient partitioning, and weight gain to describe processes that differ between rats that are either prone or resistant to becoming obese (22,23). However, these investigations have not experimentally classified the degree of adiposity because
Correspondence: A.S. Leopoldo:<[email protected]>
separating and identifying different adiposity intervals in animals is difficult, in contrast to classifying human obesity using the body mass index. Therefore, categories of adiposity in rats, such as normal, overweight, and obese, have not been defined in experimental studies.
Obtaining homogeneous groups of animals to meas-ure their degree of adiposity is important, because it enables accurate diagnosis of experimental obesity and distinguishing between different parameters and comor-bidities in these models. Because of the lack of studies that have classified the degrees of adiposity experimen-tally, the purpose of the present study was to characterize the level of adiposity in rats fed a high-fat diet (HFD) using the adiposity index. To achieve this objective, we used cluster analysis to identify the metabolic and nutritional profiles of the animals and create adiposity intervals in an experimental model of obesity. We hypothesized that a cluster analysis of data from rats fed a HFD for 15 weeks would allow us to distinguish various degrees of adiposity, similar to those defined in human obesity.
Material and Methods
Animal care
Thirty-day-old male Wistar rats were individually caged and subjected to different dietary regimens. All animals had free access to water and chow (50 g/day). After starting the experimental protocol, BW was recorded weekly. The environment was maintained under a 12-h light/dark cycle that started at 6:00 am, a clean-air room temperature of 23±3°C, and 60±5% relative humidity. All experiments and
procedures were performed in accordance with the Guide for the Care and Use of Laboratory Animals published by the U.S. National Institutes of Health and approved by the Ethics Committee of the Faculdade de Medicina, Universidade Estadual Paulista, Botucatu, SP, Brazil (#565).
Diet and experimental protocol
The rats were distributed into two groups: normal diet (ND, n=41) and HFD (n=43). The ND group was fed a standard diet containing 12.3% kcal from fat, 57.9% kcal from carbohydrates, and 29.8% kcal from protein. The HFD group received a diet containing 49.2% kcal from fat, 28.9% kcal from carbohydrates, and 21.9% kcal from protein. The HFD was calorically dense (HFD=3.65 kcal/g vsND=2.95 kcal/g) because of the increased fat content. The rats were maintained on their respective diets for 15 consecutive weeks and then euthanized. After 15 weeks of the dietary protocol, the data underwent cluster analysis for adiposity classification.
Experimental diet composition
The experimental diets provided sufficient amounts of protein, vitamins, and minerals according to the Nutrient Requirements of Laboratory Animals (24). The ND and HFD used in this study were formulated by Agroceres (Brazil). The
ingredients were first ground and then mixed with vitamins and minerals. The mixture was formed into pellets, dried in a ventilated drying oven at 55±5°C, and stored at–20°C. The
ND (RC Focus 1765) contained soybean oil, whole corn, wheat bran, soybean bran, dicalcium phosphate, sodium chloride, fish and meatflour, an antioxidant additive, and a vitamin and mineral mixture.
The HFD contained sodium chloride, casein, pow-dered milk, soybean protein concentrate, whole corn, cracker flour, dicalcium phosphate, calcium carbonate, emulsifier additives, antioxidants,flavoring, and a vitamin and mineral mixture. The HFD was formulated with a 0.9% concentration of sodium chloride and included saturated and unsaturated fatty acids that provided 20% and 80% of fat-derived calories, respectively. The high-unsaturated-fat diet consisted of 38% monounsaturated fatty acids and 42% polyunsaturated fatty acids, which were derived from the following fatty acids: 38% oleic acid, 41% linoleic acid (n-6), and 1% linolenic acid (n-3).
Adiposity index
The animals were anesthetized with sodium pentobarbi-tal (50 mg/kg BW,ip), decapitated, and thoracotomized. The adipose tissue fat pads were then dissected and weighed. Total body fat was measured as the sum of the following individual fat pad weights: epididymal fat+retroperitoneal fat + visceral fat. The adiposity index was calculated as (total body fat/final BW) 100 (25). The adiposity index was used as a measure of adiposity, because the degree of fat tends to increase gradually with obesity.
Cluster analysis of the degree of adiposity
Currently, there are no standard criteria for defining overweight or obesity in laboratory animals (e.g., rats and mice), companion animals, or other species. Using the adiposity index of animals fed a ND or HFD, we performed cluster analysis to establish similar groups with regard to adiposity level and to distinguish degrees of adiposity in these rats.
Cluster analysis is a statistical tool for classification and data reduction. This method allows large amounts of undivided data to be classified into subgroups based on similar characteristics (26). Methods such as k-nearest neighbor classification are useful exploratory tools for classifying relatively large amounts of data into subgroups when there is some prior knowledge of the potential number of subgroups within the given data set. For example, this method can be used to classify animals into either a normal-weight or obese group based on their phenotypic characteristics (e.g., BW) (27).
clustering was the closest neighbor technique (single linkage method), and the similarity coefficient used was the median Euclidean distance (26). The procedure used to analyze the conglomerates was the SAHN strategy for the formation of groups (SAHN involves‘‘sequential, agglomerative, hierarchi-cal, and non-overlapping’’clusters). Finally, each cluster was described using dendrograms.
Determination of groups following cluster analysis Following cluster analysis, the animals were allocated to groups according to their degree of adiposity. However, in biological experiments, particularly studies with animals, the results do not necessarily yield homogeneous groups (10). For this reason, the animals that received a HFD and exhibited changes in adiposity similar to the ND group were excluded from the analysis. The same procedure was performed with the rats that received a ND and exhibited changes in adiposity that were similar to the HFD group. These animals were rejected because of the necessity to characterize and distinguish adiposity from only obesity in rats that were fed a HFD and not in rats fed a balanced ND. After selecting the groups, the following characteristics were compared: nutritional state, systolic blood pressure (SBP), and metabolic and hormonal measures.
Nutritional analysis. Food consumption was measured daily, and BW was monitored once per week. Weekly caloric intake was calculated as the average weekly food consumption the caloric value of each diet.
SBP. At the end of the experiment, SBP was assessed using the non-invasive tail-cuff method and a Narco BioSystems Electro-Sphygmomanometer (International Biomedical, USA). The average of two pressure readings was recorded for each animal.
Metabolic and hormonal measurements. At the end of the experimental period, the animals were subjected to 12–15 h of fasting, anesthetized using sodium pentobar-bital (50 mg/kg BW,ip), and euthanized by decapitation. Blood samples were collected in dry tubes, and serum was separated by centrifugation at 3000 gfor 15 min at 4°C and stored at –80°C for subsequent analysis. The serum was analyzed for glucose (GL), triglycerides (TG), total cholesterol (T-Chol), non-esterified fatty acids (NEFAs), insulin, and leptin. Serum GL, TG, and T-Chol concentrations were measured using an enzymatic auto-matic analyzer system (Technicon, RA-XT System; Global Medical Instrumentation, USA). NEFA levels were deter-mined according to the method of Johnson and Peters (28) using colorimetric kits (WAKO NEFA-C; Wako Pure Chemical Industries, Japan). Leptin and insulin levels were determined using an enzyme-linked immunosorbent assay with specific commercial kits according to the manufacturer’s instructions (Linco Research, USA) (29).
Statistical analysis
Data from the cluster analysis, metabolic measurements, nutritional characteristics, and SBP values are reported as
means±SD. These values are also reported as means and
upper and lower limits of 95% confidence intervals for the mean. The results obtained from the cluster analysis were analyzed using one-way analysis of variance (ANOVA) followed by the Bonferronipost hoctest. Correlation analyses were conducted using the Pearson’s linear correlation test. The level of significance was 5%.
Results
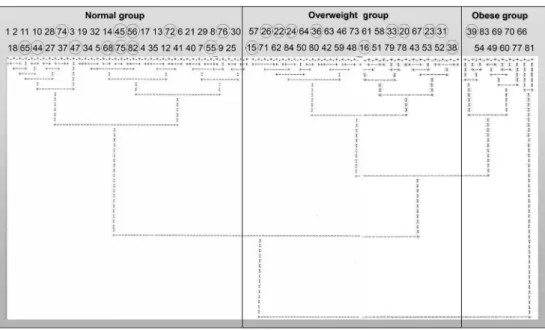
Following cluster analysis, 12 animals were excluded from each group because these rats displayed adiposity indices that were similar to the opposing group (Figure 1). Thus, the present study comprised 29 control animals and 31 overweight or obese animals. Furthermore, the cluster analysis allowed us to divide the rats that were fed a HFD into overweight (n=22) and obese (n=9) groups according to their degree of adiposity (Figure 1).
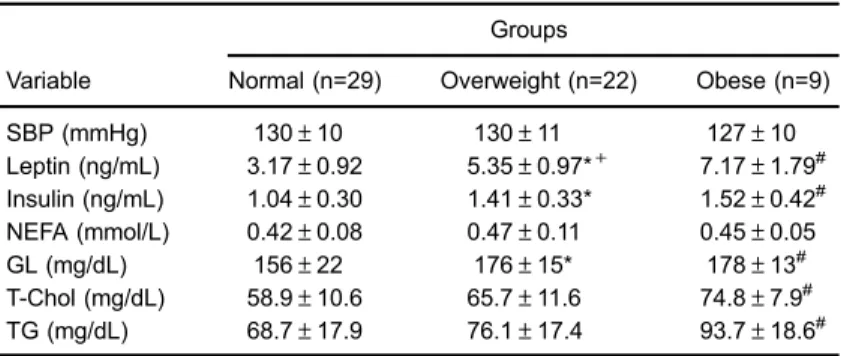
Tables 1 and 2 demonstrate that the overweight and obese groups exhibited significant differences in food con-sumption,final BW, visceral, retroperitoneal and epididy-mal fat pad mass, total body fat, and the adiposity index compared with those of the ND group. Furthermore, serum GL, leptin, and insulin levels were higher in the overweight and obese groups compared with those of the ND group. However, no differences in SBP or NEFA levels were observed between groups (Table 2). Additionally, caloric intake and T-Chol and TG levels were lower in the ND group compared only with those of the obese group (Tables 1 and 2).
Figures 2 and 3 report the confidence intervals for each group. After comparing the overweight and obese groups with the ND group, we identified no overlapping confidence intervals for the adiposity index, total body fat, orfinal BW (Figure 2). The confidence intervals for SBP and TG levels overlapped between the ND, overweight, and obese groups. However, no overlap was observed for leptin, insulin, or GL between the overweight and ND groups (Figure 3). The leptin or T-Chol level confidence intervals in the obese group did not overlap with those of the ND group.
Obese animals displayed a significantly higher final BW (P=0.03), total body fat (Po0.001), and adiposity index (Po0.001) than those of the overweight group (Tables 1 and 2). Additionally, fat pad weights were higher in the obese group than those in the overweight group (Po0.001). Although food consumption did not differ between the overweight and obese groups (P=0.076), caloric intake was greater in the obese group than that in the overweight group (P=0.04). No differences were identified in SBP or NEFA, glucose, T-Chol, or TG levels between the overweight and obese groups.
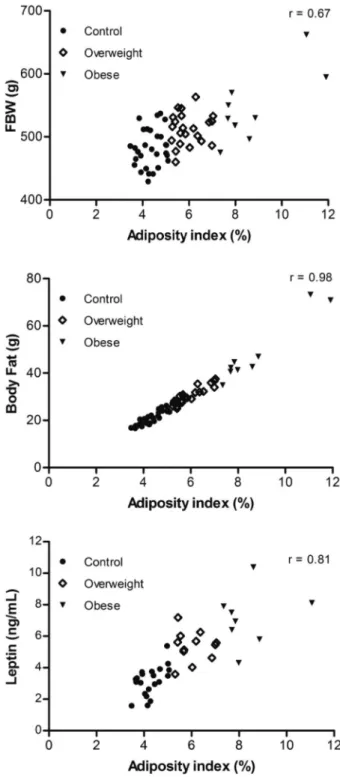
SBP, and leptin, insulin, GL, T-Chol, and TG levels were observed between the two groups (Figures 2 and 3). The adiposity index for all rats was positively correlated with final BW (r=0.67; Po0.05), body fat (r=0.98; Po0.05), and leptin levels (r=0.81; Po0.05) based on the Pear-son’s linear correlation test (Figure 4).
Discussion
The diet used in the present study was of sufficient nutritional density and duration to promote obesity in rats. The contribution of caloric intake to obesity development in
this model elicited significant differences in BW, body fat, fat pad mass, and the adiposity index between the obese and ND groups. The HFD also promoted many indicators that resemble those of human comorbidities caused by obesity, such as hyperinsulinemia, hyperleptinemia, and elevated serum GL, T-Chol, and TG levels. These results are consistent with several studies that induced obesity in rats by HFD-feeding (12,13,30).
The primary contribution of this study was the use of cluster analysis that allowed classification of degrees of adiposity in rats using the adiposity index, which is essential for studies that use experimental models to study obesity Figure 1. Dendrogram of cluster analysis according to the adiposity index of control, overweight, and obese rats. Normal: animals from 1 to 41 that were fed a standard diet; overweight and obese: animals from 42 to 84 that received a high-fat diet. Animals represented by a circle were excluded from the study.
Table 1.Nutritional parameters, fat pad mass and adiposity index.
Groups
Variable Normal (n=29) Overweight (n=22) Obese (n=9)
FC (g/day) 27.6±1.8 23.0±1.6* 24.7±2.8# CI (Kcal/day) 81.4±5.3 83.8±5.8+ 90.2±10.2#
BW (g) 482±30 512±25*+ 547±56#
Visceral fat (g) 5.74±1.24 7.80±1.26*+ 13.0±4.2# Retroperitoneal fat (g) 7.78±1.28 12.1±1.9*+ 19.6±7.5# Epididymal fat (g) 7.52±1.26 10.6±2.0*+ 16.0±4.3# Body fat (g) 21.0±2.9 30.5±3.6*+ 48.6±13.7# Adiposity index (%) 4.36±0.49 5.96±0.60*+ 8.78±1.62#
Data are reported as means±SD. FC: food consumption; CI: calorie intake; BW: body weight. Normal: group fed a standard diet; overweight and obese: groups fed a high-fat diet. * Po0.05, overweightvsnormal;+Po0.05, overweight
development. Cluster analysis is frequently used to stratify objects into groups according to similar characteristics (26,27,31,32). To our knowledge, this is thefirst study that has used cluster analysis to experimentally classify adiposity in an animal model of obesity. Furthermore, this technique allowed the creation of classification groups in accordance with the level of adiposity, similar to those defined for human obesity (i.e., overweight and obese) using the body mass index. This method enabled us to investigate the effects of varying degrees of obesity on nutritional, metabolic and hormonal parameters.
In studies using obese rats, the classification of obesity severity is limited. Researchers usually separate animals into those that are prone or resistant to obesity development
(33–36), but they do not further sub-classify obesity-prone animals. In the present study, using the adiposity index, we demonstrated that obese rats exhibited different degrees of adiposity that could be classified into two groups. This heterogeneity is an important factor that may lead to discrepancies in experimental results because a relationship exists between the severity of obesity and its effects (10,15). Seeking one criterion that can be used to classify animals according to obesity severity, similar to the body mass index in humans, is necessary.
Cluster analysis did not demonstrate overlapping adiposity indices or total body fat between the overweight and obese groups. Body weight, an index that is often used as an indicator of obesity, exhibited overlap between Table 2.Systolic blood pressure and metabolic and hormonal characteristics.
Groups
Variable Normal (n=29) Overweight (n=22) Obese (n=9)
SBP (mmHg) 130±10 130±11 127±10
Leptin (ng/mL) 3.17±0.92 5.35±0.97*+ 7.17±1.79# Insulin (ng/mL) 1.04±0.30 1.41±0.33* 1.52±0.42# NEFA (mmol/L) 0.42±0.08 0.47±0.11 0.45±0.05 GL (mg/dL) 156±22 176±15* 178±13# T-Chol (mg/dL) 58.9±10.6 65.7±11.6 74.8±7.9# TG (mg/dL) 68.7±17.9 76.1±17.4 93.7±18.6#
Data are reported as means±SD. SBP: systolic blood pressure; NEFA: non-esterified fatty acid; GL: serum glucose; T-Chol: total cholesterol; TG: triacylglycerol. Normal: group fed a standard diet; overweight and obese: groups fed a high-fat diet. * Po0.05, overweightvsnormal; +Po0.05 overweight vs obese;#P
o0.05, obesevsnormal (one-way ANOVA; Bonferronipost hoctest).
the overweight and obese groups. However, the mean BW differed between the overweight and obese groups. Some previously published reports have demonstrated that BW can be a misleading indicator of obesity (10,15). In this case, BW greatly underestimated the actual degree of obesity that developed in obese rats. Our overlapping BW results confirmed that this variable alone is not a good indicator of adiposity.
Obesity is accompanied by many metabolic and hormonal changes, including glucose, T-Chol, TG, leptin, and insulin
TG levels in the obese rats. Importantly, hypertriacylglycer-olemia is also associated with insulin resistance (38), which results in increased insulin levels to normalize blood glucose values, a condition called hyperinsulinemia.
Another parameter that is commonly impaired in obesity is arterial hypertension (19), although in this study alterations in SBP were not present. SBP confidence intervals also overlapped between the overweight and obese groups. Previous studies have reported an asso-ciation between salt intake and increased blood pressure in experimental animals fed high levels of salt (19,39,40). Dobrian et al. (19) demonstrated that both 2% and 4% NaCl in a HFD induced a rapid increase in SBP in obesity-prone but not obesity-resistant or control rats. The absence of arterial hypertension in the overweight and obese groups in the current study may have been because of the low NaCl concentration (0.9%) in the HFD. Because the confidence intervals of many variables (metabolic, hormonal, and cardiovascular) overlapped between the two groups, we can confirm that these parameters were not accurate as individual markers of the degree of obesity in rats. Therefore, the joint or isolated use of variables that do not overlap will allow the classification of obesity in rats into two different degrees of adiposity.
As described in the results section above, some variables overlapped between the normal, overweight, and obese groups, although the mean values were significantly different. Such overlap can occur because of the variability in animals, which results in non-homogenous groups. Thus, animals that were fed a ND exhibited variable responses, and some animals even displayed characteristics that resemble those of obese animals. Although overlapping confidence intervals occurred among the control, overweight, and obese groups, the results indicated that for the extreme points, the normal and obese group means differed for almost all variables, most likely because of the high degree of adiposity in the obese group. Only SBP and NEFA levels did not differ between the three groups. Our study also confirmed that the adiposity index and other markers of obesity were positively correlated (Figure 4). These results suggest that the adiposity index is a good indicator of obesity, similar to several other studies that have used the adiposity index as an indicator of fat accumulation (14,19,36).
In conclusion, cluster analysis of the data obtained from sedentary rats subjected to 15 weeks of a HFD allowed the rats to be divided into two different categories of adiposity (overweight and obese). However, identifying differences in the cardiac and metabolic parameters between these two groups was not possible. Further studies with more pro-longed periods of obesity are necessary to evaluate the different degrees of obesity and their potential association with disorders that resemble human comorbidities.
Acknowledgments
This manuscript has been proofread and edited by native English speakers with related biomedical back-grounds from BioMed Proofreading LLC. This research was supported by FAPESP (#2007/53267-3 and #2006/ 59485-0).
References
1. O’Brien PE, Dixon JB. The extent of the problem of obesity.
Am J Surg2002; 184: 4S–8S.
2. Stein CJ, Colditz GA. The epidemic of obesity.J Clin Endocrinol Metab2004; 89: 2522–2525.
3. López-Jiménez F, Cortés-Bergoderi M. Obesity and the heart.
Rev Esp Cardiol 2011; 64: 140–149, doi: 10.1016/j.recesp. 2010.10.010.
4. Carroll JF, Dwyer TM, Grady AW, Reinhart GA, Montani JP, Cockrell K, et al. Hypertension, cardiac hypertrophy, and neurohumoral activity in a new animal model of obesity.
Am J Physiol1996; 271: H373–H378.
5. Kanasaki K, Koya D. Biology of obesity: lessons from animal models of obesity.J Biomed Biotechnol2011; 2011: 197636, doi: 10.1155/2011/197636.
6. Swinburn B, Egger G. Preventive strategies against weight gain and obesity.Obes Rev2002; 3: 289–301, doi: 10.1046/ j.1467-789X.2002.00082.x.
7. Lauterio TJ, Bond JP, Ulman EA. Development and character-ization of a purified diet to identify obesity-susceptible and resistant rat populations.J Nutr1994; 124: 2172–2178. 8. Chicco A, Bernal C, Soria A, Giangrossi G, Lombardo Y. Dietary
effects of partial or total substitution of sucrose for starch on glucose and lipid metabolism in dyslipidemic rats. Nutr Res
1999; 19: 281–293, doi: 10.1016/S0271-5317(98)00191-2. 9. Commerford SR, Pagliassotti MJ, Melby CL, Wei Y, Gayles EC,
Hill JO. Fat oxidation, lipolysis, and free fatty acid cycling in obesity-prone and obesity-resistant rats.Am J Physiol Endo-crinol Metab2000; 279: E875–E885.
10. Nascimento AF, Sugizaki MM, Leopoldo AS, Lima-Leopoldo AP, Nogueira CR, Novelli EL, et al. Misclassification pro-bability as obese or lean in hypercaloric and normocaloric diet. Biol Res 2008; 41: 253–259, doi: 10.4067/S0716-97602008000300002.
11. WHO. Obesity: preventing and managing the global epidemic. Report of a WHO consultation.World Health Organ Tech Rep Ser2000; 894: 1–253.
12. Akiyama T, Tachibana I, Shirohara H, Watanabe N, Otsuki M. High-fat hypercaloric diet induces obesity, glucose intolerance and hyperlipidemia in normal adult male Wistar rat.Diabetes Res Clin Pract1996; 31: 27–35, doi: 10.1016/ 0168-8227(96)01205-3.
13. Wilson CR, Tran MK, Salazar KL, Young ME, Taegtmeyer H. Western diet, but not high fat diet, causes derangements of fatty acid metabolism and contractile dysfunction in the heart of Wistar rats.Biochem J2007; 406: 457–467.
14. Sinitskaya N, Gourmelen S, Schuster-Klein C, Guardiola-Lemaitre B, Pevet P, Challet E. Increasing the fat-to-carbohydrate ratio in a high-fat diet prevents the development of obesity but not a prediabetic state in rats.Clin Sci2007; 113: 417–425, doi: 10.1042/CS20070182.
15. Woods SC, Seeley RJ, Rushing PA, D’Alessio D, Tso P. A controlled high-fat diet induces an obese syndrome in rats.
J Nutr2003; 133: 1081–1087.
16. Song Y, Park HJ, Kang SN, Jang SH, Lee SJ, Ko YG, et al. Blueberry peel extracts inhibit adipogenesis in 3T3-L1 cells and reduce high-fat diet-induced obesity.PLoS One2013; 8: e69925, doi: 10.1371/journal.pone.0069925.
17. Levin BE, Dunn-Meynell AA, McMinn JE, Alperovich M, Cunningham-Bussel A, Chua SC Jr. A new obesity-prone, glucose-intolerant rat strain (F.DIO). Am J Physiol Regul Integr Comp Physiol2003; 285: R1184–R1191, doi: 10.1152/ ajpregu.00267.2003.
18. Diniz YS, Burneiko RM, Seiva FR, Almeida FQ, Galhardi CM, Filho JL, et al. Diet compounds, glycemic index and obesity-related cardiac effects.Int J Cardiol2008; 124: 92–99, doi: 10.1016/j.ijcard.2006.12.025.
19. Dobrian AD, Davies MJ, Prewitt RL, Lauterio TJ. Develop-ment of hypertension in a rat model of diet-induced obesity.
Hypertension2000; 35: 1009–1015, doi: 10.1161/01.HYP.35. 4.1009.
20. Nadkarni NA, Chaumontet C, Azzout-Marniche D, Piedcoq J, Fromentin G, Tome D, et al. The carbohydrate sensitive rat as a model of obesity.PLoS One2013; 8: e68436, doi: 10.1371/journal.pone.0068436.
21. Gerbaix M, Metz L, Ringot E, Courteix D. Visceral fat mass determination in rodent: validation of dual-energy X-ray absorptiometry and anthropometric techniques in fat and lean rats.Lipids Health Dis2010; 9: 140, doi: 10.1186/1476-511X-9-140.
22. Chang S, Graham B, Yakubu F, Lin D, Peters JC, Hill JO. Metabolic differences between prone and obesity-resistant rats.Am J Physiol1990; 259: R1103–R1110. 23. Commerford SR, Pagliassotti MJ, Melby CL, Wei Y, Hill JO.
Inherent capacity for lipogene sis or dietary fat retention is not increased in obesity-prone rats. Am J Physiol Regul Integr Comp Physiol2001; 280: R1680–R1687.
24. Benevenga NJ, Calvert C, Eckhert CD, Fahey GC, Greger JL, Keen CL, et al. Nutrient requirements of the laboratory rat. In: Anonymous, Nutrient requirements of laboratory animals. Washington: National Academy Press; 1995. p 192. 25. Taylor BA, Phillips SJ. Detection of obesity QTLs on mouse
chromosomes 1 and 7 by selective DNA pooling.Genomics
1996; 34: 389–398, doi: 10.1006/geno.1996.0302. 26. Everitt B, Hothorn T.An introduction to applied multivariate
analysis with R. Heidelberg: Springer; 2011.
27. Assaad H, Yao K, Tekwe CD, Feng S, Bazer FW, Zhou L, et al. Analysis of energy expenditure in diet-induced obese rats.Front Biosci2014; 19: 967–985.
28. Johnson MM, Peters JP. Technical note: an improved method to quantify nonesterified fatty acids in bovine plasma.J Anim Sci1993; 71: 753–756.
29. Okere IC, Chandler MP, McElfresh TA, Rennison JH, Sharov V, Sabbah HN, et al. Differential effects of saturated and unsat-urated fatty acid diets on cardiomyocyte apoptosis, adipose distribution, and serum leptin.Am J Physiol Heart Circ Physiol
2006; 291: H38–H44, doi: 10.1152/ajpheart.01295.2005. 30. Dourmashkin JT, Chang GQ, Gayles EC, Hill JO, Fried SK,
Julien C, et al. Different forms of obesity as a function of diet composition.Int J Obes2005; 29: 1368–1378, doi: 10.1038/ sj.ijo.0803017.
31. Ebrahim S, Montaner D, Lawlor DA. Clustering of risk factors and social class in childhood and adulthood in British women’s heart and health study: cross sectional analysis.
32. Krimer LS, Zaitsev AV, Czanner G, Kroner S, Gonzalez-Burgos G, Povysheva NV, et al. Cluster analysis-based physiological classification and morphological properties of inhibitory neurons in layers 2-3 of monkey dorsolateral prefrontal cortex.J Neurophysiol2005; 94: 3009–3022, doi: 10.1152/jn.00156.2005.
33. Pagliassotti MJ, Knobel SM, Shahrokhi KA, Manzo AM, Hill JO. Time course of adaptation to a high-fat diet in obesity-resistant and obesity-prone rats.Am J Physiol1994; 267: R659–R664. 34. Carroll JF, Zenebe WJ, Strange TB. Cardiovascular function
in a rat model of diet-induced obesity.Hypertension2006; 48: 65–72, doi: 10.1161/01.HYP.0000224147.01024.77. 35. Jackman MR, MacLean PS, Bessesen DH. Energy
expen-diture in obesity-prone and obesity-resistant rats before and after the introduction of a high-fat diet.Am J Physiol Regul Integr Comp Physiol2010; 299: R1097–R1105, doi: 10.1152/ajpregu.00549.2009.
36. Boustany CM, Bharadwaj K, Daugherty A, Brown DR, Randall DC, Cassis LA. Activation of the systemic and
adipose renin-angiotensin system in rats with diet-induced obesity and hypertension.Am J Physiol Regul Integr Comp Physiol2004; 287: R943–R949, doi: 10.1152/ajpregu.00265. 2004.
37. Trayhurn P, Beattie JH. Physiological role of adipose tissue: white adipose tissue as an endocrine and secretory organ. Proc Nutr Soc 2001; 60: 329–339, doi: 10.1079/ PNS200194.
38. Levine TB, Levine AB.Metabolic syndrome and cardiovas-cular disease. Philadelphia: Saunders/Elsevier; 2006. 39. Nascimento AR, Machado M, de Jesus N, Gomes F, Lessa
MA, Bonomo IT, et al. Structural and functional microvas-cular alterations in a rat model of metabolic syndrome induced by a high-fat diet. Obesity2013; 21: 2046–2054, doi: 10.1002/oby.20358.