E
SSAYS IN
E
XPORTS AND
O
WNERSHIP
O
UTCOMES
E
RNESTOJ
OSÉG
ONÇALVES DEF
REITASADVISOR
:
P
ROFESSORJ
OSÉM
ATAA dissertation submitted to
Nova School of Business and Economics
Universidade Nova de Lisboa
in partial fulfillment of the requirements for the degree of
Doctor of Philosophy
in
Economics
Contents
Introduction ... 8
Domestic Market and Export Decisions ... 9
1. Introduction ... 9
2. Theoretical Framework ... 10
3. Data and Methods ... 14
4. Results ... 18
5. Conclusion ... 32
Acknowledgments ... 33
References ... 34
Tables ... 36
Productivity and Export Intensity ... 56
1. Introduction ... 56
2. Theoretical Framework ... 57
3. Data and Methods ... 64
4. Results ... 68
5. Conclusion ... 76
Acknowledgments ... 77
References ... 78
Tables and Figures ... 80
Foreignness and Exit Over the Life Cycle of Firms ... 92
1. Introduction ... 92
2. Literature and Hypothesis ... 95
3. Methods... 103
4. Results ... 108
5. Discussion ... 114
6. Conclusion ... 116
Acknowledgments ... 118
References ... 119
Private vs Public Ownership: Labor Outcomes in the Banking Industry ... 126
3
3. Privatization of the banking industry in Portugal ... 135
4. Theoretical Framework ... 138
5. Empirical Strategy ... 141
6. Model for the outcomes ... 146
7. Data and Outcomes ... 156
8. Ownership Effects ... 159
9. Evaluation of the privatization process ... 170
10. Conclusion ... 171
Acknowledgments ... 172
References ... 173
List of Tables
Table 1. Real GDP Growth (%) ... 18
Table 2. Logit Regressions of Exporter Status ... 25
Table 3. Fixed Effects Regressions of Exports ... 28
Table 4. Logit Regressions of Exporter Status ... 30
Table 5. Fixed Effects Regressions of Exports ... 31
Table 6a. Number of Firms by Country ... 36
Table 6b. Number of Foreign Firms and Domestic Firms with Foreign Subsidiaries.36 Table 6c. Share of Sample Exports in Overall Country Product Exports...36
Table 7a. Firm Level Summary Statistics ... 37
Table 7b. Firm Level Summary statistics…...38
Table 7c. Distribution of Firms by Industry...39
Table 8a. Domestic 2-digit Industry Growth Faced by Firms, as provided by Eurostat ... 40
Table 8b. EU27 2-digit Industry Growth Faced by Firms, as provided by Eurostat (%)………40
Table 9a. Total Product Exports (constant prices, M€) ... 41
Table 9b. Change in Total Product Exports (%)...41
Table 10a. Sample Aggregate Exports (constant prices, M€) ... 41
Table 10b. Change in Sample Aggregate Exports (%)...41
Table 10c. Number of Exporting Firms...42
Table 10d. Change in the Number of Exporting Firms (%)...42
Table 11a. Change of Selected Firm Variables by Year for Portuguese Firms (%) .... 43
Table 11b. Change of Selected Firm Variables by year for French Firms (%)...43
Table 11c. Change of Selected Firms Variables by Year for Hungarian Firms (%)....43
Table 12a. Firm Entry and Exit from Export Markets and Entrant Aggregate Exports (M€) ... 44
Table 12b. Number of Exporters and Corresponding Exports of the 2008 Cohort of the Entrant and Incumbent Exporters...45
5
Table 12d. Number of Exporters and Corresponding Exports of the 2010 Cohort of
Entrant and Incumbent Exporters...47
Table 12e. Number of Exporters and Corresponding Exports of the 2011 Cohort of Entrant and Incumbent Exporters...48
Table 12f. Number of Exporters and Corresponding Exports of the 2012 Cohort of Entrant and Incumbent Exporters...49
Table 13a. Export Market Reentry of Firms that Cease Exporting in 2008 ... 50
Table 13b. Export Market Reentry of Firms that Cease Exporting in 2009...50
Table 13c. Export Market Reentry of Firms that Cease Exporting in 2010...51
Table 14a. Export Behavior of the Cohort of New Exporters in 2008 ... 52
Table 14b. Export Behavior of the Cohort of New Exporters in 2009 ... 52
Table 14c. Export Behavior of the Cohort of New Exporters in 2010 ... 53
Table 14d. Export Behavior of the Cohort of New Exporters in 2011 ... 54
Table 14e. Export Behavior of the Cohort of New Exporters in 2012 ... 55
Table 15. OLS Regressions of Export Intensity ... 74
Table 16. Aggregate Values for 2011 ... 80
Table 17. Aggregate Exports by year (Millions of Euros) ... 80
Table 18. Distribution of Firms by Industry and Firm Ownership Type ... 81
Table 19. Summary Statistics (2008-2011) ... 82
Table 20. Input Coefficient Estimates from Pooled OLS at the two-digit level ... 84
Table 21. Input Coefficient Estimates from Pooled OLS at the three-digit level ... 85
Table 22. Input Coefficient Estimates from Fixed Effects at the two-digit level ... 86
Table 23. Input Coefficient Estimates from Fixed Effects at the three-digit level ... 87
Table 24. Correlation of TFP Estimates across Estimators ... 89
Table 25. Summary Statistics of TFP Estimates (FE3D) by Firm Ownership Type ... 89
Table 26. Distribution of TFP Estimates (FE3D) by Firm Ownership Type ... 89
Table 27. Proportion of firms excluded in 2-digit NACE industries ... 105
Table 28. Exit Rates ... 106
Table 29. Control Variables ... 108
Table 30. Regression Results ... 109
Table 31. Evolution of Banks ... 178
Table 32. Employment Relations Between 1996 and 2006 ... 178
Table 33. Employment Relations Between 1985 and 1988 ... 179
Table 35. Proportional Hazard Model for the Period 1985-1988 ... 181
Table 36. Macroeconomic Conditions ... 182
Table 37. Summary Statistics 2005 ... 183
Table 38. Logit Model for the Probability of Choosing the Private Sector ... 184
Table 39. Propensity Score Matching ... 184
Table 40. Propensity Score Matching - Wage per Hour ... 185
Table 41. Propensity Score Matching - Median Employment Duration ... 185
Table 42. Propensity Score Matching - Hazard Rate ... 186
Table 43. DID - Propensity Score Matching ... 186
Table 44. Auxiliary Regression for the MTE of Log(Wage per Hour) ... 187
7
List of Figures
Figure 1. Distribution of Key Variables by firms Ownership Type of Exporter ... 83
Figure 2. Distribution of Firms TFP Estimates by Estimator ... 88
Figure 3. Firm Age and TFP by Firm Ownership Type ... 90
Figure 4. Non-Parametric Local Polynomial Regressions of Export Intensity on TFP by Firm Ownership Type ... 91
Figure 5. Conditional Exit Probabilities ... 110
Figure 6. Conditional Exit Probabilities (age class) ... 113
Figure 7. Propensity Scores Density ... 189
Figure 8. MTE - Log(Wage) ... 189
Figure 9. MTE - Open-ended Contracts ... 190
Figure 10. MTE - Log(Median Employment Duration) ... 190
Figure 11. MTE - Log(Hazard Rate) ... 191
Figure 12. Summary Statistics ... 192
Figure 13. Summary Statistics (cont.) ... 193
Figure 14. PSM - Wage per Hour ... 194
Introduction
The first three chapters address the international strategy of firms, and the implications for firm participation and behavior in both domestic and international markets. The first chapter addresses the question of whether firms facing poor domestic market performance react by adjusting their position in foreign markets. This response can occur both by having non-exporting firms entering export markets, or by having existing exporters expand exports. We test this hypothesis in a period of large variation in exports to find that small firms enter export markets in response to poor domestic market performance, but that firms cannot easily make up for lost domestic sales with increases in exports.
The second chapter addresses the question of whether the establishment of subsidiaries abroad by domestic firms is accompanied with a decrease in firm export intensity in the domestic market. This would be expected if established subsidiaries abroad were constituted by firms to relocate exported home production to local
production in the host country, in order to better supply the host country. We find little evidence in support of this hypothesis and discuss how subsidiary establishment might be done to build distribution networks that would benefit home exports.
The third chapter compares survival prospects of domestic and foreign firms over their life cycle. It is found that comparable foreign firms exit more than domestic firms, both due to decreasing exit rates by domestic firms and to increasing exit rates by foreign firms. It is argued that foreign firms, while possibly subject to a liability of foreignness which should decrease over time, are also intrinsically footloose and that this
characteristic ultimately leads to increasing exit rates for foreign firms as they age. The fourth chapter looks at firm differences in another dimension of ownership, that of public versus private ownership of firms. It analyses the impact of a privatization process on several labor outcomes, using the banking sector. It is found that there are no distinguishable differences on wages per hour between private and public banks.
9
Domestic Market and Export Decisions
1. Introduction
The expectation that exports can promote economic growth has led countries to adopt “export-led growth” strategies, regardless of their initial country development level (Marin, 1992). Export promotion policies are also pursued at the micro level, including support for export promotion agencies or government subsidies in support of export activity (Bernard & Jensen, 2004). Interest in the behavior of the export supply function has increased, as some countries view alternative currency and fiscal policy instruments as unavailable or undesirable tools to promote short-run economic growth (Eichengreen, 2007).
While disturbances in the export behavior of firms are strongly influenced by movements in exchange rates, microeconomic studies on the exporting behavior of firms have identified productivity as the main firm level determinant of the export decisions of firms (Bernard et al., 1995). Thus, movements in the export supply function of countries that share a common currency with their main trading partners could be expected to accompany movements in the overall productivity of firms in those countries. For instance, an expansion of the export supply is expected for countries without a national currency as a result of high unemployment, as high unemployment puts a downward pressure in labor costs that feeds back to firms as higher productivity per unit labor cost (Wolf, 2011).
We focus on the hypothesis that negative shocks in the domestic demand can lead some firms to initiate or expand an already existing position in international markets, as a result of the shock. As a negative shock in the domestic demand does not directly impact the individual productivity of firms, we discuss how international market entry or
small firms in export markets. However, we do not find evidence that the exports of existing exporters or even the exports of entrant exporters, either at the year of entry or at subsequent years, are substantially increased as a result of poor domestic market
performance.
2. Theoretical Framework
The productivity of firms is the main determinant of their participation in
international markets, and the relationship between firm performance and participation in international markets has been widely researched, both at the empirical level (Wagner, 2007; Wagner, 2012) and at the theoretical level (Melitz, 2003). Some of main findings of this research are that firms that participate in international markets have higher productivity than firms that do not, and that gains in the productivity of exporting firms, for instance, are achieved several years before the occurrence of firm entry in
international markets. This finding is taken as evidence of self-selection of the more productive firms into international markets. The higher productivity of firms participating in international markets is seen as necessary for firms that participate in international markets, as placing goods in international markets requires that firms bear substantial additional costs relative to domestic operations (Melitz, 2003).
While most of the research focuses on firm entry in international markets, there is also evidence that firm productivity determines firm exit from international markets. Looking at productivity trajectories of plants that have ceased exporting, Clerides et al. (1998) found that these plants had remarkably poor performance when compared to either plants that participated continuously in export markets, to plants that did not participate in export markets or to plants that were just starting participation in export markets. It was also found that the performance of plants that ceased exporting decreased steadily in the years prior to their exit from foreign markets. Thus, productivity is an important
determinant for both firm entry and exit from international markets, and poor productivity may force firms to exit international markets.
11
international market participation (Grossman et al., 2006). Thus, a negative shock in the domestic demand does not directly imply firm participation in international markets, as it has no direct influence in either individual firm productivity or costs of international trade. In fact, if a firm did not have a sufficiently high productivity to profitably incur in the costs associated with participation in international markets prior to a negative
domestic shock, it could face even worse prospects while trying to do so afterwards, as it might have to handle a worse position in the domestic market.
While there are no direct effects of domestic market contractions in the
productivity of firms, there may be some indirect effects. A demand contraction could contribute to decreases in wages or factor prices in general, which would indirectly increase firm productivity. For instance, a large negative shock in domestic demand, if accompanied with high unemployment, might result in higher productivity for firms due to the downward pressure put on wages, which may feed back into firms as higher productivity per labor unit (Wolf, 2011). Even without high unemployment, there may still be wage concessions at the firm level, as negative product market shocks have been shown to reduce wage growth (Hamermesh, 1988). However, this process is necessarily not immediate in time, and not sufficient to explain recent cases of surges in the export supply, as the export supply expands before significant drops in unit labor costs or other factor prices take place.
Firms might engage in international markets in response to an adverse shock in the domestic demand due to the short-run cost structure in place at the time of the shock or due to non-profit firm goals such as reduction of sales volatility or firm survival, even if there are no immediate effects in productivity. Firms might also exert efforts to
increase their productivity ahead of an internationalization goal.
the likelihood of internationalization due to a negative shock in domestic demand is higher.
Currency devaluations provide evidence that firms have the ability to shift production from domestic to international markets. Thus, firms should also have the ability to shift production in the event of a negative domestic market shock (Roberts & Tybout, 1997). If the increased expected profit of operating in international markets resulting from a currency devaluation is sufficient to make firms shift production from domestic to international markets, the incentive to do so should also exist in the case of a negative domestic demand shock. Given their installed capacity, firms might face a low opportunity cost of entering markets if they are not able to place their production
domestically, unlike the case of a currency devaluation where the value of domestic sales is just smaller.
However, effective substitution of domestic sales with sales abroad could be moderated by firm access to distribution networks. The internationalization of firms has been often, although not universally, described as a slow and gradual process along which firms build a network of ties with distinct agents in foreign markets (Johanson & Vahlne, 1977; Oviatt & McDougall, 2005). The gradual nature of the process suggests the existence of hurdles that constrain the ability of firms to substitute domestic market sales with sales abroad in the short run. Thus, we expect existing exporters and in
particular exporters that are more advanced in the internationalization process, to be more able to redirect production from domestic to foreign markets than non-exporters or firms with smaller international market experience. We also expect that foreign firms, due to their membership in a multinational network of affiliates, are also more able to redirect production from domestic to foreign markets.
13
export hysteresis (Baldwin & Krugman, 1989; Dixit, 1989). In fact, exposure to past exporting episodes increases the likelihood of future exporting behavior (Roberts & Tybout, 1997). It has been found that temporary devaluations in currency rates have had persistent effects in trade flows (Baldwin, 1988). The persistence effect can be generated with simple models, in which it results from the sunk costs firms have to incur when entering in international markets (Baldwin, 1986). Firms necessarily incur in some sunk costs when they enter in international markets, and as long as these costs are not
completely depreciated, they decrease the barriers to further reentry in international markets, and make exit less likely. An alternative source of persistence could be the existence of acquired tastes in international markets, which would increase demand for the products of new exporting firms right after an initial exposure of these products to international markets (Baldwin, 1988).
There are internationalization benefits in other dimensions of firm performance other than increased profitability. As long as export sales are not perfectly correlated with domestic sales, the volatility of total sales of the firm will be smaller than the combined volatility of domestic and foreign sales, even if foreign markets can be conceived as being more competitive and inherently riskier. Due to a portfolio effect, firms could decrease the total risk they face by engaging in a riskier project. Accordingly, engaging in exports would provide the non-profit benefit of total sales stabilization for firms, as has been documented empirically (Hirsch & Lev, 1971). Thus, firms facing domestic market instability or uncertainty may seek foreign markets as a risk hedging strategy.
market, might lead firms to internationalize if they perceive that investing in less profitable foreign markets would lead to an increase in firm survival.
While the productivity of firms is an important determinant on the ability of firms to internationalize, forward looking behavior of firm managers might make the link between productivity and international market participation partially endogenous. If firm managers have the ability to make decisions that enhance the productivity of firms as they ramp-up to become exporters, when facing a negative shock in the domestic demand, then productivity may not be completely exogenous and stochastically
determined, but endogenous and the result of forward looking decisions taken by the firm (Hallward-Driemeier et al., 2002). According to this view, firms consciously self-select by introducing new technologies or increasing R&D expenditures in order to be able to export high-quality goods and increase their productivity in the process (López, 2005). In fact, Alvarez (2004) provides evidence of persistent exporters resorting to a more
intensive use of publicly available programs partially designed to promote exporting activity, than sporadic exporters. So, persistent export market participation can be partially traced to higher voluntary firm participation in export promoting activities. Thus, firms facing negative prospects in the domestic demand would have an added incentive to import, develop, or somehow acquire technology that allows the firm to be more productive, with the intention of future international market participation.
Summing up, we expect negative growth in the domestic market to lead to firm entry in export markets. We expect this effect to be larger when negative domestic shocks hinder firm survival or create sales volatility, as may be the case in large domestic shocks or prolonged negative growth. We expect negative growth to permanently enhance the stock of exporters and that firms place production abroad when domestic market performance is poor, particularly firms with more access to international distribution networks.
3. Data and Methods
15
We could not use data for all countries in the Amadeus dataset, as some countries had no export data, no data for key firm variables such as sales or number of employees, or very irregular exports coverage with respect to officially recorded exports. We have managed to extract data for three European Union countries: France, Hungary and Portugal. Data comprises firms operating from 2007 until 2012, in the manufacturing sector, thus classified by having primary activity labeled within NACE Rev. 2 codes 10 to 33.
Bureau van Dijk compiles a collection of firm ownership links on an international basis and tries to identify a global ultimate owner for each firm, by following firm
ownership upstream links that are above 51%. We classify firms as foreign if a global ultimate owner has been identified and is located in a different country than the country of operation of the firm. Information on the number of firm subsidiaries is also obtained, although no minimum ownership percentage between owner firm and subsidiary firm is required to validate the ownership link.
Both ownership and industry data are limited to the status at the date of data collection, although we do not expect it to be a significant source of error given the short span of years covered in the panel and the infrequent nature of changes in primary industry or the dimensions of ownership information we have used.
Our final sample includes a total of 28,366 firms from Portugal, Hungary and France. All countries belong to the EU27, and only Hungary does not belong to the Eurozone. As shown in Table 6a and Table 6b, most firms are from Portugal (19,410 firms), followed by France (6,133 firms) and Hungary (2,823); and most firms are domestic, with 771 firms being foreign and 360 of domestic firms having registered subsidiaries in other countries. Thus, data coverage of firm population differs
significantly across countries. Coverage is very good for Portugal, as data is compiled from administrative sources and almost all firms are legally mandated to file balance sheet data and most firms comply with this legal obligation. According to figures provided by Bureau van Dijk, only about 40% of Hungarian firms are legally mandated to file accounts, in accordance to their legal form, although companies do not generally comply with this obligation. For France, most limited liability companies are legally mandated to file accounts, although only about 65% of firms comply with this requirement. Firms seem to comply with the requirement intermittently, since the requirement of a balanced panel is particularly severe for French firms, and 82% of French observations in the several years of the panel firms are lost with this requirement.
We were not able to obtain data for all variables in all years of the panel, and for all countries equally, as data is obtained from different primary providers, and firms delivered data to original sources to conform to different national legal obligations. The most notable gap is that we do not have export data for Portugal in 2007.
17
worsen after 2009 relative to the years before the shock in 2009. Thus, firms outside the panel do not contribute proportionately more than firms in the panel for any growth in exports after the demand shock of 2009.
The large coverage of exports achieved with the sample, and the relatively low number of Hungarian firms, suggests that our panel of Hungarian firms is mostly comprised of large firms, or at least that we able capture most of the large exporters in our sample. The large size of Hungarian firms relative to Portuguese or French firms is confirmed in Table 7a and Table 7b. The average Hungarian firm employs more workers, has larger sales and total assets than the average firm in the other countries. Hungarian firms are also more likely to be exporters, export more of their output and operate in industries with higher final output exported. The average French firm is also larger than the average Portuguese firm, regardless of the size measure being number of employees, sales or total assets. The proportion of French firms that are exporters is slightly smaller than the proportion of Portuguese firms, and French firms operate in industries that export less, but the average French firm still exports more than the average Portuguese firm.
Thus, the sample seems to capture larger Hungarian firms, smaller French firms, and even smaller Portuguese firms. Most of the differences between these groups of firms are accounted by the difference in average firm size, as larger firms tend to employ more inputs, export more, have less debt, higher profits, and a higher likelihood of being foreign. For any of the countries in the sample, the distribution of firms by industry is not too uneven, with firms in almost all two-digit industries. The distributions of firms by industry are similar across countries, with all countries sharing the same two two-digit industries with the highest number of firms: manufacturing of metal products and manufacturing of food products (Table 7c).
The export supply function response at the intensive and the extensive margins are both important to examine. The decision of firms to enter foreign markets is an important export supply response to examine because firms are required to undergo important investments ahead of market entry, and thus corresponds to a deliberate and arduous effort by firms. As firms may not be able to export considerable volumes in an initial stage due to lack of international distribution network, the intensive margin
to describe how the stock of exporters changed for each of the countries in our panel and use logit regressions to test the hypothesis of firm entry due to poor performance of the domestic market.
Although the intensive margin is the most directly observable export supply function response, the main short run reason why firms may want to use foreign markets in response to poor performance in domestic markets is to substitute lost domestic sales due to unmet domestic demand with sales abroad. If firms are able to perform this substitution we must observe increased exports after we observe poor domestic market performance. We are going to detail how exports have responded after the large demand shock of 2009 in our sample panel and we are going to regress firm exports on a measure of domestic market performance, using fixed effects regressions, to evaluate firm export response at the extensive margin.
4. Results
Table 1 displays real GDP growth for all countries and years in the panel. Real GDP growth in any of the countries shares the common large drop in 2009 and
subsequent recovery in 2010, in line with the wider EU27 growth. All countries have growth close to zero in 2008, a substantial decline in growth in 2009, and a slight
recovery in 2010. While the recovery proceeds in 2011 for Hungary and France, Portugal enters a recession. In 2012, all countries worsen their growth position, with Portugal further deepening its recession, Hungary entering a recession, and France facing stagnation.
Table 1. Real GDP Growth (%) Year
2007 2008 2009 2010 2011 2012
EU27 3.2 0.4 -4.5 2.0 1.7 -0.4
Portugal 2.4 0.0 -2.9 1.9 -1.3 -3.2
Hungary 0.1 0.9 -6.8 1.1 1.6 -1.7
France 2.3 -0.1 -3.1 1.7 2.0 0.0
19
In order to measure domestic and European demand faced by individual firms, we have used added value real growth in the industry in which the firm is located, both at the domestic and EU27 level. These figures are provided by Eurostat, discriminated at the two-digit NACE industry (although some industries are lumped together). Table 8a and Table 8b provide average firm growth, median firm growth, and average firm growth, weighted by firm size (measured by number of employees), of the domestic and EU27 industry growth figures provided by Eurostat, for each country and year in the sample. There are some differences in how the manufacturing sector performs relative to the overall economy. The manufacturing sector experiences a much larger drop in activity than the overall economy in 2009; and the recovery in 2010 and 2011 is also larger than the overall economy, with the manufacturing sector still having positive growth in 2011 for Portugal, in spite of the contraction in the overall economy (Table 1). The EU27 growth figures are different but similar across countries in each year of the panel (Table 8b), as the distribution of firms by industry is also close across countries (Table 7c). In general, as occurs at the domestic level for each country, the manufacturing sector of the EU27 seems to be much more volatile than the overall economy (Table 1). There is a large decrease in activity in 2009 and a recovery in the years 2010 and 2011, as also occurs at the domestic level for each country.
In Table 9a we present aggregate exports in constant prices, obtained from Eurostat, and the respective yearly percentage change is presented in Table 9b. While in 2008 we observe small or negative exports growth in any country, in 2009 we observe a common large drop in exports. This drop in 2009 is in line with the international trade collapse of 2008-2009. This huge demand shock has two main causes. First, a sudden drop in commodity prices and the consequent reduction in demand of countries reliant on these goods; and second, on the decision by consumers, firms and investors alike to postpone all investment and purchasing decisions when faced with an extremely high level of uncertainty during the period (Baldwin, 2009). In agreement with the
growing exports. By 2011, only Portugal has managed to export more in real terms than in 2008. However, the much worse domestic market performance in Portugal in 2011 and 2012 relative to the other countries is accompanied by a relatively small advantage in exports growth in these two years relative to the other countries.
Table 10a and Table 10b are the sample counterparts of tables Table 9a and Table 9b. Differences between sample manufacturing exports and official exports records are expected as we have obtained a balanced panel of firms for the period, and the coverage across countries is irregular, with the sample from Portugal having a much larger number of small firms relative to any of the other two countries. Nevertheless, we still observe the same overall pattern for exports in the panel. For any country in our sample, we again observe the huge drop in exports in 2009 and the recovery in 2010 and 2011. Again, Portugal seems to recover much more quickly than the two other countries in the three subsequent years to the 2009 shock.
Table 10c details the number of exporters in every year of the panel, and Table 10d the respective yearly percentage growth in the number of exporters. Similarly to the behavior in aggregate exports, Portugal is the only country with large net gains in the number of exporters, with net gains of around 6% in both 2010 and 2011. Both France and Hungary register low yearly increases or decreases in the stock of exporting firms.
Table 11a to Table 11c compare mean real exports growth and growth in the number of exporters in each country with changes in real factor costs and real changes in domestic market sales. As can be observed for France and Portugal, there is no decrease in median labor cost per worker justifying the growth in exports or in the number of exporters, as the decrease in median labor costs seems to lag behind the increase in exports. There is a generalized decrease in material costs per million of sales across all countries, but only in 2009, and is always positive in subsequent years, where exports growth continues to occur. The drop in average domestic market sales seems to be more severe and more persistent than any changes in factor costs.
21
more than 1,000 firms both enter and exit export markets in every year, around 6% of total Portuguese firms in the panel. Only Hungary faces permanently low levels of both entry and exit from export markets, even when relative sample sizes are accounted for. Countries with lower average firm size have higher gross entry and exit rates from export markets, suggesting that small firms are responsible for most export supply function adjustments at the extensive margin. Only Portugal, the country with the lowest average firm size, registers substantial net entry rates after the demand shock of 2009. In 2010 and 2012 Portugal adds up more than 400 firms, or 2% of total firms in sample, to the stock of exporters. The increased net entry in export markets by Portuguese firms seems to be a response to the severe 2009 demand shock and not a response to the recession years of 2011 and 2012.
However, entrant exporters usually export a very small amount of overall exports in the entry year, in spite of the high gross entry rates for most years and countries. For Portugal, that has highest gross entry rates in any year, entrant exports are only a substantial part of overall exports in the year 2010, where we might observe rebound exports from delayed purchases in the year 2009. In all other years, entrant exports never surpass 3% of overall Portuguese exports. For our sample of French firms, the weight of entrant exports in overall exports is more erratic. Entrant exports are a substantial part of overall French exports in the years 2008 and 2009, but not in subsequent years, and thus entrant exports cannot account for the overall exports growth in response to the demand shock of 2009. Finally, for Hungary, the country with the largest average firm, entrant exports have almost no weight in overall country exports.
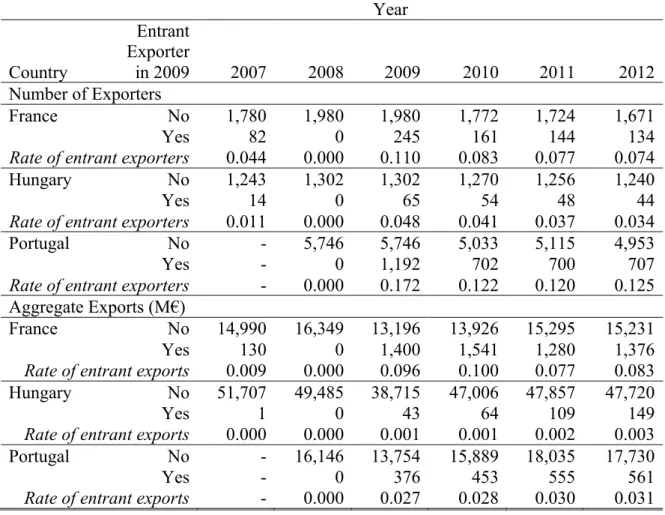
Table 12b to Table 12f detail the number of exporters and corresponding exports of each of the 2008 to 2012 cohorts of entrant and incumbent exporters, both at the time of entry as well as before and after entry, so that we can track new exporter survival after entry, past exporting experience of new exporters, and exports growth in the years after entry.
Entrant exporters are a substantial part of the number of exporting firms for any cohort, with samples with lower average firm size having higher rates of entrant
exporters. Entrant exporters represent 4 to 6% of exporters in the year of entry in Hungary, 11 to 14% of exporters in the year of entry in France, and 17 to 22% of
after the demand shock of 2009 for Portugal, and the single largest year over year increase in the rate of entrant exporters is recorded in Portugal in 2010, where entrant exporters are 22% of exporters in that year, following a rate of entrant exporters of 17% in 2009.
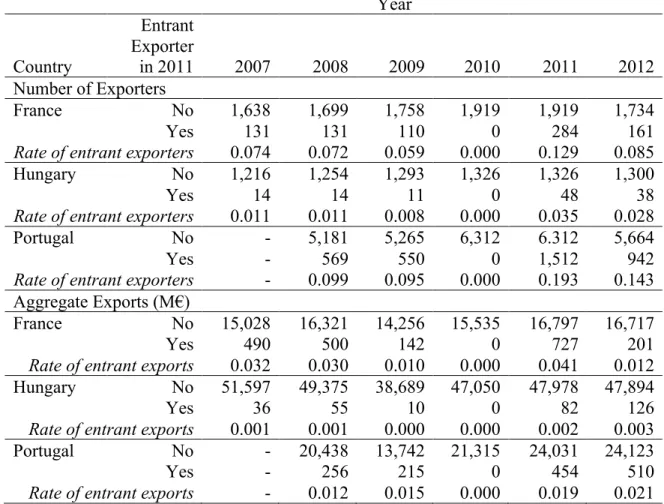
We find high survival rates of entrant exporters, with most failure to remain in export markets occurring in the year after entry. Of the 312 new French exporters in 2008, 148 remain in export markets in 2012, of the 74 new Hungarian exporters in 2008, 53 remain in export markets in 2012, and of the 1,192 new Portuguese exporters in 2009, 707 still remain in export markets in 2012. Out of any of the 2009 to 2012 cohorts of new exporters, many firms are also recurring exporters. For instance, out of the 2010 cohort of new exporters, 91 out of 259 new exporting French firms had been exporters in 2008, as well as 15 out of 50 Hungarian firms, or 582 out of 1,635 Portuguese firms. Thus, around one third of new exporters in 2010 had exported two years earlier. This behavior could be expected for new entrants in 2010 if many firms had failed to export in 2009 due to delayed purchases from their customers. However, for the cohort of new exporters in 2011, again around a third of new exporters are former exporters relative to 2009. Thus, for any cohort, new exporters are a substantial part of the pool of exporters, particularly in samples with small firms. Survival of entrant firms is high, particularly if the firm survived the second year in export markets, and export recurrence is also common.
If we track the exports associated with surviving exporting firms of any cohort of entrants, in the years after the entry year, we find that exports from cohorts of French firms remain relatively stable, although erratic, and that exports from cohorts of Portuguese and Hungarian firms increase steadily in any of the subsequent years, even though the group of entrants in any year is made smaller in the following years as some firms exit export markets.
23
have some compounded effect of entrants in a few consecutive years making up for a substantial amount of country exports in a given year, but entrant exports do not seem to be very cumulative as cohorts of entrant exporters seem to be substantially made up of firms that had already exported in the past.
Table 13a to Table 13c detail exporting behavior of firms that reenter export markets after one year of interruption. We can observe that about one fourth to one half of export market quitters in any given year and country seem to reenter in two years time. For instance, out of 1,237 Portuguese firms that ceased exporting in 2008, 582 have resumed exporting in 2010, and only 655 have not resumed exporting in 2010; however, 185 out of these 655 firms have also resumed exporting in 2011. Firms that reenter export markets two years after exit seem to resume exports at levels that are similar to those of the year of exit. In particular, the large value of entrant exports of 5,115M€ in Portugal in the year 2010 has a large contribution of 4,854M€ by firms that had already exported 4,749M€ in 2008, but did not export at all in 2009, which is in line with the importance of delayed purchases in the year 2009 in explaining export behavior during this period. Thus, although entrant firm survival in exports markets is high, much of firm entry and associated exports is also reentry in export markets, as many firms participate
intermittently in export markets, which goes against the possibility of cumulative entrant exports over a few years making up for a large contribution in overall country exports.
Table 14a to Table 14d show with greater detail the behavior of the entrant
exporters in any of the years of the panel. As shown before, entrant exporters tend to have worse survival prospects in the first year after entry and better survival prospects in subsequent years, and to grow exports steadily over the subsequent years of the panel. Both firm median exports and firm average exports tend to grow very quickly. In nearly every cohort of new exporters median domestic market growth is negative in the year of entry in export markets, with the sole exception being French entrant exporters in 2011, whose domestic market grew by 0.08%. Thus, either through firm reentry or not, export market entry is simultaneous with poor domestic market performance, which suggests that firms may be shifting sales from domestic to foreign markets at the year of export market entry, which in line with our hypothesis.
we seem to observe permanent increases in the stock of exporters after the demand shock of 2009, although only for Portugal which is the country with more small firms. Portugal also seems to have better export performance during the period. However, the better performance of exports is not due to entrant exports, as these have low importance in overall exports, with the exception of the year 2010 where they can justified with large amounts of rebound exports from the 2009 demand shock, and seem to take several years after initial entry trying to increase exports. Moreover, the low volumes of entrant
exporters do not behave significantly different from the exports of incumbent exporters for any cohort of entrants. Thus, substantial increases in exports due to poor domestic market performance must be reflected in incumbent exporter exports.
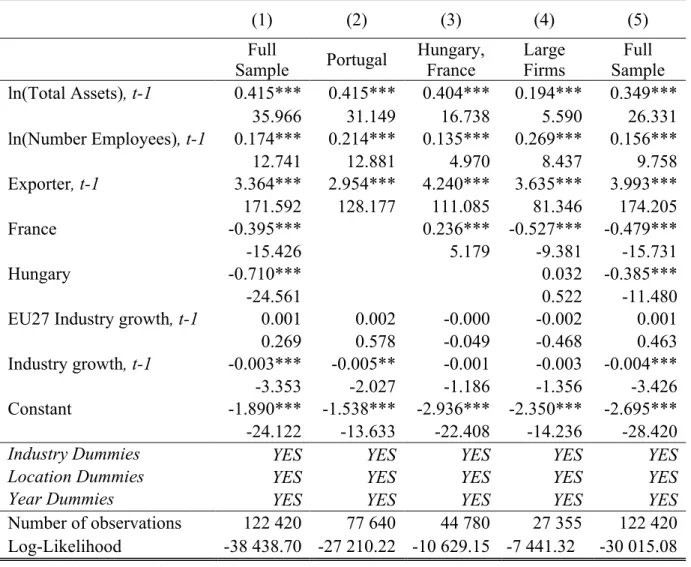
Table 2 presents the regression output from performing logit regressions of firm exporter status on domestic market performance in five different specifications. All specifications include lagged values of the logarithm of total assets in millions of euros and the logarithm of the number of employees to control for firm size. We include country dummies when more than one country is included in the sample to control for individual country effects, as well as sets of year and three-digit industry dummies to control for year and industry effects. Domestic market performance is measured with the added value real growth of the two-digit industry in which the firm is located, our
25
Table 2. Logit Regressions of Exporter Status Dependent Variable: Exporter Status, t
(1) (2) (3) (4) (5)
Full
Sample Portugal
Hungary, France
Large Firms
Full Sample ln(Total Assets), t-1 0.415*** 0.415*** 0.404*** 0.194*** 0.349***
35.966 31.149 16.738 5.590 26.331
ln(Number Employees), t-1 0.174*** 0.214*** 0.135*** 0.269*** 0.156***
12.741 12.881 4.970 8.437 9.758
Exporter, t-1 3.364*** 2.954*** 4.240*** 3.635*** 3.993*** 171.592 128.177 111.085 81.346 174.205
France -0.395*** 0.236*** -0.527*** -0.479***
-15.426 5.179 -9.381 -15.731
Hungary -0.710*** 0.032 -0.385***
-24.561 0.522 -11.480
EU27 Industry growth, t-1 0.001 0.002 -0.000 -0.002 0.001
0.269 0.578 -0.049 -0.468 0.463
Industry growth, t-1 -0.003*** -0.005** -0.001 -0.003 -0.004*** -3.353 -2.027 -1.186 -1.356 -3.426 Constant -1.890*** -1.538*** -2.936*** -2.350*** -2.695*** -24.122 -13.633 -22.408 -14.236 -28.420
Industry Dummies YES YES YES YES YES
Location Dummies YES YES YES YES YES
Year Dummies YES YES YES YES YES
Number of observations 122 420 77 640 44 780 27 355 122 420 Log-Likelihood -38 438.70 -27 210.22 -10 629.15 -7 441.32 -30 015.08 Note: *** p<0.01, ** p<0.05, * p<0.1, t-statistics in parenthesis
Specification (1) is run over the entire sample of firms in the panel. Both
coefficients of size related variables have the expected positive effect on the log odds of exporting. Exporter status in the previous year has the largest t-statistic of any predictor in this specification and thus is the best predictor for current exporter status. Growth in the wider European industry does not have a significant impact on the log odds of
real growth in the domestic two-digit industry would lead to an increase in the log odds ratio of becoming an exporter in the following year by 0.003.
Specifications (2) and (3) have the same functional form as the previous specification, but are run over a sample of Portuguese firms and a sample of pooled French and Hungarian firms, respectively. In the logit regression that is run over the sample of Portuguese firms we still have a significant negative effect of domestic industry added value real growth on the log odds of being an exporter in the following year, even after controlling for size related variables. However, the effect is no longer significant for the sample of pooled French and Hungarian firms, which have the largest average firms in the panel. These results are confirmed in specification (4), which is run over a sample of firms whose total assets exceed two millions of euros. Thus, the significance of the negative effect of domestic industry added value real growth disappears by either removing the country with the largest number of small firms from the sample, or by explicitly removing small firms from the sample. Specification (5) presents a simple robustness check in which we change the definition of exporting firms as those whose exports exceed 5% of total firm sales. With this more demanding
definition of what constitutes an exporter firm we expect the new group of exporters to be composed of firms that have made a more deliberate effort in becoming exporters. For specification (5), the coefficient on added value real growth in the domestic two-digit industry is still negative and significant at the 1% level, and even larger. Thus, we find evidence for firms entering exports markets in response to poor domestic market performance, but only when small firms are included in the sample.
Table 3 presents the output results from performing fixed effects regressions of the logarithm of exports on domestic market performance in five different specifications. We have used the fixed effects estimator in order to control for any possible time
invariant unobserved heterogeneity at the firm level. For the preferred specification (1), the test that all firm fixed effects are zero is rejected with p-value<0.0001, thus
27
include domestic and EU27 lagged value added real growth of the industry in which the firm is located to measure changes in domestic demand and international demand, respectively. We control for previous year exporting level by including the lagged value of exports in logarithm, and thus we only explain growth relative to the previous year export level of the firm. By including the logarithm of previous year exports and by having as the dependent variable the logarithm of current export level, our sample only has firms that were already exporters and that continue exporting.
Specification (1) is run over the full sample of continuing exporters. The coefficients of size related variables associated with total assets and number of
employees, are both positive and significant and thus both variables have the expected positive and significant impact on exports. The lag of the logarithm of exports also has the expected positive and significant impact on current exports. Also expected is the positive impact of EU27 growth in current exports, meaning that exports are largely determined by the EU27 economic cycle. Thus, although growth in the EU27 market is not sufficient to drive entry in exports markets, it determines how much existing
exporters will export. However, the coefficient of interest, which is associated with added value real growth in the domestic market, is not significant and very close to zero. Thus, we conclude that, although existing exporters increase exports when there is growth in international demand, they are not able to export more as a result of poor domestic market performance. Specifications (2) and (3) present the same regression as
specification (1) run over a sample of Portuguese continuing exporters and a sample of pooled French and Hungarian continuing exporting firms, respectively. The coefficient of interest, which is associated with domestic market performance, is insignificant and close to zero in either specification, thus confirming the results in specification (1).
belong to international networks of affiliates are able to place production abroad when domestic market performance is poor.
Table 3. Fixed Effects Regressions of Exports Dependent Variable: ln(Exports), t
(1) (2) (3) (4) (5)
Full
Sample Portugal
Hungary, France
Full Sample
Full Sample ln(Total Assets), t-1 0.369*** 0.378*** 0.346*** 0.369*** 0.369***
12.072 9.467 7.449 12.070 12.074
ln(Number Employees), t-1 0.240*** 0.255*** 0.210*** 0.239*** 0.239***
7.095 6.208 4.237 7.087 7.093
ln(Exports), t-1 0.073*** 0.032*** 0.136*** 0.073*** 0.073***
7.170 2.720 7.379 7.166 7.170
EU27 Industry growth, t-1 0.002*** 0.002* 0.003*** 0.002*** 0.002***
3.041 1.659 2.649 3.051 3.045
Industry growth, t-1 0.000 0.001 0.000 0.000 0.000
0.475 0.623 0.265 0.770 0.512
Ind. growth × Foreign, t-1
-0.001
-0.909
Ind. growth ×
Subsidiary Abroad, t-1 -0.001
-0.443
Constant -2.028*** -2.545*** -1.440*** -2.027*** -2.028***
-17.559 -19.702 -7.430 -17.537 -17.557
Number of observations 40 645 24 399 16 246 40 645 40 645 Log-Likelihood -36 216.98 -21 610.25 -14 533.74 -36 216.50 -36 216.92 Note: *** p<0.01, ** p<0.05, * p<0.1, t-statistics in parenthesis
Table 4 and Table 5 present regressions of exporter status and exports on
additional regressors. We checked that growth of labor cost per worker does not help us explain which firms respond to poor domestic market performance with entry or
29
negative coefficient for value added real growth at the domestic industry level, significant and positive coefficients for the size related variables and past exporter status, and an insignificant coefficient for value added real growth at the European industry level. Specification (1) also controls for the importance of fixed costs on the overall cost
structure of the firm, measured by the depreciation to added value ratio, which is included as a standalone term and as an interaction term with domestic industry growth. Firms with a higher depreciation to added value ratio are expected to have higher fixed rather than variable costs and thus, as mentioned earlier, are expected to respond more strongly to a negative shock in the domestic market. Thus, we would expect a negative coefficient for the latter interaction term, as firms with higher reliance on fixed costs should respond more strongly to decreases in the domestic market. However, both the standalone term for the depreciation to added value ratio and the interaction of this variable with domestic market growth are insignificant. Thus, we do not find evidence that firms with a cost structure that is more reliant on fixed costs respond more strongly to a negative domestic market shock with export market entry.
Specification (2) includes the same variables as specification (1) in Table 2, and has identical results with respect to the magnitude and significance of the coefficients in common with specification (1) in Table 2. Specification (2) has added controls for firm labor cost per worker growth. We have added yearly percentage point growth of firm labor cost per worker both as a standalone term and interacted with value added growth for the domestic industry in which the firm is located. We removed a few outliers where labor cost per worker grew more than 100% in a single years, the majority of which where firms who employed one or two workers. Coefficients for both terms are
Table 4. Logit Regressions of Exporter Status Dependent Variable: Exporter Status, t
(1) (2)
Full Sample Full Sample
ln(Total Assets), t-1 0.417*** 0.413***
27.781 34.139
ln(Number Employees), t-1 0.107*** 0.180***
6.060 12.326
Exporter, t-1 3.177*** 3.309***
139.811 162.864
France -0.436*** -0.398***
-13.835 -15.114
Hungary 0.419*** -0.719***
6.726 -23.855
EU27 Industry growth, t-1 -0.000 0.001
-0.097 0.379
Industry growth, t-1 -0.004* -0.003***
-1.809 -3.533
(Depreciation / Added Value), t-1 -0.135
-1.168 Industry Growth × (Depreciation / Added Value), t-1 0.008 0.639
Labor cost per worker growth / 100, t-1 0.032
0.625 Industry growth × Labor cost per worker growth / 100, t-1 -0.003 -0.767
Constant -1.594*** -1.895***
-15.984 -24.643
Industry Dummies YES YES
Location Dummies YES YES
Year Dummies YES YES
Number of observations 33 791 37 113
Log-Likelihood -29 204.08 -32 056.95
Note: *** p<0.01, ** p<0.05, * p<0.1, t-statistics in parenthesis
31
Specification (1) introduces a standalone term for the variable that measures reliance on fixed costs rather than variables costs, the depreciation to added value ratio, and an interaction term of this variable with domestic industry growth. Likewise, specification (2) includes a standalone term for the growth of labor costs per worker and an interaction of this variable with domestic market growth. The introduced terms are insignificant in both specifications. Thus we conclude that, neither higher reliance on fixed costs, nor larger decreases in labor costs per worker, result in existing exporters increasing exports in response to poor domestic market performance.
Table 5. Fixed Effects Regressions of Exports Dependent Variable: ln(Exports), t
(1) (2)
Full Sample Full Sample
ln(Total Assets), t-1 0.382*** 0.366***
11.174 10.947
ln(Number Employees), t-1 0.196*** 0.199***
6.419 5.026
ln(Exports), t-1 0.070*** 0.034***
6.044 3.171
EU27 Industry growth, t-1 0.003*** 0.002***
3.328 2.591
Industry growth, t-1 -0.000 0.000
-0.308 0.537
(Depreciation / Added Value, t-1 0.125
1.332 Industry growth × (Depreciation / Added Value), t-1 0.002 0.623
Labor cost per worker growth / 100, t-1 -0.015
-0.502 Industry Growth × Labor cost per worker growth / 100, t-1 0.001 0.498
Constant -1.882*** -2.065***
-17.589 -15.744
Number of observations 79 838 112 908
Log-Likelihood -27 836.65 -36 057.43
We find evidence of a modest positive impact of poor domestic market performance on the decision to become an exporter, although only for small firms. However, these firms do not initiate exports with high levels of exports, neither at the year of entry or in the years following entry, in spite of high growth rates for exports in the years following entry. We find evidence that incumbent exporters are able to increase exports in response to increases in international demand, but we do not find evidence of a significant relationship between poor domestic market performance and increases in exports, even for firms with established distribution networks that could be presumed to have higher access to international markets. We also do not find that either having an overall cost structure with a higher weight of fixed costs, or facing negative growth of labor cost per worker changes the response of firms to poor domestic market performance with export market entry or expansion.
5. Conclusion
33
Acknowledgments
References
Alvarez E. 2004. Sources of export success in small-and medium-sized enterprises: the impact of public programs. International Business Review 13: 383-400.
Baldwin R, Krugman P. 1989. Persistent trade effects of large exchange rate shocks. The Quarterly Journal of Economics 104: 635-654.
Baldwin R. 1986. Hysteresis in Trade. Mimeo, prepared for the 1986 NBER Summer Institute.
Baldwin R. 1988. Some empirical evidence on hysteresis in aggregate US import prices.
NBER Working Paper No. 2483.
Baldwin R. 2009. The great trade collapse: Causes, Consequences and Prospects. CEPR
Bernard AB, Jensen JB, Lawrence RZ. 1995. Exporters, jobs, and wages in US manufacturing: 1976-1987. Brookings Papers on Economic Activity. Microeconomics 1995: 67-119.
Bernard AB, Jensen JB. 2004. Why some firms export. Review of Economics and Statistics 86: 561-569.
Clerides SK, Lach S, Tybout JR. 1998. Is learning by exporting important? Micro-dynamic evidence from Colombia, Mexico, and Morocco. The Quarterly Journal of Economics 113: 903-947.
Dixit A. 1989. Hysteresis, import penetration, and exchange rate pass-through. The Quarterly Journal of Economics 104: 205-228.
Eichengreen B. 2007. The Breakup of the Euro Area. NBER Working Paper No. 13393. Grossman GM, Helpman E, Szeidl A. 2006. Optimal integration strategies for the
multinational firm. Journal of International Economics 70: 216-238. Hallward-Driemeier M, Iarossi G, Sokoloff KL. 2002. Exports and manufacturing
35
Hamermesh DS. 1988. Plant closings and the value of the firm. The Review of Economics and Statistics 70: 580-586.
Hirsch S, Lev B. 1971. Sales stabilization through export diversification. The Review of Economics and Statistics 53: 270-277.
Johanson J, Vahlne J. 1977. The internationalization process of the firm-a model of knowledge development and increasing foreign market commitments. Journal of International Business Studies 8: 23-32.
López RA. 2005. Trade and growth: Reconciling the macroeconomic and microeconomic evidence. Journal of Economic Surveys 19: 623-648.
Marin D. 1992. Is the export-led growth hypothesis valid for industrialized countries?.
The Review of Economics and Statistics 74: 678-688.
Melitz MJ. 2003. The impact of trade on intra-industry reallocations and aggregate industry productivity. Econometrica 71: 1695-1725.
Oviatt BM, McDougall PP. 2005. Defining international entrepreneurship and modeling the speed of internationalization. Entrepreneurship theory and practice 29: 537-554.
Roberts MJ, Tybout JR. 1997. The decision to export in Colombia: an empirical model of entry with sunk costs. The American Economic Review 87: 545-564.
Roberts MJ, Tybout JR. 1997. What makes exports boom? World Bank Publications
Wagner J. 2007. Exports and productivity: a survey of the evidence from firm-level data.
The World Economy 30: 60-82.
Wagner J. 2012. International trade and firm performance: a survey of empirical studies since 2006. Review of World Economics 148: 235-267.
Tables
Table 6a. Number of Firms by Country Country No.
France 6,133 Hungary 2,823 Portugal 19,410 Total 28,366
Table 6b. Number of Foreign Firms and Domestic Firms with Foreign Subsidiaries Foreign DFS Total
Country No. No. No.
France 386 101 6,133
Hungary 181 32 2,823
Portugal 204 227 19,410
Total 771 360 28,366
Table 6c. Share of Sample Exports in Overall Country Product Exports Year
2007 2008 2009 2010 2011 2012 France 0.036 0.039 0.041 0.039 0.040 0.039 Hungary 0.617 0.587 0.600 0.624 0.581 0.596 Portugal - 0.522 0.438 0.571 0.570 0.549
37
Table 7a. Firm Level Summary Statistics
(mean) France Hungary Portugal Total
Employees 36.5 137.2 22.7 37.1
Cost per Worker (k€) 44.0 12.3 13.3 19.8
Added Value per Worker (k€) 63.3 30.3 22.6 31.2 Number of Employees / Assets 17.2 32.4 41.8 35.5
Material Costs (M€) 4.3 28.1 1.9 3.9
Sales (M€) 9.1 23.6 3.0 6.4
Added Value (M€) 3.7 6.6 0.9 1.8
EBITDA (M€) 0.7 1.7 0.3 0.5
Exports (M€) 2.7 16.7 1.1 3.2
Exporters (%) 36.1 48.4 38.2 38.8
Exports / Sales (%) 7.4 24.2 12.0 12.3
2d Industry Exports / Sales (%) 19.6 57.3 30.8 31.0
Total Assets (M€) 7.0 18.5 2.9 5.3
Fixed Assets / Assets (%) 30.0 44.8 28.8 30.7
Long Term Debt / Assets (%) 9.7 2.7 16.1 13.4
Foreign firms (%) 6.3 6.4 1.1 2.7
Depreciation (M€) 0.3 1.1 0.2 0.2
Depreciation / Added Value 0.1 0.2 0.1 0.1
Table 7b. Firm Level Summary statistics
(median) France Hungary Portugal Total
Employees 8.0 40.0 8.0 9.0
Cost per Worker (k€) 40.2 10.0 11.6 13.3
Added Value per Worker (k€) 52.7 20.4 17.4 21.0
Number of Employees / Assets 12.7 20.0 22.6 19.4
Material Costs (M€) 0.2 4.1 0.1 0.2
Sales (M€) 0.8 2.6 0.3 0.5
Added Value (M€) 0.8 2.0 0.2 0.3
EBITDA (M€) 0.1 0.2 0.0 0.0
Exports (M€) 0.0 0.0 0.0 0.0
Exporters (%) 0.0 0.0 0.0 0.0
Exports / Sales (%) 0.0 0.0 0.0 0.0
2d Industry Exports / Sales (%) 18.5 57.8 30.5 29.7
Total Assets (M€) 0.5 2.0 0.3 0.4
Fixed Assets / Assets (%) 23.0 45.0 25.7 27.0
Long Term Debt / Assets (%) 2.9 0.0 1.9 1.0
Foreign firm (%) 0.0 0.0 0.0 0.0
Depreciation (M€) 0.0 0.2 0.0 0.0
Depreciation / Added Value 0.1 0.1 0.1 0.1
39
Table 7c. Distribution of Firms by Industry Country
NACE Rev. 2 – 2-digit France Hungary Portugal
No. % No. % No. %
10 - Man. of food products 1,381 23 309 11 2,711 14
11 - Man. of beverages 88 1 74 3 257 1
12 - Man. of tobacco products 0 0 5 0 3 0
13 - Man. of textiles 118 2 54 2 989 5
14 - Man. of wearing apparel 109 2 62 2 1,967 10
15 - Man. of leather 60 1 21 1 963 5
16 - Man. of products of wood and cork 295 5 93 3 1,328 7
17 - Man. of paper products 72 1 71 3 213 1
18 - Printing & reproduction of rec. media 388 6 71 3 991 5 19 - Man. of coke and ref. petroleum prod. 4 0 5 0 1 0 20 - Man. of chemicals and chemical prod. 142 2 80 3 300 2 21 - Man. of basic pharmaceutical prod. 25 0 21 1 55 0 22 - Man. of rubber and plastics products 228 4 287 10 560 3 23 - Man. other non-metallic mineral prod. 305 5 139 5 1,345 7
24 - Man. of basic metals 62 1 56 2 134 1
25 - Man. of fabricated metal products 942 15 627 22 3,621 19 26 - Man. of computer, electronic prod. 151 2 120 4 102 1
27 - Man. of electrical equipment 131 2 105 4 271 1
28 - Man. of machinery and equipment 313 5 285 10 666 3 29 - Man. of motor vehicles, trailers 117 2 106 4 242 1 30 - Man. of other transport equipment 30 0 20 1 75 0
31 - Man. of furniture 180 3 95 3 1,120 6
32 - Other manufacturing 296 5 54 2 665 3
33 - Repair & installation of machinery 696 11 63 2 831 4
Total 6,133 100 2,823 100 19,410 100
Table 8a. Domestic 2-digit Industry Growth Faced by Firms (%), as provided by Eurostat Year
Country 2007 2008 2009 2010 2011
Firm average Portugal 3.2 -1.6 -8.8 3.4 2.7
Median firm Portugal 2.9 -0.1 -9.0 3.1 2.6
Size weighted average Portugal 2.4 -2.0 -8.8 5.8 3.7
Firm average Hungary 7.8 3.5 -11.7 13.7 1.2
Median firm Hungary 9.3 3.0 -17.4 10.4 1.9
Size weighted Hungary 8.0 0.2 -15.4 16.1 6.7
Firm average France 2.1 -3.1 -7.2 2.1 2.4
Median firm France 1.8 -3.2 -6.1 1.4 3.6
Size weighted average France 2.3 -2.8 -8.6 4.2 2.1
Table 8b. EU27 2.digit Industry Growth Faced by Firms (%), as provided by Eurostat Year
Country 2007 2008 2009 2010 2011
Firm average Portugal 2.3 -2.9 -13.4 6.6 3.8
Median firm Portugal 1.6 -3.0 -14.8 4.9 3.5
Size weighted average Portugal 2.4 -3.0 -13.9 8.1 4.1
Firm average Hungary 3.7 -2.1 -15.1 9.9 4.8
Median firm Hungary 3.0 -1.1 -14.8 10.9 4.5
Size weighted average Hungary 5.0 -2.4 -15.3 13.1 5.6
Firm average France 3.2 -2.6 -11.6 7.0 3.7
Median firm France 1.7 -3.4 -11.3 4.6 3.2
41
Table 9a. Total Product Exports (constant prices, M€) Year
2007 2008 2009 2010 2011 2012
France 442,392 442,489 358,448 404,015 434,014 442,643 Hungary 83,892 84,323 64,616 75,508 82,775 80,612 Portugal 40,724 40,175 32,270 37,594 42,935 45,259
Source: Eurostat
Table 9b. Change in Total Product Exports (%) Year
2007 2008 2009 2010 2011 2012
France - 0.0 -19.0 12.7 7.4 2.0
Hungary - 0.5 -23.4 16.9 9.6 -2.6
Portugal - -1.3 -19.7 16.5 14.2 5.4
Sources: Eurostat
Table 10a. Sample Aggregate Exports (constant prices, M€) Year
Country 2007 2008 2009 2010 2011 2012
No. No. No. No. No. No.
France 15,852 17,095 14,596 15,743 17,523 17,149 Hungary 51,775 49,536 38,758 47,113 48,060 48,047 Portugal - 20,959 14,131 21,457 24,485 24,827
Table 10b. Change in Sample Aggregate Exports (%) Year
2007 2008 2009 2010 2011 2012
France - 7.84 -14.62 7.86 11.31 -2.13
Hungary - -4.32 -21.76 21.55 2.01 -0.03
Table 10c. Number of Exporting Firms Year
Country 2007 2008 2009 2010 2011 2012
No. No. No. No. No. No.
France 2,225 2,261 2,225 2,192 2,203 2,170 Hungary 1,334 1,354 1,367 1,374 1,374 1,390
Portugal - 6,983 6,938 7,370 7,824 7,934
Table 10d. Change in the Number of Exporting Firms (%) Year
Country 2007 2008 2009 2010 2011 2012
No. No. No. No. No. No.
France - 1.62 -1.59 -1.48 0.50 -1.50
Hungary - 1.50 0.96 0.51 0.00 1.16
43
Table 11a. Change of Selected Firm Variables by Year for Portuguese Firms (%) Year
2008 2009 2010 2011 2012
Firm Exports (mean) - -32.6 51.8 14.1 1.4
Domestic Sales (mean) - -4.8 -4.8 2.9 -3.1
Exporting Firms (0%) - -0.6 6.2 6.2 1.4
Exporting Firms (5%) - -1.0 6.8 10.6 4.8
Labor Productivity (median) 1.0 -1.9 0.7 -0.9 -2.7 Labor Cost per Worker (median) 1.9 1.4 2.6 0.2 -1.6 Material Costs/Sales (median) -0.7 -5.0 0.5 2.5 0.1
Table 11b. Change of Selected Firm Variables by year for French Firms (%) Year
2008 2009 2010 2011 2012
Firm Exports (mean) 7.8 -14.6 7.9 11.3 -2.1
Domestic Sales (mean) -4.6 -12.2 2.3 4.9 0.4
Exporting Firms (0%) 1.6 -1.6 -1.5 0.5 -1.5
Exporting Firms (5%) 1.5 -1.5 -0.1 0.3 -1.5
Labor Productivity (median) -1.6 -7.8 5.0 2.7 -0.7 Labor Cost per Worker (median) 1.1 -1.7 1.7 3.0 0.8 Material Costs/Sales (median) 1.1 -4.8 0.8 2.8 -0.2
Table 11c. Change of Selected Firms Variables by Year for Hungarian Firms (%) Year
2008 2009 2010 2011 2012
Firm Exports (mean) -4.3 -21.8 21.6 2.0 0.0
Domestic Sales (mean) -4.6 -18.5 -5.1 -3.5 1.8
Exporting Firms (0%) 1.5 1.0 0.5 0.0 1.2
Exporting Firms (5%) 2.7 0.9 1.3 1.5 1.5
Table 12a. Firm Entry and Exit from Export Markets and Entrant Aggregate Exports (M€)
Year
Country 2008 2009 2010 2011 2012
Number of firms (No.)
France Entry 312 245 259 284 275
Exit 276 281 292 273 308
Net entry 36 -36 -33 11 -33
Hungary Entry 74 65 50 48 52
Exit 54 52 43 48 36
Net entry 20 13 7 0 16
Portugal Entry - 1,192 1,635 1,512 1,328
Exit - 1,237 1,203 1,058 1,218
Net entry - -45 432 454 110
Number of firms, relative to country sample size (%)
France Entry 5.09 3.99 4.22 4.63 4.48
Exit 4.50 4.58 4.76 4.45 5.02
Net entry 0.59 -0.59 -0.54 0.18 -0.54
Hungary Entry 2.62 2.30 1.77 1.70 1.84
Exit 1.91 1.84 1.52 1.70 1.28
Net entry 0.71 0.46 0.25 0.00 0.57
Portugal Entry - 6.14 8.42 7.79 6.84
Exit - 6.37 6.20 5.45 6.28
Net entry - -0.23 2.23 2.34 0.57 Exports (M€)
France Entrant exports 1,550 1,400 276 727 232
Incumbent exports 15,545 13,196 15,467 16,797 16,918
Rate of entrant exports 0.091 0.096 0.018 0.041 0.014
Hungary Entrant exports 152 43 42 82 27
Incumbent exports 49,384 38,715 47,071 47,978 48,020
Rate of entrant exports 0.003 0.001 0.001 0.002 0.001
Portugal Entrant exports - 376 5,115 454 194
Incumbent exports - 13,754 16,342 24,031 24,634
45
Table 12b. Number of Exporters and Corresponding Exports of the 2008 Cohort of the Entrant and Incumbent Exporters
Year
Country
Entrant Exporter
in 2008 2007 2008 2009 2010 2011 2012
Number of Exporters
France No 1,949 1,949 1,780 1,696 1,672 1,632
Yes 0 312 200 167 158 148
Rate of entrant exporters 0.000 0.138 0.101 0.090 0.086 0.083
Hungary No 1,280 1,280 1,243 1,223 1,214 1,203
Yes 0 74 59 62 54 53
Rate of entrant exporters 0.000 0.055 0.045 0.048 0.043 0.042 Aggregate Exports (M€)
France No 15,647 15,545 12,059 12,713 14,540 14,090
Yes 0 1,550 1,137 1,404 1,605 1,464
Rate of entrant exports 0.000 0.091 0.086 0.099 0.099 0.094 Hungary No 51,750 49,384 38,545 46,849 47,675 47,520
Yes 0 152 170 173 207 269
Table 12c. Number of Exporters and Corresponding Exports of the 2009 Cohort of the Entrant and Incumbent Exporters
Year
Country
Entrant Exporter
in 2009 2007 2008 2009 2010 2011 2012
Number of Exporters
France No 1,780 1,980 1,980 1,772 1,724 1,671
Yes 82 0 245 161 144 134
Rate of entrant exporters 0.044 0.000 0.110 0.083 0.077 0.074
Hungary No 1,243 1,302 1,302 1,270 1,256 1,240
Yes 14 0 65 54 48 44
Rate of entrant exporters 0.011 0.000 0.048 0.041 0.037 0.034
Portugal No - 5,746 5,746 5,033 5,115 4,953
Yes - 0 1,192 702 700 707
Rate of entrant exporters - 0.000 0.172 0.122 0.120 0.125 Aggregate Exports (M€)
France No 14,990 16,349 13,196 13,926 15,295 15,231
Yes 130 0 1,400 1,541 1,280 1,376
Rate of entrant exports 0.009 0.000 0.096 0.100 0.077 0.083 Hungary No 51,707 49,485 38,715 47,006 47,857 47,720
Yes 1 0 43 64 109 149
Rate of entrant exports 0.000 0.000 0.001 0.001 0.002 0.003
Portugal No - 16,146 13,754 15,889 18,035 17,730
Yes - 0 376 453 555 561