1 A Work Project, presented as part of the requirements for the Award of a Masters Degree in
Management from the Faculdade de Economia da Universidade Nova de Lisboa.
Inventory Management for the Health Sector
ABC Analysis Approach
Joana Isabel Baptista Nabais
Nº 15000333
A project carried out on the strategy area, with the supervision of: Prof. Amílcar Arantes
2
Inventory Management for the Health Sector
ABC Analysis Approach
ACKNOWLEDGEMENTS
First of all, I would like to thank Professor Amílcar Arantes, for his availability and assistance during the whole semester. I would like to underline the especial importance of Dr. Pedro Lima who showed interest in supporting this work project. I am very grateful to Hospital Santa Maria for providing me the data. Moreover, a special thank to Dr. Vera for helping me with the English language. Finally, I would like to thank all my friends for their attendance and mostly my family, who has supported me all my life.
Abstract
This project aims to analyse a hospital’s inventory management and make suggestions
to improve its practices, with special attention on ABC analysis as an optimization tool for the inventory management, control and storage. Other cost reductions approaches are studied in order to contribute for the accurate management of clinical consumption materials. Wide efficient use of information and communication technology (ICT), using of periodic point model, warehouse’ layout modification, extension of stock centralization of advanced warehouses and consignment stock development, are the key proposals. These recommended ideas can be implemented in other hospitals, reducing waste and improving levels of quality in the health care services.
3
1. Purpose of the Project
The purpose of this project consists on the study of the hospital’s inventory management, which is integrated in its logistics system, since this area is extremely important for any industry. In spite of all the supply chain management being crucial for the healthcare industry, the management of clinical consumption materials has not been subjected to a wide research so far. However, since healthcare financial resources are increasingly limited, managers tend to find methods for operational improvements through the rationalization strategy, maintaining the care services required by the population and reducing costs. Within this context, it is vital to apply efficient management techniques in order to reach high levels of quality and productivity, reduce waste and costs, as well as increase the professional competences and satisfaction in a growth competitive environment.
Moreover, considering the importance that products supply has to the hospital’s budget, with a relative weight of 31% (Gaspar, 2008), which corresponds to the second larger parcel of the total costs, the supply chain management can highly affect the organization performance. Thus, the area of materials management can be a good field for analysis and intervention in the research of new solutions which can contribute to optimise the results. The right use of the available products as well as the management and costs control, without depreciating the quality of healthcare services, benefits the organization. Furthermore, the lack of these materials can create critical problems in the
hospital’s daily activity, having a negative impact in the quality of the health service
and customer satisfaction.
4 been studied, as well as the entire logistics activities in different hospitals. Despite some of these papers being related to the inventory management techniques, it is very important to study their adaptation to the reality of hospitals. Going through the hospital procedures we can find out current good practices, and possible successful systems to be implemented.
There are different techniques to improve inventory management and control like ABC analysis. As the range of products in hospital is so large, managers need to classify them in terms of spending value using ABC analysis approach in which each category leads to different inventory management and control process. ABC analysis based on inventory turnover is also useful for the adequate storage of materials in the warehouse. Besides ABC analysis, inventory management of hospitals can be optimized through the centralization of advanced stocks or/and vendor managed inventory.
5
2. Literature review
Before beginning the explanation about inventory management, it is important to define clearly some concepts. As stated in Ballou (2004), “supply chain management is the integration of all activities in association with the flow and transformation of goods from raw materials up to final user, as well as all the information flows, through improved supply chain relationships, in order to achieve a sustainable competitive
advantage.” “Inventories are stockpiles of raw materials, supplies, components, work in
6 Quoted by Lapierre and Ruiz (2005), there is one approach defending the coordination and scheduling of all logistics processes in order to have all the resources available without over inventory. Furthermore, although procurement and inventory management are non-value adding activities in hospitals (Aptel and Pourjalali, 2001); these activities are required since the nature and volume of items needed on a daily basis are difficult to predict (Jarrett, 1998). As the health care practitioners have been stung by breakdowns on distribution, they prepare these events by stockpiling supplies (Saccomano, 1996), due to the liability incurred by the death of a patient. So, the health care industry’s supply chain problems will not stop with poor inventory control, (Jarrett, 1998).
The inventory management is an area dealing with healthcare industry, since the inventory can represent an important asset for the organization. Nevertheless, due to the large range of products in hospital and the diversity and complexity of equipments and medical consuming materials, the supply function is a difficult task. It is hard to predict the exact demand for medicines, being one of the restrictions the non availability of accurate data on consumption. Besides, the lack of standard nomenclature for healthcare products, plus the preferences of clinicians create further uncertainties (Lauer, 2004, McKone-Sweet et al., 2005). Despite some emergency care and surgical procedures cannot be accurately projected, the materials used in the routine activities can be estimated based on average census and seasonal data (Jarrett, 1998).
7 materials management and control, depending on each healthcare organization. One of them is the inventory centralization of the advanced warehouses, which reduce the safety stocks with better forecasting. According to Brennan (1998), centralized logistics is a key towards enhancing healthcare supply chain operating efficiencies. Other inventory control system to be introduced into healthcare supply chain is the vendor managed inventory (VMI). The implementation of VMI leads to different results, defended by some (Kim, 2005) and criticised by others (Altricher and Caillet, 2004). Considering the inventory management, Heinbuch (1995) defends the transference of
Just in time (JIT) to hospitals, although some healthcare providers do not agree with,
due to the complex task of predicting the production capacity and scheduling. But, it is possible through the introduction of new flexible supported techniques, achieving significant cost reduction (Jarrett, 1998).
In addition, hospital materials management is one significant area in which technology transfer can be observed, and scale economies dramatically achieved (Heinbuch, 1995). Since the investments in new technologies increased in the last years in healthcare industry, it is important to understand the use of information and communication technologies (ICT) in managing hospital logistics (Pan and Pokharel, 2007), considering the different inventory management techniques mentioned above.
3. Hospital’s inventory management
8 approach, which is a supporting tool for the inventory investment control and the inventory storage. In this section they will also be referred other approaches for the inventory management and control that may contribute for its optimization. Each theme begins with a theoretical introduction, followed by an explanation of practices at Hospital and finalizes with some suggestions, explaining the costs and profits that the hospital can get with its implementation or development.
3.1. General inventory management
The organizations need to keep stocks in the warehouse due to several reasons, being the most known the quick demand satisfaction, to avoid stock outs, to minimize the forecast demand fluctuations, or get quantity discounts (Lisboa, 2006). In the case of hospitals, many materials are essential to keep the health quality or even the life of patients. On the other hand, the over stock affects the competitive power of organizations, through the impact on product costs. Thus, an efficient inventory management can balance several costs in association to it.
9 In addition, the clinical consumption materials are very heterogeneous, in volume, value, and number of suppliers; hence a specific inventory management for each group of items is necessary.
3.2. Inventory management levels
The inventory management is a dynamic activity and it can be evaluated in three different ways: material, administrative and economic.
Material management
The material management is responsible for inventory storage, particularly on its packaging, protection, and moving in warehouse.
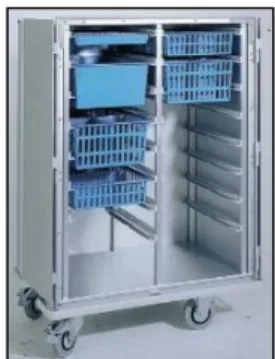
Regarding this point, the hospital has a central warehouse with around 700m2 (Figure 1), where it is executed the storage and the distribution of materials for the different using services. The materials storage is performed according to ABC analysis based on inventory turnover. The distribution of these materials from the central warehouse to the replacement areas as well as the advanced warehouses is the following. First, materials are picked – read the items barcode with a PDA – and put in the distribution cars (Figure 2). Then, these items go to the distribution room, where a distribution team
Suggestion 1
10 performs the rest of activity. In the case of specific using materials, the distribution is led by the nurses from each service.
Administrative management
The administrative management includes all the informatics system with information about inventory levels, such as its flows and control.
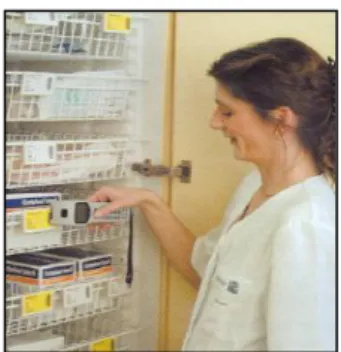
In administrative terms, the hospital introduced an information system for logistics management to control all the circuit of materials (through individual barcodes), from its reception up to its final consumption. An advanced warehouse system with informational consumption register was also implemented in the several services of hospital. In order to do that, the hospital had acquired software and hardware - PDAs (Figure 3) – a device which allows the record of all material flows.
To be more detailed, in the reception area, the operator receives the preview orders, making the according checking through shipping list. For some items, it is already possible to use PDAs, which reduce both time and mistakes during the checking. This device is also used in the picking of the materials during the delivering task. These materials are moved from central warehouse to the advanced warehouses by distribution cars carrying a paper with information about the destination service. Any item removed
11 from advanced warehouse is automatically introduced in the information system by PDA, reading its barcode inserted in the closets (Figure 4).
On what refer the materials used on the surgery block, their consumption is recorded online by touch-screen computers. In conclusion, this information system allows you to get to know the stock level of clinical consumption materials at real time.
Economic management
Within an economic management level, the manager takes decisions in order to minimize the costs and quickly satisfy the demand. These decisions are: when and how much stock should be ordered, under the information of inventory and forecast demand levels (Lisboa, 2006).
The inventory economic management regards the replenishment method for the clinical consumption materials of the central and advanced warehouses. For each item, either in central and advanced warehouses, it is defined the minimum and maximum stock level, by the inventory management team. These stock levels are established having as a base the demand pattern of each cost centre. The replenishment orders are automatically created by the information system according to reorder point model. When the stock level reaches a pre-defined quantity (the reorder point), a new order is made. This
Figure 4 – Modular closet of advanced warehouse. Source: HSM.
12 quantity is fixed and it should correspond approximately to the economic quantity order, minimizing the total inventory costs.
On the other hand, there are materials that are cross-stock; it means that due to its specific use, they are immediately distributed to the required service, after going through the central warehouse without stock creation. Their requirement is called a higher validation requisition, since these items are not included in the defined list of every cost centre. In this case, the requisition has to be approved by the department supervisor, followed by the logistic department approval, being finally ordered by the procurement department.
3.3. Inventory management standard models
In order to choose an inventory management policy, we need to analyse what its implications are at three points: warehouse space, investment level per order and the number of orders per year (Carvalho and Ramos, 2009). There are two standard models for inventory management, the reorder point model and the periodic review model.
Suggestion 2
13 In the first model, when inventory is depleted to the point where its level is equal to or less than a specific quantity called the reorder point, an economic order quantity is placed on the supplying source to replenish the inventory. Reorder point control requires constant monitoring of the inventory levels.
In the periodic review model, the reorder time is pre-defined, and its quantity corresponds to the difference between the current stock and the stock needed to the next period. So, under periodic review control, inventory levels for multiple items can be reviewed at the same time, being ordered together. Therefore, it reduces administrative costs, procurement costs, or/and prices. Even though, the reorder time should be accurately defined in order to avoid stock outs or excess of stocks, which are a usual limitation of this model.
Hospital Santa Maria only uses the reorder point model for clinical consumption materials. It means, when the stock level targets the reorder point, a new order is automatically required by the information system from central warehouse towards external suppliers. For the central warehouse, these stock levels can be changed over time, in opposite to the advanced stocks, which are usually reviewed once a year.
14
3.4. ABC analysis
Since there are several products in organizations, the ABC analysis ensures an appropriate investment application in the different inventory management and control systems (Lisboa, 2006). This approach is also useful as a support on inventory storage, providing a suitable layout of the central warehouse, and as a result making easier
materials’ flows and picking.
The ABC analysis classifies the items of the organization in three categories: A, B and C. It has been common to use these categories, although this situation is dependent on the decision of the manager. The A category includes the most important items, the B category corresponds to the intermediate relevant items, and the C category contains the
Suggestion 3
Using the accurate data concerning how much is spent in each service, it is possible to change the inventory levels of advanced warehouses more than once a year (when necessary). So, a better forecast for future needs could be done, which could be of great contribution to an efficient inventory investment. An informed change of reorder levels can reduce stock in advanced warehouses and consequently in the central warehouse. In each situation, the stock investment decreases, because stock centralising is cheaper than keeping it in every service. Although the hospital can do it through its IC system, it requires more control on stock levels by the inventory management team.
15 least ones. As ABC analysis serves to minimise the supplying costs, inventory items are usually labelled on the basis of spending value (spending quantity x acquisition price), although the manager may decide the use of others or more than one criteria. This decision depends on the role of ABC analysis and on the logistic activity developed by the organization.
This method is based on the Pareto law, or the 20x80 law, which means that, in empirical terms and on average, 20% of the used items accounts for 80% of the total spending value, belonging to category A; around 30% of the used items correspond to 15% of spending value and they are included in B category; and 50% of used items represents around 5% of spending value, being referred as C. Once the analysis is performed and the categories determined, the argument is that attention should be focus on the A category items to maximise inventory management efficiency.
In this section, they will be developed two ABC analyses based on two criteria: spending value and inventory turnover, for the clinical consumption materials of the
hospital’ central warehouse with data of the first semester of 2009. The first criteria is
usually developed in several industries, in order to get to know what are the most financial important items and consequently invest correctly in different inventory management and control models. It makes sense the use of the second criteria for the
inventory storage, because the materials’ location often depends on their turnover ratio.
16
3.4.1. ABC for inventory economic management
Considering the analysis based on spending value, the control and management methods for the categories should be different, because by concentrating the most management resources in A category items allows you to get significant outcomes than using indiscriminately the same resources by all categories. As the items of A category require high services, so the reorder point model should be adopted, since it means a tight control on stocks. Model parameters should be often reviewed, and the forecast of demand should be executed by applying sophisticated methods. As C items are financial less important, the periodic review model with large periodicity is appropriate for its management, specially because this model is less demanding in terms of ICT. However, for the same service level, the reorder point leads to lower stock levels. In the case of B items, both reorder point and periodic review models with narrow periodicity can be used.
As I referred before, the hospital only manages economically its inventory with the reorder point model. Hence, all categories use the same model, just by discriminating economic order quantities for each article.
17
3.4.2. ABC for inventory storage
The ABC analysis can define the location of the materials in the central warehouse, in the advanced warehouses and in their shelves. In the healthcare industry, as the materials are relatively homogeneous in weight and volume, the most appropriate criteria is the inventory turnover.
Knowing that all clinical consumption materials are on average 15 days in central
Suggestion 4
Implementation of the periodic review model for C category items, where low financial goods are included. This model can result in slightly inventory increase, but it can get to some delivery, transportation or buying economies savings. By ordering several items at the same time to the same supplier, the hospital reduces administrative and procurement costs, gets lower prices, a better prediction of distribution schedules resulting in a less number of workers and time savings, a quick identification of unusual demand and more concern in inventory control activities.
However, the hospital follows the reorder point model, which is supported by its IC system with precise control over each item. In spite of this model spends more resources for having a major attention to the stock levels, the hospital overcomes it through the vendor managed inventory.
18 warehouse, the ABC classification based on inventory turnover is replaced by other criteria, the spending quantity. In this way, the materials are labelled considering the quantity stored and moved in warehouse. Examining this classification in Appendix 7.3., around 80% of spending quantity consists in 3.5% of items, it means that these
materials are extremely important for the hospital’ current activity. On the other hand,
the majority of materials are less consumed, in which 20% of volume corresponds to 96.5% of items.
Concerning the warehouse inventory investment, the A category items require a large investment in relation to B and C items. Although the turnover ratio is high and equal for all items, the procurement, management, control and storage politics should have taken in consideration different spending value and spending quantity of warehouse inventory.
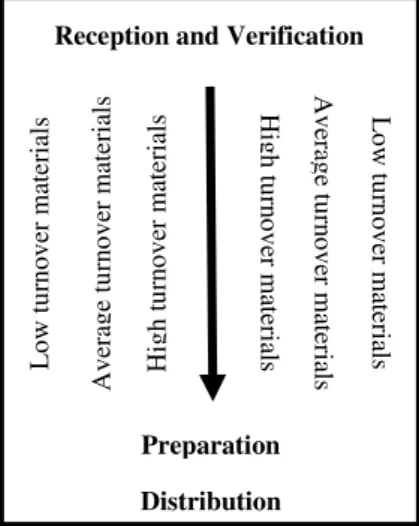
The storage of the area should follow the principle of distance minimization. Thus, the items with high turnover ratio should be stored in accessible areas and near picking and/or entrance and exit areas. The low turnover ratio materials are farther of picking and/or entrance and exit areas, because they create less flows. The following Figure 5
demonstrates how should a warehouse layout with direction flow at straight-line be, specifying the different materials storage areas based on inventory turnover.
Figure 5 – Example of a straight-line warehouse layout.
Lo w t u rn o v er m ateria ls Av era g e tu rn o v er m ateria ls Lo w t u rn o v er m ateria ls Av era g e tu rn o v er m ateria ls Hig h t u rn o v er m ateria ls Hig h tu rn o v er m ateria ls
Reception and Verification
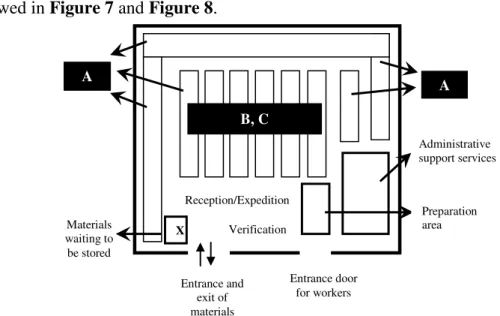
19 The layout depends on the dimension and structure of the warehouse, being of great use having two different areas for materials entrance and exit, especially in the case of high flow levels. The hospital has a warehouse of 700m2, considered to be of small/medium dimension, where entrance and exit areas are the same (Figure 6).
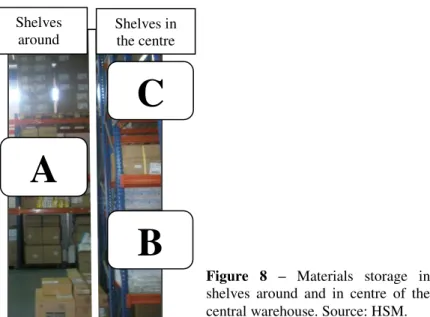
The storage on the shelves should follow the same criteria, which is the rotation of the materials. Hence, the materials with high rotation are located in the most accessible part of the shelf, “at the eyes level”, those with lower rotation are above, and those with average rotation at the bottom. Regarding the hospital’s materials labelling based on inventory turnover, they are allocated in the central warehouse and its shelves as followed in Figure 7 and Figure 8.
Figure 7 – Materials storage of central warehouse by ABC analysis.
Administrative support services
Reception and
Expedition Preparation area
Entrance door for workers Entrance and exit
of materials Materials waiting
to be stored X Verification
Figure 6 –Layout of hospital’s central warehouse.
Administrative support services
Reception/Expedition
Preparation area
Entrance door for workers Entrance and
exit of materials Materials
waiting to be stored
X Verification
A
B, C
20 The A category items are along the side walls of the warehouse, where the corridors are wider, making picking easier. In relation to B and C items, they are in the shelves located in the centre of the warehouse, with tighter corridors. The B category items are located in lower layer and the C in higher layer of the central shelves. In the shelves, the materials are stored rationalizing all the space in height. All the categories are relatively near from entrance and exit areas, as a consequence of the small dimension of the warehouse.
After the distribution to the service units, the materials are stored again in the closets. It should be also based on ABC analysis, placing the goods by using index. The storing logic on a shelf is the same as the height storing logic. Hospital Santa Maria displays the materials in a practical and logical way of the user point of view, trying to join items within the same type.
Suggestion 5
Attention should be paid to the 41 items of great volume in relation to the procurement and storage functions, where costs reduction can be achieved through quantity discounts, good relationships with suppliers and creating a specific area in
Figure 8 – Materials storage in shelves around and in centre of the central warehouse. Source: HSM. Shelves in
the centre Shelves
around
C
21 the central warehouse.
Separate the reception and expedition areas of the central warehouse in order to
facilitate the material’s flow. One solution would be to replace the entrance door on
the right side in the expedition area, which would require investing in layout modification.
Enlargement of the area for materials to be stored; hence it avoids the damages from outside, particularly in days of many materials receptions (Figure 9).
Figure 9 – Materials waiting outside central warehouse. Source: HSM.
In spite of the small dimension of the central warehouse, the location of A category items could be closer to reception and expedition areas with the storage of those in the three first central shelves of left side at “the eyes level”. It would increase the speed of picking for high turnover materials. The only inconvenient is the fact that the corridors among central shelves are tight, creating some difficulties concerning the distribution process. Besides, the materials of shelves around the warehouse (that belong to A category) are located too much above or below, not providing flexible functions.
22
3.5. Other inventory management and control approaches
Theoretically, there are other approaches that make the inventory management easier, at the same time, reducing the capital invested. The implementation of those is supported by some healthcare managers, depending on the specific hospital strategy for the inventory management and control function.
Hospital Santa Maria has developed its intervention in two areas: inventory centralization and consignment stock. Both areas have contributed for its inventory management and control, but they require some matching on the hospital’s supply chain, which can affect suppliers’ relationships. Therefore, this section will explain the advantages, implementation and development in Hospital Santa Maria.
3.5.1. Inventory centralization of advanced warehouses
Typically, in the healthcare organizations there are advanced warehouses of clinical consumption materials for each utilization service. It increases the investment level for inventory, because it is reinstalled by a number of services.
The share of the same advanced warehouse by a set of services located at the same floor or even all the services located on that floor, can reduce the safety stock and improve the spending quantity’ forecasting ability. It is harder analysing the individual spending of each service, which is more irregular than the aggregated spending, as it reflects a trend or some seasonal pattern. Using the review point model for the replenishment of materials for a centralized stock can also reduce the inventory turnover.
23 relation to the number of units existing in that service. That has created operational advantages in the picking, distribution and stock out level. Moreover, services located at the same floor and near each other can be the target of stock centralization.
3.5.2. Consignment stock/Vendor managed inventory (VMI)
The consignment stock consists to “stock held by one party (the “dealer”) but legally
owned by another (the “manufacturer”) in terms that give the dealer the right to sell the stock in the normal course of his business, or, as an alternative, returning it unsold to the legal owner” Business Dictionary, 2009. This innovative approach to inventory is specially used for the most expensive and technological items and it should be a consistent and controlled system over all supply chain network.
As an integrated approach, the vendor managed inventory requires that the supplier decides on the appropriate inventory levels of each product and on the inventory
policies to maintain these levels. Thus, the suppliers monitor the buyer’s inventory level
Suggestion 6
Increasing the number of centralized advanced warehouses of the same service or of a set of services located near each other. In order to choose these services, the
hospital needs to observe the warehouse’ place, dimension and store materials,
accounting its benefits like inventory reduction, better demand forecasts and control processes, as well as the inconvenient. Due to centralization, the advanced warehouses would be a bit farther of the customers, rising the response time. It could also require changes in the distribution cars and advanced warehouses.
24 (Waller et al, 1999), and as consequence an accurate information exchange between suppliers and customers has a fundamental role to successfully implement the VMI. In order to achieve significant reductions in data transfer times and entry mistakes, companies adopt tools such as electronic data interchange (EDI) or internet (Lancioni et al, 2000). The EDI is suitable to high volume of information exchanged, otherwise it is very expensive. Instead of these tools, the necessary information and communication can be provided via fax or spreadsheets (Holmstrom, 1998). With detailed information about articles in consignment stock (register of customer, register date, nº of dispositive series, dispositive reference and expiry date) can solve any product recall situation. Regarding to its approach, the hospital can benefit of several advantages (Table 1).
On the other hand, there are implementation problems due to different goals among supply network members, the need to involve them in an incentive system without opportunistic situations and the reluctance to share confidential information.
Hospital Santa Maria implemented this system in August 2008, by reducing its inventory costs. However, the supply chain was affected, since the stock costs were driven by the suppliers. With consignment stock, the suppliers need to readjust its
Advantages
Capital As the consignment stock is owned by the supplier until the moment it is spent, the
stock cost is zero for the hospital.
Availability The hospital can increase the availability of these materials, since the raise of stock in
order to avoid stock out risks, do not generate any cost.
Obsolescence The obsolescence risk is also totally transferred to the supplier, who replaces the
product by other when it is necessary.
Price
The hospital pays the market price dealt at the spending moment, which is usually lower than the price established at the moment the product is stocked. The prices tend to decrease, due to technological competition concerning this kind of products.
25 inventory and not just selling. The more adapt to its approach, the more efficient the supply chain performance is.
5. Conclusion
This study tries to give a contribution in order to understand inventory management systems in Hospital Santa Maria, improve them, and adapt different techniques provided by theoretical research. Hospital Santa Maria has invested in this area, since the supply function corresponds to an important parcel of total costs, and unlike other industries, inventory means saving patients lives. With competition increasing costs, the hospitals have to look at some functions that should be banished, adapted, adjusted or made efficient.
Suggestion 7
Keep the consignment stock approach with adjustments of all supply network members otherwise suppliers do not support anymore high holding inventory costs from customers. Extension of VMI both upstream and downstream in the supply network in order to coordinate the materials and information flows among members. This extension can relieve the costs submitted to hospital’ suppliers.
Push other existing suppliers to negotiate under consignment stock, in particular for high value products with low rotation. It is only successful if either the hospital or the supplier, share information, enhancing strong relationships. A performance monitoring can be developed, improving the connection among members.
26 Some approaches will always be a support for the inventory management and control as the ABC analysis case shows. As the acquisition costs and the number of items changed every year, ABC analysis has to be drawn yearly. The differentiation among items in financial terms allows the hospital to canalise appropriately its efforts in each category. Both criteria for ABC analysis building (spending value and inventory turnover) are considered extremely relevant to reach correct inventory management and storage models.
Our study also reveals the development of two processes by the hospital: inventory centralization of advanced warehouses and consignment stock. The hospital must evaluate its current distribution and advanced warehouse stored functions, and centralise the inventory of some integrated services. With the aim of inventory reduction, it must be achieved through the vendor managed inventory practices with broader ramifications. Increasing the capacities of suppliers in recognising the needs of hospitals, alliances based on trust, efficiency and efficacy could be formed with supplier to implement or adjust VMI. Thus, it requires information share between hospital and suppliers. In the future, the hospital can involve its other suppliers in its consignment stock programme, particularly for the most valuable items. Of course that the cooperation and integration levels among supply network members is recommended to successful adjustments. This supply chain management initiative should involve the adoption of a performance monitoring system in order to stimulate commitment of supply chain members.
27 All these approaches tend to decrease inventory costs, but they should always concern the customer service level, evaluating the inventory investment in relation to the service provided.
An optimal management of the inventory would allow important savings in the health care sector. When the best approaches are used, the managers reduce the costs of care without reducing the level of the service offered to the population. Identifying and implementing some techniques that come from other industries is fundamental to their ability in order to pursuit cost-effective and efficient operations yield.
That is why a focused study on inventory management can provide a benchmark for hospitals in order to optimize this function. Taking a lead from this study, further researches can be conducted to focus on other items of logistic such as procurement, warehouses layout and distribution systems, or any other specific ones, like, forecasting and inventory management evaluation indicators.
Finally, as a result of this project, some suggestions were made:
1. Reduction of references’ and suppliers’ number;
2. Efficient use of ICT in material’s reception function;
3. Inventory levels review of advanced warehouses by information system;
4. Use periodic review model for C category items;
5. Layout modification;
6. Extension of stock centralization;
28
6. References
Ballou, R.H. 1998. Business Logistics Management: Planning, Organizing, and
Controlling the Supply Chain. 4th ed. New Jersey: Prentice Hall, Inc.
Ballou, R.H. 2004. Business Logistics/Supply Chain Management. 5th ed. New Jersey: Pearson Education, Inc.
Camacho, Ana Mafalda. 2009. “Logistics in the Health Sector.” Work Project of Master. Faculdade de Economia da Universidade Nova de Lisboa.
Carvalho, José Crespo de, Ramos, Tânia. 2009. Logística na Saúde. Lisboa: Edições Sílabo.
Carvalho, Nélia. 2008. “Logística na Saúde - Circuito de Distribuição Interno.” Relatório de Estágio Profissionalizante. Licenciatura em Gestão em Saúde, Universidade Atlântica.
Danese, Pamela. 2006. “The extended VMI for coordinating the whole supply
network.” Journal of Manufacturing Technology Management, Vol. 17 No. 7, pp. 888-907.
Gonçalves, Júlio Ribeiro. 2001. “Sistemas e métodos de distribuição de produtos de
consumo clínico hospitalar.” XXIX Curso de Administração Hospitalar. Escola
Nacional de Saúde Pública.
Heinbuch, S.E. 1995. “A case of successful technology transfer to health care – Total quality materials management and just-in-time.” Journal of Management inMedicine,
Vol. 9 No. 2, pp.48-56
Jarrett, P.G. 1998. “Logistics in the health care industry.” International Journal of
29
Jarrett, P.G. 2006. “An analysis of international health care logistics: the benefits and
implications of implementing just-in-time systems in the health care industry.”
Leadership in Health Services, Vol. 19 No 1, pp. i-x.
Kumar, A. et al.2008. “Supply chain redesign in the healthcare industry of Singapore.”
Supply Chain Management: An International Journal, 13/2 pp. 95-103
Lapierre, S.D., Ruiz, A.B. 2005. “Scheduling logistics activities to improve hospital
supply systems.”Computers and Operations Research, Vol. 34, pp. 624-41
Lisboa, J., Gomes, C. 2006. Gestão de Operações. Porto: Vida Económica.
Mendes, Ana Maria Sequeira.1980. “Contributo para a implementação de técnicas de
gestão no hospital distrital de Braga”. IX Curso de Administração Hospitalar. Escola Nacional de Saúde Pública.
Mustaffa, N.H., Potter, A.2009. “Healthcare supply chain management in Malaysia: a
case study.” Supply Chain Management: An International Journal, Vol. 14 No. 3, pp. 234-243.
Pan, Z.X., Pokharel, S. 2007. “Logistics in hospitals: a case study of some Singapore
hospitals.” Leadership in Health Services, Vol. 20 No. 3, pp. 195-207.
Web-sites:
Hospital Santa Maria, 2009. IFE. http://www.ife.pt/po/logitrans/pdf/doc2008/8 _HelenaGaspar_HSM.pdf (accessed July 20th, 2009)
Hospital Santa Maria, 2009. Ministério da Saúde. http://www.hsm.min-saude.pt (accessed September 1st, 2009)
Hospital Santa Maria, 2009. Hospital do futuro. http://www.hospitaldofuturo.com/ imagens/PedroLimaApresentaçao.pdf(accessed September 15th, 2009)
30
7. Appendixes
7.1. General description of Hospital Santa Maria
Hospital Santa Maria, before called “Hospital Escolar de Lisboa” started its activity in 1954. Since then and during 50 years of activity, the hospital has been consolidated as an health care services institution, professionals’ formation and scientific investigation. Since 1st March 2008, due to the health main policies regarding the effective relation among different health units as well as the supposed complementarities between Hospital Santa Maria and Hospital Pulido Valente, the Centro Hospitalar Lisboa Norte (CHLN), E.P.E. has been created. This union is much easier for hospitals management, taking in consideration the maximizing of their resources, costs reduction and productivity and efficiency increased. The CHLN is very important for Portuguese health system with integrated functions of health care services, pre and after-graduation, and continuous formation and innovation and investigation.
Besides the direct support in the influence area, HSM is a major reference in multiple areas of national and regional context. During the year 2008 the number of inpatients was something like 6,000,000, with 32,000 surgeries and 790,000 consults which make all together an enormous shifting population of users in CHLN.
Over the years, the hospital has suffered modifications in its structure as well as organization, improving its service level with the complexity and overspecialisation regarding its services.
7.2. General description of the logistic service
31 management of clinical consumption, administrative and hotelier materials in Centro
Hospitalar Lisboa Norte. Considering both hospitals, there are 2 central warehouses and
311 replenishment areas, and 38 employees working in the logistic activity.
The main goal of this service is to available all the instruments at right time and right quantity in order to support the medical services. Their competences are:
- Forecasting management;
- Implementation of inventory management methods;
- Implementation of inventory register and control methods in warehouses; - Inform and order the acquisition of products to the procurement service; - Warehouse management.
The logistic area has suffered some changes, building a new central warehouse, introducing new hardware and software, a new distribution circuit as well as a new reposition method.
7.3. ABC analysis
The hospital deals with several materials, in which the clinical consumption materials correspond to the major percentage of spending (Graphic 1).
91% 4%
3% 2% 0%
% of spending materials
Clinical consumption material Hotelier
Administrative
Facilities and equipment services Food
32 As the number of clinical consumption materials in central warehouse was too many to be showed, the table expresses some of them to represent the ABC analysis principle. This information is provided from the 1st semester, 2009, about the spending quantity, average price and spending value.
Code Item
No. Unit
Spending quantity (6 months)
Average price
Spending value (quantity x average price)
231701002 1 Unit 59,338 2.57 € 304,773.30 €
231701001 2 Unit 265,015 0.45 € 239,910.40 €
240501013 3 Unit 40,530 2.17 € 175,958.02 €
230505025 250 Unit 5,747 1.06 € 12,192.06 €
231004015 251 Unit 404 15.07 € 12,187.44 €
230538002 252 Unit 10,611 0.57 € 12,156.73 €
299999032 253 Unit 103 58.87 € 12,151.15 €
230807006 255 Unit 1,486 3.97 € 11,802.94 €
220201022 624 Unit 11 108.48 € 2,343.08 €
290630004 625 Unit 13,772 0.08 € 2,307.12 €
230807001 626 Unit 356 3.22 € 2,295.61 €
231104003 627 Unit 636 1.80 € 2,293.70 €
220103117 700 Box 283 2.81 € 1,585.90 €
230809023 701 Unit 135 5.80 € 1,566.78 €
231901022 800 Unit 147 3.36 € 988.22 €
211199003 801 Unit 6,987 0.07 € 985.61 €
240202003 802 Roll 408 1.20 € 980.10 €
211001010 1249 Unit 6 0.09 € 1.02 €
TOTAL 1249 - - - 12,650,836.84 €
33
ABC analysis based on spending value:
This analysis was developed in the following stages, representing on the table below:
1st stage: Representation of yearly spending value in a decreasing order;
2nd stage: Calculation of cumulative percentages – spending value and number of
items;
3rd stage: Definition of the categories boundaries:
A class: 20% of nº of items corresponds to 79.9% of spending value;
B class: 30% of nº of items corresponds to 16.7% of spending value;
C class: 50% of nº of items corresponds to 3.4% of spending value.
Item
No. Code
Spending value (yearly)
Spending value
(%)
Cumulative spending value
Cumulative spending value (%)
Cumulative
item (%) Category
1 231701002 304,773.30 € 2.41% 304,773.30 € 2.41% 0.0801% A
2 231701001 239,910.40 € 1.90% 544,683.70 € 4.31% 0.1601% A
3 240501013 175,958.02 € 1.39% 720,641.72 € 5.70% 0.2402% A
250 230505025 12,192.06 € 0.10% 10,109,314.76 € 79.91% 20.0160% A
251 231004015 12,187.44 € 0.10% 10,121,502.20 € 80.01% 20.0961% B
252 230538002 12,156.73 € 0.10% 10,133,658.93 € 80.11% 20.1761% B
253 299999032 12,151.15 € 0.10% 10,145,810.08 € 80.21% 20.2562% B
255 230807006 11,802.94 € 0.09% 10,169,764.17 € 80.39% 20.4163% B
624 220201022 2,343.08 € 0.02% 12,224,680.57 € 96.63% 49.9600% B
625 290630004 2,307.12 € 0.02% 12,226,987.69 € 96.65% 50.0400% C
626 230807001 2,295.61 € 0.02% 12,229,283.30 € 96.67% 50.1201% C
627 231104003 2,293.70 € 0.02% 12,231,577.00 € 96.69% 50.2002% C
700 220103117 1,585.90 € 0.01% 12,372,152.99 € 97.80% 56.0448% C
701 230809023 1,566.78 € 0.01% 12,373,719.77 € 97.81% 56.1249% C
800 231901022 988.22 € 0.01% 12,498,971.99 € 98.80% 64.0512% C
801 211199003 985.61 € 0.01% 12,499,957.60 € 98.81% 64.1313% C
802 240202003 980.10 € 0.01% 12,500,937.70 € 98.82% 64.2214% C
34 The representation of the curve:
ABC analysis based on inventory turnover:
As the turnover ratio is 24 for all items, which correspond to 15 days in stock yearly, this analysis can be performed having as base the spending quantity or the average inventory stored and moved in warehouse.
Following the same stages of the previous ABC analysis, the categories boundaries are: A class: 3.3% of nº of items corresponds to 80% of spending quantity;
B class: 36.7% of nº of items corresponds to 19.5% of spending quantity; C class: 60% of nº of items corresponds to 0.5% of spending quantity.
Item
No. Code
Spending quantity (yearly)
Spending quantity
(%)
Cumulative spending
quantity
Cumulative spending
quantity (%)
Cumulative
item (%) Category
1 290402004 5,246.674 9.48000% 5,246.674 9.48% 0.08% A
2 290402003 4,752.154 8.59000% 9,998.828 18.07% 0.16% A
3 210403002 4,667.539 8.44000% 14,666.367 26.51% 0.24% A
41 290402006 201.263 0.36000% 44,282.783 80.03% 3.28% A
42 250613001 188.469 0.34000% 44,471.252 80.37% 3.36% B
43 290320001 179.533 0.32000% 44,650.785 80.69% 3.44% B
44 250301001 176.520 0.32000% 44,827.305 81.01% 3.52% B
Cumulative % of number of items Cumulative %
of spending value
A B C
20% 50% 100%
35
45 251003001 173.465 0.31000% 45,000.770 81.32% 3.60% B
500 250216008 1704.000 0.00308% 55,047.057 99.48% 40.03% B
501 231902003 1693.000 0.00306% 55,048.750 99.49% 40.11% C
502 250830003 1642.000 0.00297% 55,050.392 99.49% 40.19% C
503 230502001 1634.000 0.00295% 55,052.026 99.49% 40.27% C
700 290630009 575.000 0.00104% 55,244.681 99.84% 56.04% C
701 291635005 574.000 0.00104% 55,245.255 99.84% 56.12% C
800 230201013 313.000 0.00057% 55,289.299 99.92% 64.05% C
801 240402002 310.000 0.00056% 55,289.609 99.92% 64.13% C
802 230201019 308.000 0.00055% 55,289.917 99.92% 64.21% C
1249 250216010 1.000 0.00000% 55,333.366 100.00% 100.00% C
The ABC curve based on spending quantity:
Warehouse inventory investment:
Regarding the ABC analysis based on spending value and the turnover ratio ( 24), the expected investment in the warehouse inventory is around 527,118 € in 2009 for clinical consumption materials.
A
Cumulative % of number of items Cumulative %
of spending quantity
B C
3.3% 40% 100%
80% 99.5%
36
Code Item
No.
Cumulative item (%)
Cumulative
spending value Spending value
Turnover ratio Average inventory (€) 231701002 231701001 240501013 ... 230505025 1 2 3 ... 250 0.0801% 0.1601% 0.2402% ... 20.0160%
304,773.30 € 544,683.70 € 720,641.72 € ... 10,109,314.76 €
304,773.30 € 239,910.40 € 175,958.02 € ... 12,192.06 €
24 24 24 ... 24
10,109,314.76 € 421,221 €
231004015 230538002 299999032 230807006 .... 220201022 251 252 253 255 ... 624 20.0961% 20.1761% 20.2562% 20.4163% .... 49.9600%
10,121,502.20 € 10,133,658.93 € 10,145,810.08 € 10,169,764.17 € .... 12,224,680.57 €
12,187.44 € 12,156.73 € 12,151.15 € 11,802.94 € ... 2,343.08 €
24 24 24 24 .... 24
2,115,365.81 € 88,140 €
290630004 230807001 231104003 220103117 230809023 231901022 211199003 240202003 ... 211001010 625 626 627 700 701 800 801 802 ... 1249 50.0400% 50.1201% 50.2002% 56.0448% 56.1249% 64.0512% 64.1313% 64.2214% ... 100.0000%
12,226,987.69 € 12,229,283.30 € 12,231,577.00 € 12,372,152.99 € 12,373,719.77 € 12,498,971.99 € 12,499,957.60 € 12,500,937.70 € ... 12,650,836.84 €
2,307.12 € 2,295.61 € 2,293.70 € 1,585.90 € 1,566.78 € 988.22 € 985.61 € 980.10 € ... 1.02 €
24 24 24 24 24 24 24 24 ... 24
426,156.27 € 17,757 €
TOTAL 12,650,836.84 € 527,118 €
Limitations of ABC analysis:
- Submitted only clinical consumption materials; - Different units of measure;
- Forecasting data for the 2nd semester of 2009;
- Without specific information about inventory turnover for different items.
A
B