Annexes
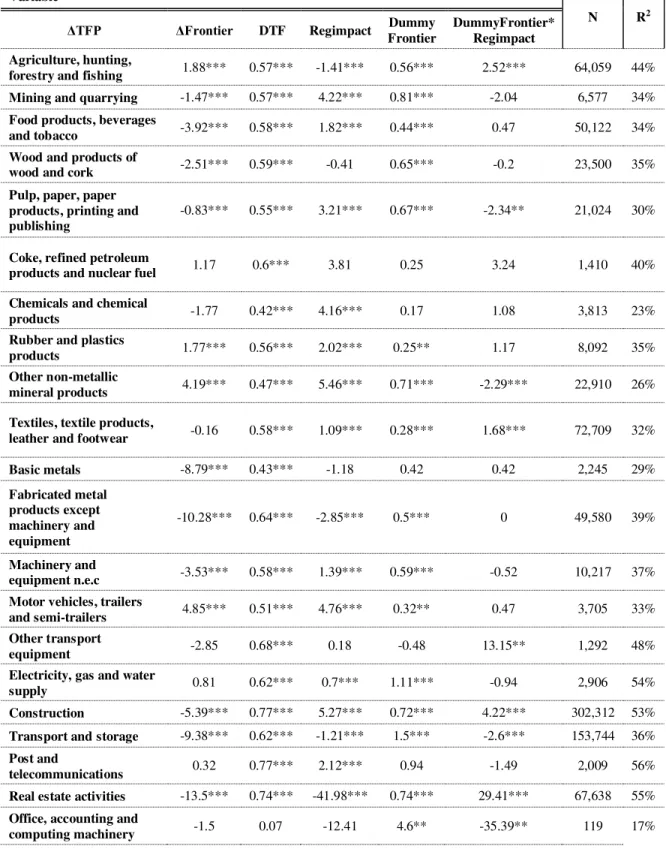
Table A1 - The Impact of Product Market Reforms By sector with interaction (wide Regimpact) Variable
N R2
ΔTFP ΔFrontier DTF Regimpact Dummy
Frontier
DummyFrontier* Regimpact
Agriculture, hunting,
forestry and fishing 1.88*** 0.57*** -1.41*** 0.56*** 2.52*** 64,059 44% Mining and quarrying -1.47*** 0.57*** 4.22*** 0.81*** -2.04 6,577 34% Food products, beverages
and tobacco -3.92*** 0.58*** 1.82*** 0.44*** 0.47 50,122 34% Wood and products of
wood and cork -2.51*** 0.59*** -0.41 0.65*** -0.2 23,500 35% Pulp, paper, paper
products, printing and publishing
-0.83*** 0.55*** 3.21*** 0.67*** -2.34** 21,024 30%
Coke, refined petroleum
products and nuclear fuel 1.17 0.6*** 3.81 0.25 3.24 1,410 40% Chemicals and chemical
products -1.77 0.42*** 4.16*** 0.17 1.08 3,813 23%
Rubber and plastics
products 1.77*** 0.56*** 2.02*** 0.25** 1.17 8,092 35%
Other non-metallic
mineral products 4.19*** 0.47*** 5.46*** 0.71*** -2.29*** 22,910 26% Textiles, textile products,
leather and footwear -0.16 0.58*** 1.09*** 0.28*** 1.68*** 72,709 32%
Basic metals -8.79*** 0.43*** -1.18 0.42 0.42 2,245 29%
Fabricated metal products except machinery and equipment
-10.28*** 0.64*** -2.85*** 0.5*** 0 49,580 39%
Machinery and
equipment n.e.c -3.53*** 0.58*** 1.39*** 0.59*** -0.52 10,217 37% Motor vehicles, trailers
and semi-trailers 4.85*** 0.51*** 4.76*** 0.32** 0.47 3,705 33% Other transport
equipment -2.85 0.68*** 0.18 -0.48 13.15** 1,292 48%
Electricity, gas and water
supply 0.81 0.62*** 0.7*** 1.11*** -0.94 2,906 54%
Construction -5.39*** 0.77*** 5.27*** 0.72*** 4.22*** 302,312 53% Transport and storage -9.38*** 0.62*** -1.21*** 1.5*** -2.6*** 153,744 36% Post and
telecommunications 0.32 0.77*** 2.12*** 0.94 -1.49 2,009 56% Real estate activities -13.5*** 0.74*** -41.98*** 0.74*** 29.41*** 67,638 55% Office, accounting and
Electrical machinery and
apparatus n.e.c -0.16 0.65*** 1.13 0.54 0.13 2,542 45%
Radio, television and communication equipment
1.22 0.51*** -9.83 0.4 2.35 198 37%
Medical, precision and
optical instruments 0 0.69*** 0.01 0.56 -0.61*** 6,677 47% Manufacturing n.e.c;
recycling -5.7*** 0.62*** 2.87*** 0.66*** -0.59 21,758 39% Wholesale and retail
trade, repairs -8.07*** 0.51*** 0.06*** 0.54*** 0.17*** 429,587 33% Hotels and restaurants -3.8*** 0.59*** -3.81*** 0.78*** -2.99*** 217,696 39% Renting of machinery and
equipment -1.46*** 0.58*** 13.84*** 0.06 0.06 1,633 38%
Computer and related
activities -0.71* 0.68*** 4.49*** 0.63*** 0.3 30,667 46%
Other Business Activities 11.75*** 0.65*** -10.5*** -0.3*** 2.14*** 95,321 42% Research and
Development 10.49 0.61*** 68.67 2.7*** -31.28** 1,770 48%
Legend: * p<.1; ** p<.05; *** p<.01
Source: Author’s own computations using IES and OECD data for the years 2004-2014. Table A2 - The Impact of Product Market Reforms - By sector without interaction (LP)
Variable
N R2
ΔLP ΔFrontier DTF Regimpact
Agriculture, hunting, forestry and fishing -78.09 0.49* -6.34** 73,894 40%
Mining and quarrying -7.72* 0.49* 5.61*** 7,031 31%
Food products, beverages and tobacco 29.38* 0.49* 0.67* 52,599 36%
Wood and products of wood and cork -23.99* 0.48* -4.62* 24,574 30%
Pulp, paper, paper products, printing and publishing 17.9* 0.45* 6.9* 22,276 28%
Coke, refined petroleum products and nuclear fuel 487.26* 0.4* 41.31* 1,534 34%
Chemicals and chemical products 9.57*** 0.4*** 1.60 4,042 28%
Rubber and plastics products 6.55*** 0.45*** 1.24** 8,443 30%
Other non-metallic mineral products 6.99*** 0.46*** 2.95*** 23,760 25%
Basic metals 21.47*** 0.29*** 0.21 2,338 27%
Fabricated metal products except machinery and
equipment 36.81*** 0.58*** -0.91** 50,918 34%
Machinery and equipment n.e.c 12.57** 0.47*** 1.84** 10,685 28%
Motor vehicles, trailers and semi-trailers 41.37*** 0.52*** -1.05 3,834 33%
Other transport equipment -0.03 0.62*** 8.73** 1,347 39%
Electricity, gas and water supply -1.75 0.34*** 1.54*** 4,948 44%
Construction -23.03*** 0.58*** 0.99** 326,518 39%
Transport and storage 20.64*** 0.41*** -0.96*** 164,517 28%
Post and telecommunications omitted 0.62*** -1.41 2,152 55%
Real estate activities 18.23*** 0.56*** -5.91 106,335 43%
Office, accounting and computing machinery -15.95 0.31** -83.11 131 24%
Electrical machinery and apparatus n.e.c -1.08 0.55*** -4.2*** 2,680 39%
Radio, television and communication equipment -12.21 0.46*** 39.11 209 41%
Medical, precision and optical instruments -10.34*** 0.56*** -2.90 7,051 41%
Manufacturing n.e.c; recycling 51.99*** 0.47*** 5.28*** 22,918 32%
Wholesale and retail trade, repairs 66.18*** 0.42*** -0.66*** 465,573 31%
Hotels and restaurants -77.65*** 0.62*** -3.89*** 231,121 38%
Renting of machinery and equipment 35.91*** 0.48*** -30.59*** 2,059 37%
Computer and related activities 7.93*** 0.55*** 0.57 35,986 40%
Other Business Activities 29.55*** 0.5*** 0.06 107,250 36%
Research and Development 3.74 0.53*** 3.27 2,295 42%
Legend: * p<.1; ** p<.05; *** p<.01
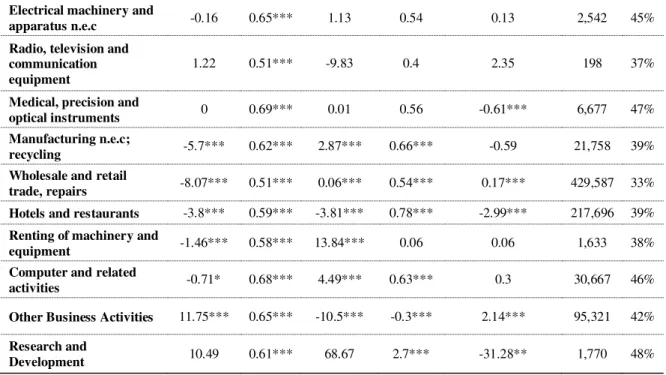
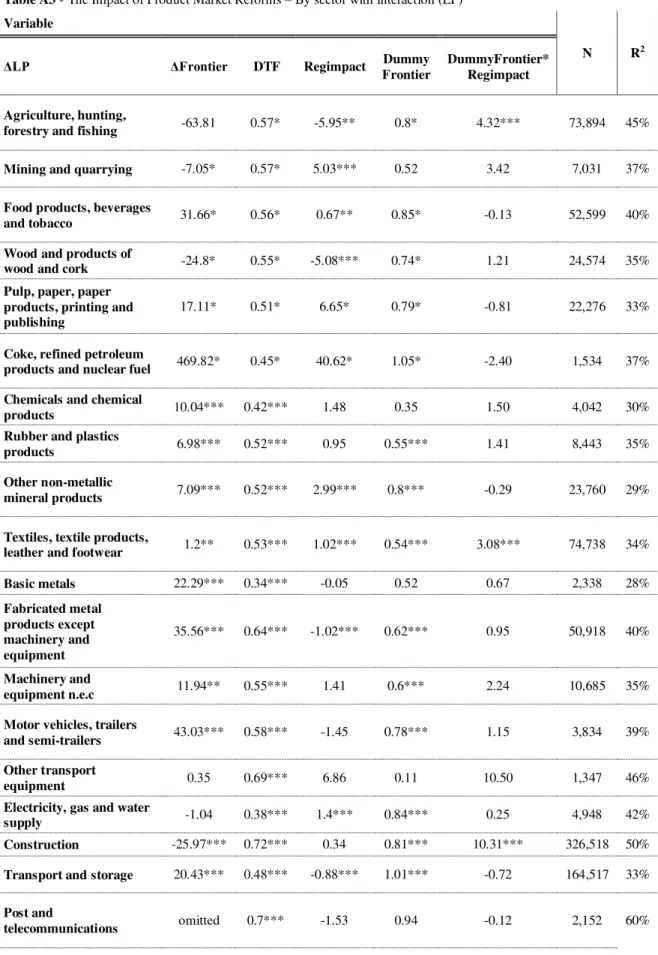
Table A3 - The Impact of Product Market Reforms – By sector with interaction (LP) Variable
N R2
ΔLP ΔFrontier DTF Regimpact Dummy
Frontier
DummyFrontier* Regimpact
Agriculture, hunting,
forestry and fishing -63.81 0.57* -5.95** 0.8* 4.32*** 73,894 45%
Mining and quarrying -7.05* 0.57* 5.03*** 0.52 3.42 7,031 37%
Food products, beverages
and tobacco 31.66* 0.56* 0.67** 0.85* -0.13 52,599 40%
Wood and products of
wood and cork -24.8* 0.55* -5.08*** 0.74* 1.21 24,574 35%
Pulp, paper, paper products, printing and publishing
17.11* 0.51* 6.65* 0.79* -0.81 22,276 33%
Coke, refined petroleum
products and nuclear fuel 469.82* 0.45* 40.62* 1.05* -2.40 1,534 37% Chemicals and chemical
products 10.04*** 0.42*** 1.48 0.35 1.50 4,042 30%
Rubber and plastics
products 6.98*** 0.52*** 0.95 0.55*** 1.41 8,443 35%
Other non-metallic
mineral products 7.09*** 0.52*** 2.99*** 0.8*** -0.29 23,760 29%
Textiles, textile products,
leather and footwear 1.2** 0.53*** 1.02*** 0.54*** 3.08*** 74,738 34%
Basic metals 22.29*** 0.34*** -0.05 0.52 0.67 2,338 28%
Fabricated metal products except machinery and equipment
35.56*** 0.64*** -1.02*** 0.62*** 0.95 50,918 40%
Machinery and
equipment n.e.c 11.94** 0.55*** 1.41 0.6*** 2.24 10,685 35% Motor vehicles, trailers
and semi-trailers 43.03*** 0.58*** -1.45 0.78*** 1.15 3,834 39% Other transport
equipment 0.35 0.69*** 6.86 0.11 10.50 1,347 46%
Electricity, gas and water
supply -1.04 0.38*** 1.4*** 0.84*** 0.25 4,948 42%
Construction -25.97*** 0.72*** 0.34 0.81*** 10.31*** 326,518 50% Transport and storage 20.43*** 0.48*** -0.88*** 1.01*** -0.72 164,517 33%
Post and
Real estate activities 15.64*** 0.65*** -9.8*** 1.33*** 22.94*** 106,335 51%
Office, accounting and
computing machinery -19.37 0.36*** -96.17 6.54 -45.54 131 27%
Electrical machinery and
apparatus n.e.c -0.92 0.62*** -4.5*** 0.32 4.60 2,680 43%
Radio, television and communication equipment
-12.99 0.47*** 37.46 -6.19 54.98 209 42%
Medical, precision and
optical instruments -9.59*** 0.63*** -2.59 0.88*** 0.88 7,051 46% Manufacturing n.e.c;
recycling 54.25*** 0.55*** 5.33*** 0.75*** 1.04 22,918 38% Wholesale and retail
trade, repairs 64.21*** 0.47*** -0.68*** 0.64*** 0.29*** 465,573 35%
Hotels and restaurants -75.75*** 0.67*** -3.76*** 0.72*** -0.21 231,121 44%
Renting of machinery and
equipment 34.6*** 0.54*** -31.4*** -0.22 14.92** 2,059 40% Computer and related
activities 8.71*** 0.61*** -0.25 0.55*** 5.35*** 35,986 46% Other Business Activities 27.38*** 0.58*** 0.01 0.59*** 0.7** 107,250 42% Research and
Development 4.19 0.6*** 3.07 1.52 -4.87 2,295 48%
Legend: * p<.1; ** p<.05; *** p<.01
Source: Author’s own computations using IES and OECD data for the years 2004-2014. Table A4 - The Impact of Product Market Reforms - By sector without interaction (narrow Regimpact) Variable
N R2
ΔTFP ΔFrontier DTF Regimpact
Agriculture, hunting, forestry and fishing -0.51 0.52*** -4.11*** 64,059 41%
Mining and quarrying -0.17 0.52*** 5.82*** 6,577 29%
Food products, beverages and tobacco -0.09 0.53*** 2.98*** 50,122 36%
Wood and products of wood and cork -2.42*** 0.54*** omitted 23,500 29%
Pulp, paper, paper products, printing and publishing 1.12*** 0.5*** 8.63*** 21,024 26%
Coke, refined petroleum products and nuclear fuel 4.23*** 0.59*** -4.56 1,410 37%
Chemicals and chemical products 1.6** 0.4*** 4.55*** 3,813 21%
Other non-metallic mineral products 0.94** 0.43*** 3.44*** 22,910 22%
Textiles, textile products, leather and footwear 0.44*** 0.53*** 2.89*** 72,709 26%
Basic metals 14.20 0.39*** 15.59 2,245 28%
Fabricated metal products except machinery and
equipment 5.6*** 0.59*** 8.36*** 49,580 32%
Machinery and equipment n.e.c -1.53* 0.52*** 3.3*** 10,217 29%
Motor vehicles, trailers and semi-trailers 0.89 0.48*** 8.06*** 3,705 29%
Other transport equipment -0.95 0.62*** 3.64 1,292 43%
Electricity, gas and water supply 0.65 0.57*** 0.52 2,906 51%
Construction -0.94*** 0.74*** 5.33*** 302,312 42%
Transport and storage 4.69** 0.55*** 0.55*** 153,744 27%
Post and telecommunications 0.91** 0.72*** 3.27*** 2,009 50%
Real estate activities 5.59*** 0.69*** 4.84*** 67,638 45%
Office, accounting and computing machinery 0.97 0.06 2.64 119 13%
Electrical machinery and apparatus n.e.c 2.58 0.6*** 11.61 2,542 40%
Radio, television and communication equipment 6.13 0.42*** 8.35 198 35%
Medical, precision and optical instruments -0.06 0.64*** 0 6,677 40%
Manufacturing n.e.c; recycling -0.33 0.56*** 5.54*** 21,758 32%
Wholesale and retail trade; repairs -4.76*** 0.46*** 3.58*** 429,587 29%
Hotels and restaurants 4.19*** 0.55*** 18.21*** 217,696 34%
Renting of machinery and equipment -0.01 0.53*** 33.49*** 1,633 34%
Computer and related activities 0.94*** 0.63*** 6.7*** 30,667 40%
Other Business Activities -0.07 0.59*** 11.76*** 95,321 34%
Research and Development 1.44 0.58*** 13.28 1,770 41%
Legend: * p<.1; ** p<.05; *** p<.01
Source: Author’s own computations using IES and OECD data for the years 2004-2014.
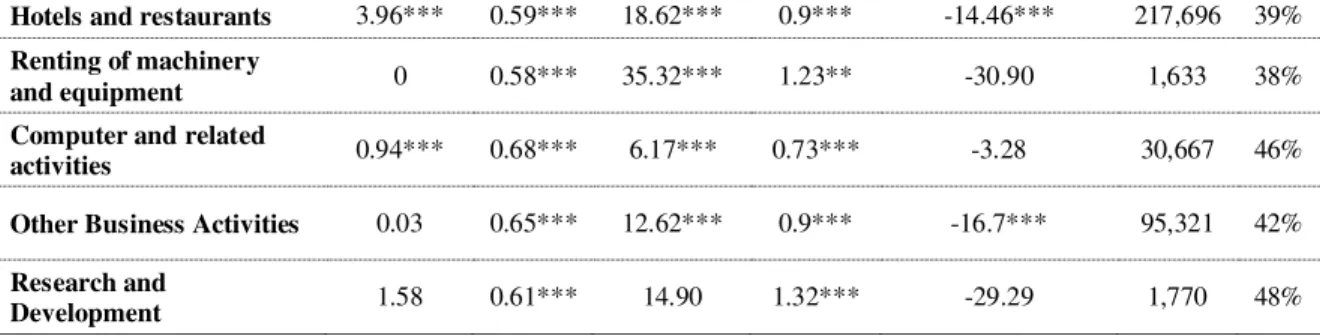
Table A5 - The Impact of Product Market Reforms - By sector with interaction (narrow Regimpact) Variable
N R2
ΔTFP ΔFrontier DTF Regimpact Dummy
Frontier
DummyFrontier* Regimpact
Agriculture, hunting,
Mining and quarrying -0.21 0.57* 6.35* 1* -6.69*** 6,577 35% Food products, beverages
and tobacco 0.02 0.58* 3.18* 0.56* -1.87 50,122 40%
Wood and products of
wood and cork -2.11*** 0.59* omitted 0.85* -5.62** 23,500 35% Pulp, paper, paper
products, printing and publishing
1.04* 0.55* 9.24* 9.24* -10.57*** 21,024 31%
Coke, refined petroleum
products and nuclear fuel 4.91* 0.6* -8.79* 0.19 6.99 1,410 40% Chemicals and chemical
products 1.51** 0.42*** 5.1*** 0.55*** -4.88 3,813 23%
Rubber and plastics
products 0 0.56*** 4.21*** 0.25*** 3.36 8,092 35%
Other non-metallic
mineral products 0.98** 0.47*** 3.7*** 0.69*** -3.79*** 22,910 26% Textiles, textile products,
leather and footwear 0.47*** 0.58*** 2.78*** 0.57*** -3.96*** 72,709 32% Basic metals 13.73 0.44*** 15.46 0.8*** -7.32*** 2,245 29% Fabricated metal
products except machinery and equipment
5.47*** 0.64*** 7.98*** 0.64*** -3.47*** 49,580 39%
Machinery and
equipment n.e.c -1.65** 0.58*** 3.87*** 0.91*** -10.56*** 10,217 37% Motor vehicles, trailers
and semi-trailers 1.01 0.51*** 8.69*** 0.72*** -8.95*** 3,705 33% Other transport
equipment -0.52 0.69*** 2.90 0.71*** -3.06 1,292 48%
Electricity, gas and water
supply 0.95 0.62*** 0.73*** 1.05*** -0.87 2,906 54%
Construction -0.88*** 0.77*** 5.41*** 1.05*** 0 302,312 53% Transport and storage 5*** 0.62*** 8.18*** 1.91*** -4.11*** 153,744 36% Post and
telecommunications 0.78** 0.77*** 2.77*** 0.88 -1.49 2,009 56% Real estate activities 6.04*** 0.74*** 54.1*** 1.44*** 10.54 67,638 55% Office, accounting and
computing machinery 1.02 0.07 5.11 1.43 -38.25 119 15%
Electrical machinery and
apparatus n.e.c 2.12 0.65*** 11.70 1.09*** -11.70 2,542 45% Radio, television and
communication equipment
6.15 0.52*** 6.01 -0.61 30.99 198 38%
Medical, precision and
optical instruments -0.10 0.69*** -0.28 0.49*** 0.10 6,677 47% Manufacturing n.e.c;
recycling -0.28 0.62*** 6.19*** 0.87*** -6.97*** 21,758 39% Wholesale and retail
Hotels and restaurants 3.96*** 0.59*** 18.62*** 0.9*** -14.46*** 217,696 39% Renting of machinery
and equipment 0 0.58*** 35.32*** 1.23** -30.90 1,633 38%
Computer and related
activities 0.94*** 0.68*** 6.17*** 0.73*** -3.28 30,667 46% Other Business Activities 0.03 0.65*** 12.62*** 0.9*** -16.7*** 95,321 42% Research and
Development 1.58 0.61*** 14.90 1.32*** -29.29 1,770 48%
Legend: * p<.1; ** p<.05; *** p<.01
Source: Author’s own computations using IES and OECD data for the years 2004-2014.
Table A6 - Evolution of wide and narrow Regimpact Table A6.1
Year Agriculture. hunting. forestry and fishing Mining and quarrying
Wide Regimpact Narrow Regimpact Wide Regimpact Narrow Regimpact
2004 0.076 0.033 0.133 0.080
2005 0.075 0.031 0.130 0.077
2006 0.070 0.026 0.120 0.067
2007 0.070 0.026 0.119 0.066
2008 0.077 0.026 0.129 0.066
2009 0.077 0.026 0.129 0.066
2010 0.075 0.023 0.123 0.060
2011 0.074 0.022 0.120 0.057
2012 0.073 0.022 0.120 0.057
2013 0.051 0.020 0.092 0.052
Table A6.2
Year Food products. beverages and tobacco Wood and products of wood and cork
Wide Regimpact Narrow Regimpact Wide Regimpact Narrow Regimpact
2004 0.113 0.043 0.107 0.046
2005 0.111 0.041 0.105 0.044
2006 0.106 0.036 0.100 0.039
2007 0.105 0.036 0.100 0.039
2008 0.117 0.036 0.111 0.039
2009 0.117 0.035 0.111 0.039
2010 0.114 0.032 0.108 0.035
2011 0.113 0.031 0.107 0.034
2012 0.113 0.031 0.107 0.034
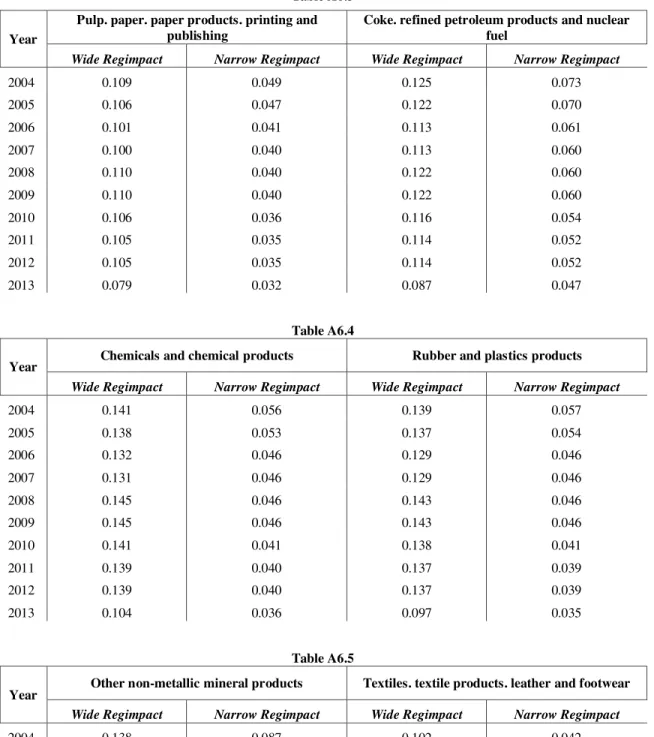
Table A6.3
Year
Pulp. paper. paper products. printing and publishing
Coke. refined petroleum products and nuclear fuel
Wide Regimpact Narrow Regimpact Wide Regimpact Narrow Regimpact
2004 0.109 0.049 0.125 0.073
2005 0.106 0.047 0.122 0.070
2006 0.101 0.041 0.113 0.061
2007 0.100 0.040 0.113 0.060
2008 0.110 0.040 0.122 0.060
2009 0.110 0.040 0.122 0.060
2010 0.106 0.036 0.116 0.054
2011 0.105 0.035 0.114 0.052
2012 0.105 0.035 0.114 0.052
2013 0.079 0.032 0.087 0.047
Table A6.4
Year Chemicals and chemical products Rubber and plastics products
Wide Regimpact Narrow Regimpact Wide Regimpact Narrow Regimpact
2004 0.141 0.056 0.139 0.057
2005 0.138 0.053 0.137 0.054
2006 0.132 0.046 0.129 0.046
2007 0.131 0.046 0.129 0.046
2008 0.145 0.046 0.143 0.046
2009 0.145 0.046 0.143 0.046
2010 0.141 0.041 0.138 0.041
2011 0.139 0.040 0.137 0.039
2012 0.139 0.040 0.137 0.039
2013 0.104 0.036 0.097 0.035
Table A6.5
Year Other non-metallic mineral products Textiles. textile products. leather and footwear
Wide Regimpact Narrow Regimpact Wide Regimpact Narrow Regimpact
2004 0.138 0.087 0.102 0.042
2005 0.134 0.083 0.100 0.039
2006 0.120 0.068 0.094 0.034
2007 0.119 0.067 0.094 0.033
2008 0.128 0.067 0.104 0.033
2009 0.128 0.067 0.104 0.033
2010 0.121 0.059 0.100 0.030
2011 0.118 0.056 0.099 0.028
2012 0.118 0.056 0.099 0.028
Table A6.6
Year Basic metals
Fabricated metal products except machinery and equipment
Wide Regimpact Narrow Regimpact Wide Regimpact Narrow Regimpact
2004 0.136 0.076 0.113 0.051
2005 0.132 0.072 0.111 0.048
2006 0.120 0.059 0.104 0.041
2007 0.119 0.058 0.104 0.041
2008 0.130 0.058 0.115 0.041
2009 0.130 0.058 0.115 0.041
2010 0.123 0.051 0.111 0.037
2011 0.121 0.048 0.109 0.035
2012 0.121 0.048 0.109 0.035
2013 0.086 0.042 0.077 0.031
Table A6.7
Year Machinery and equipment n.e.c Motor vehicles. trailers and semi-trailers
Wide Regimpact Narrow Regimpact Wide Regimpact Narrow Regimpact
2004 0.109 0.044 0.115 0.047
2005 0.107 0.042 0.113 0.044
2006 0.102 0.036 0.107 0.038
2007 0.101 0.036 0.106 0.038
2008 0.113 0.036 0.118 0.038
2009 0.113 0.036 0.118 0.038
2010 0.109 0.032 0.114 0.034
2011 0.108 0.031 0.113 0.033
2012 0.108 0.031 0.113 0.033
2013 0.076 0.028 0.080 0.030
Table A6.8
Year Other transport equipment Electricity. gas and water supply
Wide Regimpact Narrow Regimpact Wide Regimpact Narrow Regimpact
2004 0.089 0.037 0.547 0.520
2005 0.087 0.035 0.519 0.491
2006 0.082 0.030 0.396 0.364
2007 0.082 0.030 0.390 0.357
2008 0.090 0.030 0.396 0.356
2009 0.090 0.030 0.396 0.356
2010 0.087 0.027 0.336 0.294
2011 0.086 0.026 0.310 0.266
2012 0.086 0.026 0.310 0.266
Table A6.9
Year Construction Transport and storage
Wide Regimpact Narrow Regimpact Wide Regimpact Narrow Regimpact
2004 0.083 0.037 0.395 0.356
2005 0.082 0.035 0.392 0.354
2006 0.077 0.030 0.388 0.350
2007 0.076 0.029 0.388 0.350
2008 0.084 0.029 0.396 0.349
2009 0.084 0.029 0.396 0.349
2010 0.081 0.026 0.381 0.334
2011 0.080 0.025 0.380 0.333
2012 0.080 0.025 0.380 0.333
2013 0.057 0.022 0.359 0.331
Table A6.10
Year Post and telecommunications Real estate activities
Wide Regimpact Narrow Regimpact Wide Regimpact Narrow Regimpact
2004 0.313 0.279 0.028 0.010
2005 0.266 0.230 0.027 0.009
2006 0.262 0.226 0.026 0.008
2007 0.262 0.226 0.026 0.008
2008 0.268 0.225 0.028 0.008
2009 0.267 0.224 0.028 0.008
2010 0.264 0.221 0.027 0.007
2011 0.262 0.220 0.027 0.007
2012 0.261 0.219 0.027 0.006
2013 0.246 0.216 0.022 0.006
Table A6.11
Year Office. accounting and computing machinery Electrical machinery and apparatus n.e.c
Wide Regimpact Narrow Regimpact Wide Regimpact Narrow Regimpact
2004 0.128 0.039 0.122 0.053
2005 0.126 0.037 0.120 0.051
2006 0.122 0.033 0.114 0.045
2007 0.122 0.033 0.113 0.044
2008 0.136 0.033 0.125 0.044
2009 0.136 0.033 0.125 0.044
2010 0.134 0.030 0.121 0.040
2011 0.133 0.029 0.120 0.039
2012 0.133 0.029 0.120 0.039
Table A6.12
Year Radio. television and communication equipment Medical. precision and optical instruments
Wide Regimpact Narrow Regimpact Wide Regimpact Narrow Regimpact
2004 0.125 0.047 0.107 0.039
2005 0.122 0.045 0.105 0.037
2006 0.117 0.039 0.101 0.033
2007 0.117 0.039 0.101 0.032
2008 0.130 0.039 0.112 0.032
2009 0.130 0.039 0.112 0.032
2010 0.127 0.036 0.110 0.030
2011 0.125 0.035 0.109 0.029
2012 0.125 0.035 0.109 0.029
2013 0.093 0.032 0.078 0.027
Table A6.13
Year Manufacturing n.e.c; recycling Wholesale and retail trade; repairs
Wide Regimpact Narrow Regimpact Wide Regimpact Narrow Regimpact
2004 0.115 0.048 0.371 0.046
2005 0.112 0.046 0.369 0.043
2006 0.106 0.040 0.365 0.039
2007 0.106 0.039 0.365 0.039
2008 0.118 0.039 0.429 0.039
2009 0.118 0.039 0.429 0.039
2010 0.114 0.035 0.426 0.036
2011 0.113 0.034 0.426 0.036
2012 0.113 0.034 0.426 0.035
2013 0.079 0.031 0.231 0.033
Table A6.14
Year Hotels and restaurants Renting of machinery and equipment
Wide Regimpact Narrow Regimpact Wide Regimpact Narrow Regimpact
2004 0.100 0.036 0.082 0.022
2005 0.098 0.034 0.081 0.020
2006 0.092 0.029 0.079 0.019
2007 0.092 0.028 0.079 0.019
2008 0.103 0.028 0.090 0.019
2009 0.103 0.028 0.090 0.019
2010 0.100 0.025 0.089 0.017
2011 0.099 0.024 0.088 0.017
2012 0.099 0.024 0.088 0.017
Table A6.15
Year Computer and related activities Other Business Activities
Wide Regimpact Narrow Regimpact Wide Regimpact Narrow Regimpact
2004 0.090 0.029 0.357 0.030
2005 0.087 0.026 0.354 0.028
2006 0.085 0.023 0.352 0.025
2007 0.085 0.023 0.352 0.025
2008 0.093 0.023 0.388 0.025
2009 0.093 0.023 0.388 0.025
2010 0.091 0.021 0.386 0.023
2011 0.090 0.021 0.386 0.023
2012 0.090 0.021 0.386 0.023
2013 0.076 0.019 0.353 0.021
Table A6.16
Year Research and development Total Average
Wide Regimpact Narrow Regimpact Wide Regimpact Narrow Regimpact
2004 0.060 0.020 0.154 0.078
2005 0.059 0.018 0.149 0.074
2006 0.056 0.016 0.140 0.064
2007 0.056 0.016 0.139 0.064
2008 0.061 0.016 0.152 0.063
2009 0.061 0.015 0.152 0.063
2010 0.060 0.014 0.146 0.058
2011 0.059 0.013 0.144 0.055
2012 0.059 0.013 0.144 0.055
2013 0.049 0.012 0.109 0.050