A Work Project, presented as part of the requirements for the Award of a Master Degree in Finance from the Nova – School of Business and Economics
Liquidity Risk Management in the Portuguese Banking System
Ana Teresa Lambiza Pardal, 2310
A Project carried out under the supervision of Professor João Pedro Pereira
1
Acknowledgments
I would like to express my most sincere gratitude to Professor João Pedro Pereira. His
availability and help, even at his busiest times, were key to the development of this project.
To my mother, Maria Regina, who relentlessly offered me unconditional support
throughout the way.
To my brother, Nuno, who taught me that the way is always forward, regardless.
To Margarida, who showed me the true meaning of friendship and who I am lucky
2
Abstract
In the light of the recent financial crisis and interbank market turmoil, this study seeks to
comprehend the determinants of Portuguese banks’ liquidity management decisions. Based
on data from 2005 to 2015, it is found that profitability, efficiency and size are the main
drivers of a more aggressive risk-taking policy. Moreover, it is shown that the agent’s
optimal strategies relied more significantly on peers’ choices, rather than on own individual
fundamental characteristics and performance. Against this background, there is evidence for
herding in liquidity management practices in the Portuguese banking industry in the period
that preceded the sovereign crisis.
3
Contents
1 Introduction ... 4
2 Literature Review ... 5
3 The Context of the Portuguese Case ... 8
3.1. Evolution of Liquidity Management Practices before the Financial Crisis ... 8
3.2. The Financial Crisis: Repercussions and Adjustments ... 10
4 Defining and measuring liquidity ... 13
5 Determinants of Banks Liquidity Management Decisions – Empirical Evidence ... 15
5.1. Empirical Evidence at an Individual Level ... 15
5.1.1. Data and Methodology ... 15
5.2.1. Econometric Treatment ... 17
5.1.2. Empirical results ... 18
5.2. Empirical Evidence at a Collective Level ... 20
5.2.1. Econometric Model - Data and Methodology ... 20
5.2.2. Econometric Treatment ... 20
5.2.3. Econometric Model - Empirical results ... 21
5.3. LSV measure – Statistical Evidence for Herding in the Banking Industry ... 23
5.3.1. LSV measure – Data and Methodology ... 23
5.3.2. LSV measure – Empirical results ... 24
5.4. Limitations of the models used ... 24
6 Conclusions ... 26
4
1
Introduction
Transforming liquid liabilities into illiquid assets demands a sensitive equilibrium
between the mismatch in maturities that is often managed by banks at an interbank market
level. The global crisis of 2007 exposed crucial weaknesses in the risk decisions and practices
of financial institutions worldwide and emphasised the importance of efficiently operating
money markets. The scarce liquidity flow in these funding channels that shaped the period
from 2007-2009 significantly harmed banks’ ability to respond to their short-term liquidity
obligations.
Across the board, banks were showing signs of excessive dependence on wholesale
funding. The shake in investors’ confidence demanded them to re-evaluate their perception of
the underlying risk associated with the way these institutions were handling the liquidity gaps
intrinsic to their transformation function. The amount of risk that was before tolerated and
perceived as a common practice of the industry, started to be repriced at a much higher cost.
Ultimately, this context led to a freeze in these funds’ negotiations. The consequences rapidly
affected the real economy, which boosted the difficulties to implement the needed
adjustments to overcome the negative cycle.
The Portuguese case was particularly challenging since it combined a highly-leveraged
banking system with deep imbalances in the public-sector accounts. In fact, from 2007
onwards, and since deposits did not rise enough to compensate for the surge in banks’ assets,
the growth rate of wholesale funding increased at a much faster pace in Portugal, when
compared to the Euro Area1. When the crisis burst, these factors significantly aggravated the
willingness of investors to continue on funding these institutions, and created the need for
drastic adjustments in the liquidity strategies that were being implemented until date.
1
5 The study starts with the analysis of the evolution of key financial and banking indicators
from both pre and post crisis periods. To fully understand the development of the various
metrics across the industry players, a fictional-representative bank was built based on the data
gathered from the Annual Report and Accounts of 7 Portuguese banks, respectively
proportional to their yearly weight on the total value of the assets for the industry.
The main contribution of this thesis to the literature is to comprehend what were the main
determinants of Portuguese banks’ liquidity management decisions during the period of 2005
until 2015. Moreover, the focus relies on understanding whether these institutions optimized
their liquidity strategies solely based on their own individual characteristics or if, instead,
there is statistical evidence to believe that there were collective risk-taking practices in the
industry.
The empirical results regarding the drivers of liquidity management are derived from two
different approaches: the construction of an econometric model and the implementation of
the Lakonishok, Sheifer and Vishny (LSV) measure for herding. According to the findings, it
is possible to confirm that Portuguese banks not only considered their size, profitability and
efficiency, but also integrated each other’s strategies while shaping their own. As a result,
these ultimately reached a non-optimal point, neither from an individual nor from a collective
perspective.
2
Literature Review
Given its underlying complexity, the concept of liquidity risk and the appropriate means
of measuring it are not straightforward. Such as Bonfim and Kim (2012) described, it can be
defined as the risk of losing access to funding, whether by failing to capture deposits or
inability to refinance the current outstanding positions. In the past years, the finance industry
has experienced a significantly increased interaction among financial institutions, a factor
6 As discussed by Huang and Ratnovski (2011), this funds’ channel not only acts as an
efficient mean of seizing profitable investment opportunities and leveraging businesses at
competitive prices, but also opens room for excessive exploitation. The Portuguese banking
system successfully illustrates a case of progressively increased dependence on wholesale
funding, with a significant intensification registered on the period beginning in 2006 and
finally reaching its peak in 2011.
The dramatic drying of funds experienced by the Portuguese banking system in the latest
financial crisis clearly illustrated the need to enhance regulatory requirements in this
spectrum. As discussed in Bonfim and Kim (2012), there is the need for regulation to ensure
that banks, in their role of liquidity providers, manage their own liquidity risk adequately. To
do so, holding a set of highly liquid assets to cover any harmful mismatch between maturities
at a given period seems to be the most reasonable solution. There is a trade-off, though,
between holding such safe buffers. If, on the one hand, these ensure the sustainability of the
liquidity flow through the economy by protecting it, they also imply the opportunity cost of
not being injected back to the real economy to foster further growth and, for the banks’
perspective, yield a higher return. There is, therefore, an intrinsic underlying tendency to
deviate from this socially desirable equilibrium.
As financial transactions become more complex and banks increase their degree of
interdependence amongst each other, the question on whether they incorporate each other’s
actions while optimizing their own strategies becomes relevant. Various authors, such as
Farhi and Tirole (2012) or Rochet (2004), discuss the empirical findings on the enhanced
incentives to engage in collective risk taking actions. As a matter of fact, evidence shows that
banks are encouraged to engage in excessive liquidity risk when faced with a significant
likelihood that authorities will use all available mechanisms to avoid a collective collapse,
7 damage and avoid a severe destruction of value, the so called “lender of last resort” would
undertake a collective bailout. Hence, what should conceptually be a predominantly
individual exercise turns out to be far more collective than what would be the desirable from
a macroeconomic point of view. With regards to this matter, Ratnovski (2009) also supports
that, under equilibrium conditions, this collective excessive risk taking is perceived by banks
as a method to increase profitability free from the negative costs associated with its failure.
In the light of these findings and backed by the severe externalities of the most recent
financial crisis, regulators have indeed been implementing increasing efforts to monitor
institutions’ practices in their liquidity risk management, as it is the example of the Basel III
reforms and the introduced liquidity ratios requirements. Although the regulation continues
on being mainly focused on microprudential monitoring, it allows for greater prevention of
macroprudential worries. For example, the Liquidity Coverage Ratio (LCR) introduced a
30-day period where banks are able to fully function in case of inability to access market funding
and, on the other hand, the Net Stable Funding Ratio (NSFR) diminishes the risk of excessive
reliance on short-term funding, thus compelling banks to re-organize and solidify their
funding structure.
The comprehension of liquidity risk management for each institution relies greatly on
understating which are the main factors – individual and collective – that influence it. One of
the main methods followed to analyse this topic was the construction of an econometric
approach that sought to model the evolution of institution’s choices.
There are other proposed models in the literature that address collective risk taking
among industries, the so called herding behaviour. An agent is considered to be herding when
it deviates its actions – or, more specifically, its rational actions given the available market
information – after it observes its peers' decisions. Lakonishok, Sheifer and Vishny (1992)
8 mainly, stock analysis – focused on identifying herding behaviours across agents. In practical
terms, this approach is based on the study of the gap between the proportion of decisions
taken in a certain direction, compared to the expected proportion under the assumption of a
no-herding scenario.
At an international spectrum, on a study conducted by Bonfim and Kim (2012) and
focused on European and North American banks, the ratio between loans and assets, size and
profitability were the most relevant variables explaining a riskier attitude towards risk.
3
The Context of the Portuguese Case
3.1.Evolution of Liquidity Management Practices before the Financial Crisis The periods prior to the most severe years of financial distress in Portugal (in this study
considered to be from 2000 until 2010, the year prior to the Portuguese official ask for
external aid) were shaped by an unprecedented growth in some of the key performance
indicators (KPI) of the Portuguese banking system. At the same time, the performance of the
economy was beginning to show lack of conditions to support such developments. As it is
possible to see in Chart 1 below, the Portuguese Current Account was persistently negative,
showing signs of aggravation from 2003 onwards. The shown deficit could be perceived as
the outcome of an investment-period. However, this was not being directly reflected on an
increase in the value creation in the economy. On the other hand, other economies such as the
German, seemed to have experienced a GDP growth that, until 2009, followed roughly the
same path as the Portuguese, but was accompanied by a continuous position as a net creditor
to the external sector.
As far as the KPIs for the banking institutions are concerned, the outlook is rather similar.
9 value of the assets of a representative institution, used as a proxy to the evolution of its size,
increased by about 134% from 2000 to 2010 2.
Chart 1 - Evolution of CA Deficit and GDP Growth for Portugal and Germany from 2000 to 2015.
Although the Customer Deposits account registered a persistently positive trend, its
increase was not large enough to fuel the targeted leverage in the Asset side of the balance
sheet. As a result, the average Portuguese bank held a continuously worsening position as net
borrower to Central Banks and Other Credit Institutions on all the years of the sample. This
drastic variation came as the result of the need to access ECB’s funding to fuel the economy
and meet sovereign duties, as the majority of other investors had negatively re-accessed their
willingness to expose their capital to the Portuguese structural imbalances and sovereign risk,
therefore quoting an unbearable risk premium.
According to the representative Portuguese bank constructed, loans to customers
increased by roughly 34% from 2005 to 2010. In turn, the Loans-to-Deposits ratio that
Portuguese banks registered until 2011 was the highest in Europe. The typical Portuguese
bank registered its peak of 157.95% in 20073. As plotted on the Chart 2 below, the Euro Area
2
Comparing to data from the German banking industry, the homologous growth was of about 34%.
3
It is important to note that there is a significant discrepancy among institutions with regards to this indicator. From the 4 banks that recorded the highest values for LTD ratio – which reached the peak of 180.1% - 2 of them failed to resist and were forced to close its operations.
-13.0% -8.0% -3.0% 2.0% 7.0% 12.0%
2000 2001 2002 2003 2004 2005 2006 2007 2008 2009 2010 2011 2012 2013 2014 2015 GDP Growth and CA Deficit for Portugal and Germany
Portuguese CA Deficit Portuguese GDP Growth
10 peers followed a much smoother approach with regards to this ratio, registering a peak of
139.2% in 20074.
Chart 2 - Evolution of LTD ratio in the Portuguese and German Banking Industry from 2005 to 2015.
As illustrated in Chart 3 below, in terms of profitability, the years that preceded the
international financial crisis registered an exceptionally high Return on Equity (ROE), which
gradually fell until 2011 – the moment when breached the negative barrier.
Chart 3 - Evolution of profitability indicators in the Portuguese banking system from 2006 to 2015
3.2.The Financial Crisis: Repercussions and Adjustments
The adverse international macroeconomic context, the implementation of the needed
adjustments to rebalance the Portuguese sovereign debt crisis and the aggravating difficulties
4
Data collected from ECB statistics database.
100.0% 120.0% 140.0% 160.0% 180.0%
LTD Ratio Evolution in Portugal and Euro Area
Portugal Euro Area
-12.0% -2.0% 8.0% 18.0%
2006 2007 2008 2009 2010 2011 2012 2013 2014 2015 Evolution of Profitability indicators in the Portuguese banking
system
11 that the Portuguese State, its companies and banks faced when trying to access external
funding at bearable costs translated into an economic recession.
As it is possible to observe in the previously presented Chart 1, the Portuguese GDP
suffered volatile changes from the period of 2007 until 2012, decreasing its annual growth
rate by about 6.5%. The substantial cuts in public spending contributed to boost
unemployment, which spiked to 17.5%5.
On the banking spectrum, institutions were forced to de-leverage their portfolios quite
rapidly in an attempt to regain investors’ trust. Therefore, the balance sheet of these financial
institutions experienced significant structural changes. For the representative portfolio of a
Portuguese bank, total assets decreased by 21% from 2010 until 2015. In contrast, on the
Euro Area, the same account shrank by about 2.4%6.
On the Liabilities’ side of the balance sheet, it was crucial to control the previously
registered dependence from wholesale funding, which until 2012 increased at a much faster
rate in Portugal compared to its Euro Area’ peers. On that basis, from May 2011 to
September 2016, the growth rate of usage of this funding source decreased by about 8.1%,
while the Euro Area peers registered a reduction of roughly 3.3%.
In the context of the significant difficulties in accessing the Interbank market – and the
latter drying up of funds – brought by the sovereign crisis, the funding from the ECB rapidly
increased until 2012, as it is possible to see from Chart 4 below7. This account’s growth from
2008 until May 2011 reached 362.3%.
Since 2010, loans to customers shrank approximately by 22.8%, which supported the
crucial reduction in the LTD ratio. The latter decreased by 36.1% during the same period,
staying at 114.8% in 2015 (as illustrated in Chart 2).
5
Data collected from Eurostat.
6
According to data published by the Portuguese Banking Association.
7
12 0
20 40 60
Dec 2008 Dec 2010 May 2011 June 2012 Dec 2013 Sep 2016 Evolution of funding from the ECB to Portuguese
banks
Chart 4 - Evolution of funding from the ECB to Portuguese banks (data in thousands of millions of Euros).
Additionally, the solid behaviour of Total Deposits was also contributing for a smoother
adjustment in this indicator, which, despite the overall crisis context, increased by 7.1% from
2010 until 2016. This positive trend was supported by the low business environment and lack
of trust that led individuals and companies to diminish their consumption and delay their
investments, thus boosting savings.
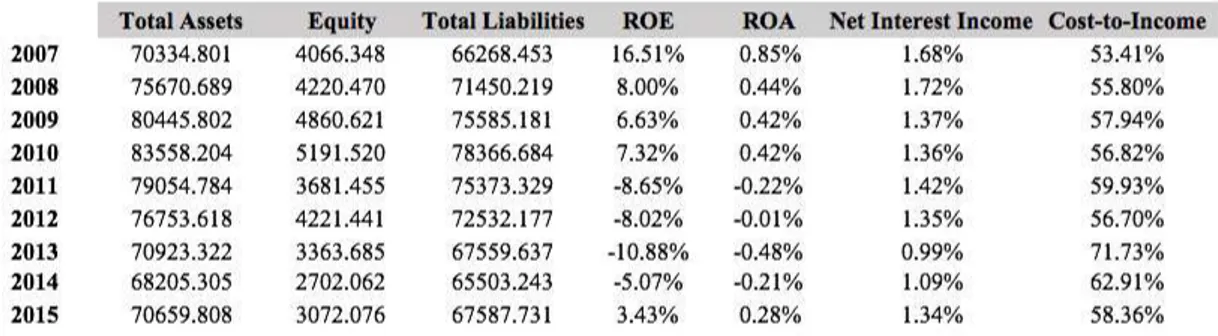
With regards to the efficiency across the industry - measured by the cost-to-income –, it
suffered a fall of about 18%8. This decrease is justified by the impacts of the Non Performing
Loans (NPL) in the operating income. Furthermore, factors such as the creation of the
internal means to monitor and guarantee the compliance with the new regulatory
requirements also played a role in the surge in costs associated with the business.
As far as Net Interest Income (NII) (as a percentage of assets) is concerned, it suffered a
significant decrease from the period of 2008 to 2013. In general, the negative interest rate
environmentcreated a negative pressure on banks profitability, boosted by the intervention of
the ECB. Combined with the context of low economic growth, this limits the amount of
income-generating opportunities. Moreover, the reputational risks arising from the perceived
underlying risk of the country and its institutions also deteriorated NII.
8
13 As previously mentioned, and clearly illustrated in Chart 3, profitability indicators were
severely harmed. In part, this poor performance was boosted by the increases in capital that
most banks undertook in an attempt to strengthen their balance sheets.
In conclusion, in Table 1 below, it is possible to find the evolution of some of bank’s
KPI’s from 2007 to 2015.
4
Defining and measuring liquidity
As discussed in Tirole (2011), liquidity risk can arise from several different sources and,
therefore, it is a concept that should not be analysed solely through an unique perspective. As
previously mentioned, it can be defined as the risk of losing access to funding, whether by
failing to capture deposits or inability to refinance the current outstanding positions.
As considered by Bonfim and Kim (2012), three of the different possible approaches to
measure and quantify this concept can be the Interbank Ratio – given by the Interbank Assets
as a percentage of Interbank Liabilities -, the Liquidity Ratio – expressed by the liquid assets
as a percentage of customer deposits and short-term funding – and the Loans to Deposits ratio
(LTD). Moreover, an analysis of the funding gap and the maturity mismatch between assets
and liabilities is also critical to comprehend the fragilities of the cash-flow management of an
institution.
Given that the objective of this study is to develop a methodology to identify the key
factors that shape Portuguese bank’s liquidity strategies both at an individual and collective
scope, it is crucial to guarantee that there is consistent reporting and clarity in the data
14 available for each bank at each year. Unfortunately, since the reporting organization across
different banks and, sometimes, within the same bank over the years, is not constant, it can
become difficult to efficiently isolate certain accounts. For this reason, the Liquidity Ratio
and the funding gap were excluded from the analysis.
In regards to the Interbank Ratio – measuring the net position of each bank with other
Central Banks and Credit Institutions –, it is closely tied with liquidity risk since it is
frequently associated with short maturities, creating room for complications in the case of
need to roll over their obligations. In the light of the financial aid that the Portuguese State
and banks received during the sovereign crisis and the drying of funds resulting from the
market turbulence registered in 2007, the accounts that compose this ratio have been severely
affected. For example, and as previously mentioned, there was a surge of 362.3% in funding
received from the ECB, which reads as a worsening of the net borrowing position. However,
the underlying reasons behind this variation are not directly related to an increase in risk
taking in terms of liquidity. Therefore, for the purpose of this study, this measure may not, by
itself, provide the cleanest approach to the evolution of liquidity risk policies.
Against this background, the LTD ratio is the most suitable and complete measure to
address the objectives of this study. This indicator is calculated by dividing the Total Loans
to Costumers9 by the Costumer Deposits10 for each institution, for each year. By providing
the relationship between a largely solid source of funding – the customer deposits – and its
transformation into credit, it allows to understand to which extent banks were stepping apart
from this more stable source of funding to leverage their provision of resources. The higher
the dependence on wholesale funding, the more the bank is exposed to market’s volatility and
this, in turn, generates even further difficulties when rolling over their obligations in times of
9
Which includes loans to companies, institutions, project finance, mortgage loans and loans to individuals.
10
15 financial distress. Finally, this inability to manage the short-term maturity of the liabilities
and the long-term maturity of its assets drives the bank into an illiquid state.
In fact, and just as studied in the previous sections, this ratio’s behaviour was a good
representation of the imbalances of the pre-crisis period and the following adjustments.
Additionally, its computation is fairly easy and its components are unmistakably identified on
the official reports of the studied banks.
5
Determinants of Banks Liquidity Management Decisions – Empirical
Evidence
5.1.Empirical Evidence at an Individual Level 5.1.1. Data and Methodology
As it was made clear in the previous chapters of this study, the Portuguese banking crisis
was, among other factors, a result of a high risk taking strategies in terms of liquidity
management from the industry players. Not only the sustainability of the strategies relied, to
a large extent, on an (utopic) unlimited access to wholesale funding, but also the maturity
distribution of each obligation left room for deep unbalances should there be any distress
environment in the global economy.
To understand to which extent certain factors contributed for determining the liquidity
strategies of Portuguese banks for the periods of pre and post crisis, an econometric model
using Panel Data was constructed. The data was gathered from each Annual Report and
Accounts for 6 Portuguese banks: Banco Português de Investimento (BPI), Caixa Geral de
Depósitos (CGD), Banco Espírito Santo (BES), Banco Comercial Português (BCP), Banco de
Investimento do Funchal (Banif) and Montepio. For this part of the study, Crédito Agrícola
was not included due to its different policies in regards to its liquidity management (a much
more conservative approach). The maximum value this institution reached in terms of its
16 were registering 192%. It is not considered, therefore, a representative case of how liquidity
risk was being managed in the Portuguese banking industry.
The study will be separated in two perspectives. Firstly, a model analysing the
determinants to measure liquidity risk at an individual (micro) level was constructed. For this
purpose, the following variables for each institution were considered:
Variable Name Description Expected Relationship
Dependent Variable
LTD ratio Loans-to-Deposits ratio for each
(ltd) institution at each given
year
Bank Characteristics
Size Measured by each bank Total Assets Positive, since banks that hold more assets would have higher incentives to pursuit riskier liquidity strategies based on the belief that these assets constitute a more solid buffer.
(assetstotal) for each period
Profitability Measured by each bank's ROA, Positive, based on the premise that banks that recorded decent levels of profitability in the previous periods would continue on undertaking strategies that would increase exposure to liquidity risk.
(roa, roe, nii)
ROE and NII for each period
Efficiency Measured by each bank's CI
Negative, following the proposition that institutions whose efficiency indicators have showed good performance will continue on leveraging their balance sheets.
(ci)
Profile Measured by relationship between Positive, since banks that are more specialized in lending can be associated with a deeper net borrowing position and more vulnerable funding structures, being more exposed to liquidity risk.
(loanstoassets) each bank's total assets and total
customer loans
17
Variable Name Description Expected Relationship
Market Conditions Economic Performance (gdpgrowth) Euribor (euribor)
Measured by GDP Growth for each
considered period
Measured by the average 1-year
Euribor rates for each studied period
i) If previous period GDP showed signs of solid growth, there are incentives to believe in sustainability of current practices, therefore the relationship would be positive; ii) Poor GDP growth in previous period may indicate low interest rate environment, which may boost leverage by turning it into a relatively cheaper strategy.
Negative, based on the fact that the lower the interbank funding rate is, the cheaper it would be to continue on fuelling the previous leverage practices.
Time Controls
Time trend Variable that considers the passage The goal is to understand whether the de-leveraging followed a smoother pattern or if, instead, the adjustments were more sudden. Intuitively, it would be to expect that this variable would be negatively correlated with a riskier attitude towards liquidity. One of looks to analyse the impact of the international liquidity crisis from 2007 to 2009, the other focus on the impact of the sovereign crisis in Portugal (2010 to 2015).
(timetrend) of periods in the sample
International Crisis Dummy variable for being in the
(intcrisis) period from 2007 to 2009
Portuguese Crisis
(sovcrisis)
Dummy variable for being in the period from 2010 to 2015
5.2.1. Econometric Treatment
Problems of endogeneity may be associated with the explanatory variables used, which
may possibly harm the econometric accuracy and unbiasedness of the estimators. The fact
that the model is conducted with the lagged values for each independent variable allows to
18 (1) Both the Hausman and the Breusch-Pagan LM tests were computed, confirming the
presence of fixed effects in the sample. Hence, the final regressions were calculated
following a fixed-effect model. This specification allows to control for each bank’s individual
own characteristics (not considered in the data, such as, for instance, bank’s culture) that do
not vary over time and that may influence the predictor variables.
Additionally, using the Variance Inflator Factor (VIF) command in Stata, it was
concluded that the models are not affected by collinearity.
Finally, to correct for the heteroskedasticity detected in the sample and to guarantee the
efficiency of the estimated parameters, robust standard errors were used.
5.1.2. Empirical results
After correcting for the econometric issues on the sample and empirically analysing
which variables were statistically meaningful (considering a confidence level of 90%) to
determine banks’ choices on their liquidity management, the final model was achieved
comprising the characteristics at bank level and is as follows:
𝐿𝑇𝐷$,& = 𝛽)+ 𝛽,𝐶𝑜𝑠𝑡 𝑡𝑜 𝑖𝑛𝑐𝑜𝑚𝑒$,&6,+ 𝛽7𝑇𝑜𝑡𝑎𝑙 𝐴𝑠𝑠𝑒𝑡𝑠$,&6,+ 𝛽;𝑅𝑂𝐸$,&6,
+ 𝛽?𝑆𝑜𝑣𝑒𝑟𝑒𝑖𝑔𝑛 𝐶𝑟𝑖𝑠𝑖𝑠 + 𝛼$+ 𝜇$,&
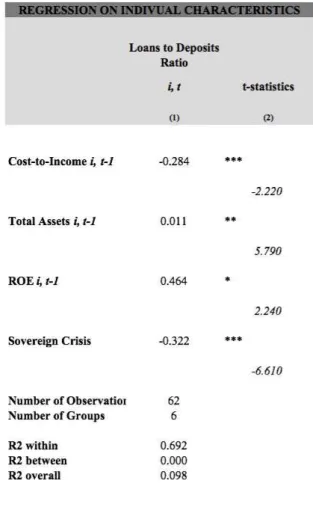
The results from the estimation of Equation 1 are presented in Table 2.
From the interpretation of the table, one can conclude that, considering a 90% confidence
interval, the individual factors that contribute the most to define the banks’ liquidity strategy
are the efficiency performance verified of the previous year, the size of the bank measured by
the assets it held at t-1, its previous profitability and, finally, the fact that Portugal was facing
a sovereign debt crisis. The most pronounced effect on the LTD of each institution is shown
to be the economic downturn of the country – accounting itself with a decrease of 32.1% in
19 Moreover, profitability and efficiency also play a significant role. A surge of 1
percentage point in the ROE provides, on average, an incentive of about 0.46 percentage
points towards a riskier liquidity strategy. On the other hand, a marginal increase in the CI
(which translates in a loss in efficiency) influences the institution into a more conservative
approach to risk, causing a decrease of about 0.28 percentage points in the LTD, on average,
ceteris paribus.
20 Finally, there is also evidence that positively correlates the size of banks with a more
aggressive liquidity risk management policy. The findings suggest that an increase of 1000
million euros will, on average, be associated with a rise of 1% in the LTD.
In terms of goodness of fit, it is concluded that 69.1% of the variations on the dependent
variable across time are explained by the variations in the explanatory variables.
5.2.Empirical Evidence at a Collective Level
To investigate the hypothesis that Portuguese banks internalize its peers’ position
towards risk in their own liquidity risk management - generating a collective risk taking
practice - two approaches were followed. Firstly, a new econometric regression considering
an additional variable was computed. Secondly, a LSV method was constructed.
5.2.1. Econometric Model - Data and Methodology
In order to comprehend whether there is, indeed, propensity for collective risk taking
among banks, a new variable was introduced. LTD Peers for each bank i at time t, is a
weighted average (based on the proportion of all the other banks’ assets to the total industry
assets, adjusting to the absence of bank i) of LTD ratio. The main objective is to analyse the
impact of the choices of the peers at time t-1, when bank i is optimizing its own strategies at
time t. A second econometric regression was ran, including both individual and collective
variables.
5.2.2. Econometric Treatment
The same econometric treatment applied to the individual-based characteristics model
(based on individual characteristics) was conducted in the present regression.
Including the variable LTD Peers at t-1 may generate issues of reverse causality. As
discussed in Manci (1993), the problem arises from the fact that it is not possible to guarantee
21 (2) peer group as well – there are omitted time-invariant variables across banks that affect the
independent variable.
5.2.3. Econometric Model - Empirical results
After correcting for the econometric issues on the sample and empirically analysing
which variables were statistically meaningful (considering a confidence level of 90%) to
determine banks’ choices on their liquidity management, the final model was achieved
comprising the individual characteristics of each institutions and is as follows:
𝐿𝑇𝐷$,& = 𝛽)+ 𝛽,𝐿𝑇𝐷 𝑃𝑒𝑒𝑟𝑠&6,,GH$ + 𝛽7𝑇𝑜𝑡𝑎𝑙 𝐴𝑠𝑠𝑒𝑡𝑠 $,&6,+ 𝛽;𝑅𝑂𝐸$,&6,,
+ 𝛽?𝑆𝑜𝑣𝑒𝑟𝑒𝑖𝑔𝑛 𝐶𝑟𝑖𝑠𝑖𝑠 + 𝛼$ + 𝜇$,&
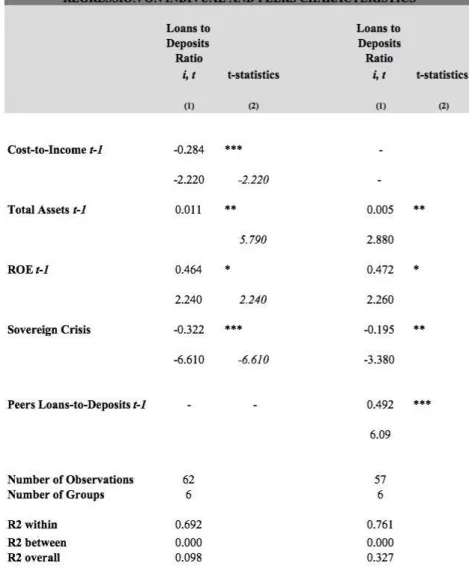
According to the Table 3, and continuing on considering a confidence interval of 90%,
the previously used lagged explanatory variables ROE and Total Assets remain statistical
significant and consistent with the previously presented signals. However, the introduction of
the variable accounting for the peers’ effects changed the magnitude of its impact on the LTD
ratio. In this new regression, the fact that the institution is operating in a year of sovereign
crisis in Portugal decreases its impact on LTD ratio to about 19.5%, on average, ceteris
paribus (compared to the 32.1% previously registered). Moreover, a marginal rise of 1000
million euros in terms of Total Assets will cause the institution to increase its LTD by about
0.4%, an impact lower than the previously registered. Finally, profitability experienced a
marginal increase in the magnitude of its impact, adding an average of 0.47 percentage points
to the LTD ratio for each marginal increase in the ROE. With the introduction of the new
variable, the efficiency factor lost its previous statistical significance.
Based on the findings, it is in fact possible to confirm that there is statistical significant
22 average, when there is an increase of 1 percentage point in the peer’s LTD, bank i is likely to
increase its own LTD by an average of 0.49 percentage points.
The goodness of fit of this econometric regression shows that 76.14% of the variations in
the LTD at time t are explained by variations in the used independent variables.
Comparing the results achieved for the two models, it is possible to conclude that, when
accounting for the variable that reflects the peers’ decisions towards its LTD ratio, the
goodness of fit of the overall regression increases.
23 5.3. LSV measure – Statistical Evidence for Herding in the Banking Industry The LSV measure, firstly proposed by Lakonishok, Sheifer and Vishny (1992), is an
indicator initially built to identify herding strategies among investors in the financial markets.
The propensity to mimic other player’s behaviour independently of the fundamental value of
the strategy may significantly bias financial instruments’ prices due to the excessive
concentration of transactions. This measure’s applicability in the banking industry was
further explored by Uchida and Nakagawa (2007) and Van den End and Tabbae (2012).
5.3.1. LSV measure – Data and Methodology
Under the null hypothesis that there is no herding in liquidity risk management –
meaning that agents optimize their attitude towards risk in a given period for reasons that are
only related to its own intrinsic performance and the overall economic context – the
following Equation 3 was computed:
𝐻$ = 𝑃$ − 𝑃& − 𝐸 𝑃$ − 𝑃&
Where Pi is given by the number of banks that increased their LTD ratio from period t-1 to t
divided by the total number of banks active in that period. Pt represents the mean of Pi’s for
all the periods of the sample. The latter variable can, therefore, be considered as a proxy for
what is the unbiased rational behaviour under the general macroeconomic conditions
affecting the sector. To construct this variable, a yearly average of the LTD ratio from all the
Euro Zone countries was computed11.
In regards to the Adjustment Factor in the equation – important in order to normalize the
measure, guaranteeing that is has zero mean under the null hypothesis -, it was achieved by
computing the sample average of |𝑃$− 𝑃& | across time.
11
As previously analysed on Chart 2, other Euro Zone’ banks did not undertake the same leverage on their LTD ratio. In general, most countries kept this indicator well below the Portuguese one.
24 To test whether there is evidence for herding behaviour in liquidity risk management
across banks, a t-statistic was computed and compared against the relevant critical values.
5.3.2. LSV measure – Empirical results
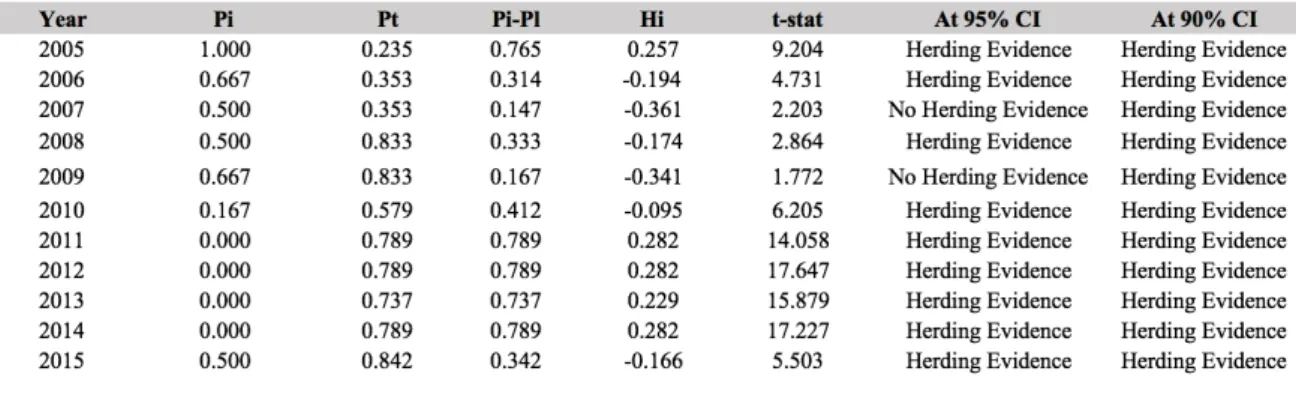
The findings of the application of the LSV measure to Portuguese baking data from 2005
to 2015 is presented below on Table 4.
As it possible to see, evidence supports the existence of persistent herding behaviour
across peers with regards to their liquidity choices. It is in fact true that departing from 2011
– period where it was statistically proved in the previous session that was significant in
affecting liquidity risk management – the needed adjustments common across all banks in the
sample could possibly be influencing the results. However, before this period, there is no
fundamental reason that could support such collective risk taking behaviour.
5.4. Limitations of the models used
There are a few limitations associated with the proposed methods. Firstly, the Portuguese
banking system is rather small when compared to other economies. Therefore, only 6
institutions were studied across 11 years, which provides a rather small sample that might
possibly harm the econometric accuracy of the parameters. Moreover, since the data was
gathered from the Report and Accounts of each bank, the availability of older data was
25 limited. Using a more complete dataset, two econometric regressions would have allowed a
more detailed study of the evolution of the risk management decisions and the changes in the
magnitude of each regressor on liquidity risk. To respond to this limitation, the dummy
variables International Crisis and Sovereign Crisis were added in order to isolate the effect of
the economic cycle in which the liquidity management takes place.
In addition to this, other variables would have been relevant to understand liquidity
strategies, as for example the funding gaps and maturity mismatches of each institution. In
fact, by analysing the data provided by a few banks, it is possible to verify that the 1 year
funding gap showed a constant negative net position, reaching its worse performance in 2010.
However, due to differences in reporting across banks and, sometimes, the lack of
consistency in the patterns of published information for the same institution across time, such
variable was not used.
Using the ROE as a measure of profitability may also be misleading. As discussed on
the ECB study “Beyond ROE – How to Measure Bank Performance”, the possibility of
articulating this indicator through changes in the equity of the institution affects its reliability.
According to this study, there is empirical evidence of a greater dispersion of capital ratios
during the period of the crisis due to this possibility artificial modification12. Thus, a time
series comparison becomes challenging13. Despite these drawbacks, the ROE tends to be one
the most looked-at indicators of profitability in the investors’ perspective. Against this
background, even if managers realize the limitations of this indicator, it is understandable to
consider it as a key indicator to consider when defining their strategies.
Finally, the LSV approach also entails some restraints. One of the main drawbacks of
this methodology is the fact that it does not distinguish intentional herding. As discussed by
12
Based on the finding of the study, there is indeed empirical evidence that points to the link between the most profitable banks - measured by roe – being the ones who were hit the most by the crisis.
13
26 Frey, Herbst and Walter (2007), it is possible to argue that the measure is not able to fully
identify and separate situations where players are, in fact, intentionally herding, and when
this concentration of decisions arises because peers are facing the same information set.
6
Conclusions
This study provides empirical evidence on the determinants of the strategic approach to
liquidity risk management in Portuguese banks and addresses the issue of herding in liquidity
risk in the years that precede the Portuguese sovereign crisis. All in all, both the econometric
approach and the LSV measure implemented provide meaningful statistical evidence of
collective risk taking within the industry. From the results and analyses above mentioned, it
is possible to conclude that individual players have defined their strategies not only taking
into account and weighting their own intrinsic characteristics, but also closely monitoring
what other players were doing in order to take insights to adjust their own business.
As discussed in Farhi and Tirole (2012), and according to these authors, this identified
evidence for herding in the banking industry tends to be built upon the idea that the lender of
last resort – institutions regulating the industry – will not allow a collective failure within the
banking system as the damage and societal harming would be perceived as too destructive.
Therefore, banks followed a continuously-leveraging strategy, underestimating the downside
risks and holding on to the belief that in the (unlikely) event of losses, these would be
absorbed by these entities whose goal, above anything else, is to ensure market stability
(IMF; ECB; others). Such belief shared by the generality of the industry players generated a
self-fulfilling prophecy translated in increasing risk-taking behaviours.
Only when money markets and investors’ confidence were shaken by the events of
2007-2009 (Lehman Brothers failure; drying of funds in the Interbank market), the
misperception of real risk of these strategies was exposed. The severe consequences
27 Portuguese banking system, scoring the highest in the LTD ratio when compared to its
European peers, experienced to the fullest this dramatic environment while simultaneously
dealing with a severe sovereign crisis, which aggravated even further the risk premium
charged to national banks.
This enlarged leverage clearly surpassed the optimal point. As discussed in the
previous sessions of this study, the years preceding the crisis were shaped by steep increases
of the LTD ratio. However, theagent’s measures of profitability (ROA/ROE) were no longer
indicating a better performance – the decision of engaging in a marginal increase in liquidity
risk was not yielding the needed additional return to support it. This setting reinforces even
further the empirical evidence found in favour of herding behaviours and, in the light of the
drawback of the LSV model of not being able to separate intentional herding, is key to
exemplify how, if the optimisation of the strategies were made individually, the outcome
would differ.
7
Bibliography
Angelini, P., A. Nobili and C. Picillo (2011). “The interbank market after August 2007: What has changed and why?”, Journal of Money, Credit and Banking, 43(5), 923-958.
Associação Portuguesa de Bancos, 2016. “Overview do Sistema Bancário Português”. Accessed May 2017.
www.apb.pt/content/files/Novembro_-_Overview_do_Sistema_Bancrio_Portugus_PT_2.pdf
BANIF. 2005-2015. “Relatório e Contas”. Accessed March 2017. BCP. 2005-2015. “Relatório e Contas”. Accessed March 2017. BES. 2005-2015. “Relatório e Contas”. Accessed March 2017.
Bonfim, D. and Moshe, K. (2012). “Liquidity Risk in Banking: Is there herding?”, BdP Working Paper, Financial Stability Report.
BPI. 2005-2015. “Relatório e Contas”. Accessed March 2017. CGD. 2005-2015. “Relatório e Contas”. Accessed March 2017.
Crédito Agrícola. 2005-2015. “Relatório e Contas”. Accessed March 2017.
28 Review, 91(2),422-425.
Drehmann, M. and K. Nikolaou (2009). “Funding liquidity risk: definition and measurement”, ECB Working Paper No. 1024.
European Central Bank (2010). “Beyond ROE – How to Measure Bank Performance”. Working Papel, Appendix to the report on EU banking structures.
Euro Area Statistics. “Banks balance sheet”. Accessed March 2017. https://www.euro-area-statistics.org
Euro Area Statistics. “Macroeconomic Indicators”. Accessed March 2017. https://www.euro-area-statistics.org
Eurostat. Database. http://ec.europa.eu/eurostat/data/database
Farhi, E., and J. Tirole (2012). “Collective Moral Hazard, Maturity Mismatch, and Systemic Bailouts”, American Economic Review, 102(1), 60—93.
Huang, R. and L. Ratnovski (2011). “The dark side of bank wholesale funding”, Journalof Financial Intermediation, 20, 248-263.
Lakonishok, J., A. Shleifer and R. Vishny (1992). The impact of institutional trading on stock prices, Journal of Financial Economics, 31, 13-43.
Montepio. 2005-2015. “Relatório e Contas”. Accessed March 2017.
Ratnovski, L. (2009), “Bank liquidity regulation and the lender of last resort”, Journal of Financial Intermediation, 18(4), 541-558.
Tirole, J. (2011). “Illiquidity and all its friends”, Journal of Economic Literature, 49(2), 287-325.
Uchida, H. and R. Nakagawa (2007). “Herd behavior in the Japanese loan market: Evidence from bank panel data” Journal of Financial Intermediation, 16, 555—583.
Wooldridge, Jeffrey M.. 2012. “Advanced Panel Data Methods” In “Introductory Econometrics: A Modern Approach”, ed. Cengage Learning, 484-511. Mason: