Fisioter. Mov., Curitiba, v. 30, n. 4, p. 715-723, Oct./Dec. 2017 Licenciado sob uma Licença Creative Commons DOI: http://dx.doi.org/10.1590/1980-5918.030.004.AO06
Assessment of Vert-3D repeatability and
reproducibility for evaluating the scoliosis of
children with different nutritional profiles
Avaliação da repetibilidade e reprodutibilidade do Vert-3D para
avaliação de escoliose de crianças em diferentes peris nutricionais
Juliana Adami Sedrez, Cláudia Tarragô Candotti, Maria Izabel Zaniratti da Rosa, Fernanda da Silva Medeiros, Mariana Tonietto Marques, Jefferson Fagundes Loss*
Universidade Federal do Rio Grande do Sul (UFRGS), Porto Alegre, RS, Brazil
Abstract
Introduction: The Vert-3D is a radiation-free system which offers a three-dimensional view of the back’s surface, providing a quantitative assessment of spinal curvatures. Objective: To verify the repeatability, inter-rater reproducibility, and correlation between Cobb angles and the results of the Vert-3D system version 1 in the evaluation of the front curvatures of the spine in children with different nutritional pro-files. Methods: The sample was composed of 115 children who underwent posterior-anterior panoram-ic digital radiography of the spine and five evaluations with the Vert-3D system by three trained raters.
Results: Version 1 of the Vert-3D system showed: (1) significant and moderate correlations of repeatability
for arrows on the left (ICC between .54 to .83) and significant and moderate correlations for arrows on the right (ICC between .55 to .60) for only normal BMI; (2) significant correlations of inter-rater repro -ducibility for left arrows (ICC between .47 to .65), weak to moderate correlations for right arrows (ICC between .29 to .60), and no significance for obese samples; and (3) significant correlations ranging be -tween .31 and .60 on the left side and non-significant correlations to the right side be-tween Cobb angles and
* JAS: PhD student, e-mail: [email protected]
716
scoliosis arrows. Conclusion: High correlation levels solely on the left side decrease the possibility of sys-tem-use for the assessment of scoliosis.
Keywords: Evaluation. Spine. Topography. Child. Validity of Tests.
Resumo
Introdução: O sistema Vert-3D fornece visão tridimensional da superfície das costas, possibilitando uma ava -liação quantitativa das curvaturas da coluna vertebral, livre de radiação. Objetivo: Verificar a repetibilidade, a reprodutibilidade interavaliador e a correlação entre os ângulos de Cobb e os resultados da versão 1 do sistema Vert-3D na avaliação das curvaturas frontais da coluna vertebral de crianças com diferentes perfis nu -tricionais. Métodos: A amostra foi composta por 115 crianças, que foram submetidas à radiografia digital pa -norâmica póstero-anterior da coluna vertebral e cinco avaliações com o sistema Vert-3D, por três avaliadores treinados. Resultados: A versão 1 do sistema Vert-3D apresentou: (1) correlações significativas e moderadas de repetibilidade para flechas à esquerda (ICC entre 0,54 e 0,83) e correlações significativas e moderadas para flechas à direita (ICC entre 0,55 e 0,60), somente para IMC normal; (2) correlações significativas de reprodu -tibilidade interavaliador para flechas à esquerda (ICC entre 0,47 e 0,65), de fracas a moderas para as flechas a direita (ICC entre 0,29 e 0,60) e não significativa para os obesos; e (3) correlações significativas entre 0,31 e 0,60 para o lado esquerdo e não significativas para o lado direito entre os ângulos de Cobb e as flechas escolió -ticas. Conclusão: Os bons níveis de correlação apenas para o lado esquerdo diminuem as possibilidades de uso do sistema para avaliação da escoliose.
Palavras-chave: Avaliação. Coluna Vertebral. Topografia. Criança. Validade dos Testes.
Introduction
The evaluation of the spine is very important for any clinical situation, such as when monitoring the curva-ture changes in the treatment of spinal deformities and for the planning of orthopedic surgical procedures (1). Usually, conventional radiography is the first choice of modality (2). However, the patient’s exposure to a large amount of radiation constitutes a great disadvan-tage when securing radiographs, especially in cases with an early-onset of postural changes. Furthermore, X-ray examinations are not capable of measuring the asymmetry of the trunk, which often has the greatest importance for the patient rather than the radiographic position of the spinal column itself (3).
Aiming to minimize exposure to ionizing radiation and provide adequate and frequent monitoring of postural changes, noninvasive techniques meant to assess and analyze the progression of scoliosis have been recommended (4). Currently, several studies have investigated the validity of noninvasive instru-ments that use the stereograph for evaluation of the
spine, such as the Formetric (5, 6), Quantec (7, 8), ISIS2 (3, 9) and Milwaukee systems (10). In Brazil, a system has been launched that analyzes the postural deviation of the spine by means of three-dimension-al scanning, cthree-dimension-alled the Vert-3D, which uses stereo-graphic technology with structured light to provide a radiation-free examination and a three-dimensional view of the back’s surface. However, thus far no ref-erence has been found that indicates the system has been subjected to validation procedures.
717 Thus, instruments that reduce the need for the
manual marking of anatomical landmarks, such as the Vert-3D, can be important tools for physiotherapists to accurately evaluate overweight and obese individuals. Therefore, it is important to know the actual applica-bility of such instruments, specifically in relation to populations with differing nutritional profiles. With this in mind, the objectives of this study were: (a) to verify the repeatability; (b) to verify the inter-rater reproducibility; and (c) to correlate the Cobb angles with the results of the Vert-3D version 1 system, spe-cifically in the assessment of the front curvatures of the spine in children with divergent nutritional profiles.
Methods
Sample
The sample size was determined through the Thometz et al. (15) study, admitting a 5% margin error and a 95% confidence interval. The following inclu -sion criteria were used: aged between 6 and 13 years old, were able to remain in the orthostatic position without assistance, provided a medical request for spinal radiography, and participated in all five tests with the Vert-3D system. Children who had previous surgery or congenital deformity in spinal structures were excluded. Initially, 119 children attending public health centers for whom spinal radiography had been requested were invited to participate in this study; however, four were lost—two for yielding a radiologi-cal examination with poor positioning, and two for not having completed the five tests with the Vert-3D sys -tem. The sample consisted of 115 children with a mean age of 10.9 ± 2.5 years; 53.9% (n = 62) were male.
In order to evaluate the validity of the Vert-3D system in various nutritional profiles, the sample was divided into three groups: low-weight and normal-weight, overweight, and obese. Each group was stratified according to the percentage of chil -dren belonging to these nutritional profiles (16). The low-weight group was analyzed together with the normal weight group because, when implement-ing the nutritional profile stratification accordimplement-ing to the IBGE, the number of low-weight children was miniscule (n = 4), making it impossible to conduct a separate analysis of this group.
This study follows the National Health Council 466/12 resolution, and it was approved by the Ethics
Research Committee of the Federal University of Rio Grande do Sul under ID number 19685. The chil-dren were included once a document of informed consent had been signed by their parent(s) and/ or guardian(s).
Data collection
Anthropometric, radiographic, and topographic evaluations were performed on the same period of the day, and the examiners were blinded in regards to the experiment.
Anthropometric evaluation
Body mass and height were measured to calcu-late the body mass index (BMI). BMI was classified according to the international standard, stratified by age (17).
Radiographic evaluation
From the panoramic digital radiographs in the anteroposterior plane, the Cobb angles (18) were calculated with a mathematical routine developed in MATLAB 7.9 software. The scoliosis curvature angles were calculated with the steeper cranial vertebrae of the upper plateau and the steeper caudal vertebra of the lower plateau as references. All calculations were performed by two trained raters, and when the values between the evaluators differed more than 5º, a third rater performed a new evaluation (19). The Cobb angle was defined as the average of the two closest results.
Topographic evaluation
The topographic evaluation was performed with the Vert-3D topography system, developed by Miotec Biomedical Equipment Ltda located in Porto Alegre, Brazil.
718
The evaluator palpated and marked the spinous process of the seventh cervical vertebrae (C7), the second sacral vertebrae (S2), and the left and right posterior superior iliac spines (PSIS).
The assessments were performed by three raters previously trained in the method (Ra, Rb, and Rc), and each child was evaluated five times on the same day. For each assessment the markers were removed and each rater repeated the evaluation protocol, including: palpa-tion, marking the anatomical points, child positioning and image capture. The assessment of repeatability employed data from two successive measurements by Ra (Measures 1 and 2) and Rb (Measures 3 and 4); for the inter-rater reproducibility, Ra’s (Measure 1), Rb’s (Measure 3), and Rc’s (Measure 5) first measurements were used. In addition, to correlate the Cobb angles with the results of the Vert-3D, the measurements from Rc (Measure 5) were used.
The Vert-3D system
This system is composed of a computer, a projec-tor, and a camera attached to a tower adjustable in height (Figure 1).
Figure 1 - The physical structure of the Vert-3D system, and child positioned for the exam.
This system projects a structured light pattern onto the individual’s back, and the captured image is then analyzed by the Vert-3D system, which gen-erates a bulge map and a curvature map. From this information the symmetry line is obtained, which is defined as the point at which there is no difference in the contouring and bending of both sides of each
horizontal level, representing an estimate of the loca-tion of the spinous processes (20).
From this symmetry line, Version 1 of the Vert-3D system provides calculations of arrows and Vert angles of scoliosis; however, in this study only the data related to the arrows will be presented, since the results obtained with the angular measurements were unsatisfactory. For the scoliosis arrow calcula-tions, a line uniting the initial curvature point (C7) with the lowest point showing the most lateral de-viation, and another line uniting the final curvature point (S2) with the most superior point showing the most lateral deviation, were traced. These two lines are called strings, and the scoliosis arrows were ob-tained using the longest perpendicular distance (cm) between the strings and the symmetry line (Figure 2).
Figure 2 - Analysis of the symmetry line representation for the right and left arrows, 1 = Symmetry line; 2 = Strings; 3 = Scoliosis arrows.
Statistical analysis
Data normality was verified with the Kolmogorov-Smirnov test and descriptive data analysis was car-ried out in SPSS version 17 software. The inferential analysis was performed with the intraclass correla-tion coefficient (ICC), the Spearman correlacorrela-tion co -efficient (rho), the Wilcoxon test, and the Friedman test (α = 0.05).
719
Table 1A - Results of the Vert 3D Version 1 regarding to the scoliosis arrows repeatability in the various nutritional profiles (Evaluator A)
Arrows
Evaluator A 1º Median Evaluation
(min.–max.)
2º Median Evaluation
(min.–max.) p (Wilcoxon) ICC (IC95%)
p (ICC) Normal BMI (n = 69)
Right Arrow (cm) 0.13 (0.02-0.65) 0.14 (0.01-0.54) 0.283 0.550 (0.362-0.695) <0.001*
Left Arrow (cm) 0.18 (0.03-0.91) 0.23 (0.01-1.07) 0.280 0.727 (0.593-0.822) <0.001*
Overweight BMI (n = 32)
Right Arrow (cm) 0.12 (0.01-0.31) 0.13 (0.03-0.34) 0.985 0.138 (-0.216-0.460) 0.222
Left Arrow (cm) 0.25 (0.10-0.75) 0.21 (0.02-0.88) 0.513 0.568 (0.278-0.763) <0.001*
Obese BMI (n = 14)
Right Arrow (cm) 0.14 (0.09-0.39) 0.10 (0.01-0.46) 0.124 0.430 (-0.108-0.773) 0.55
Left Arrow (cm) 0.21 (0.05-0.51) 0.18 (0.06-0.57) 0.826 0.835 (0.562-0.944) <0.001*
Note: * Significant Correlation.
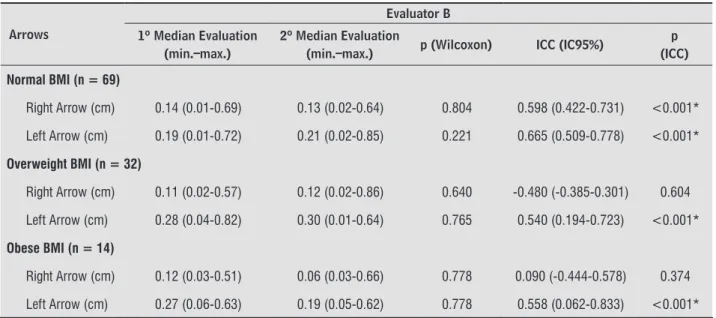
Table 1B - Results of the Vert 3D Version 1 regarding to the scoliosis arrows repeatability in the various nutritional profiles (Evaluator B)
Arrows
Evaluator B 1º Median Evaluation
(min.–max.)
2º Median Evaluation
(min.–max.) p (Wilcoxon) ICC (IC95%)
p (ICC) Normal BMI (n = 69)
Right Arrow (cm) 0.14 (0.01-0.69) 0.13 (0.02-0.64) 0.804 0.598 (0.422-0.731) <0.001*
Left Arrow (cm) 0.19 (0.01-0.72) 0.21 (0.02-0.85) 0.221 0.665 (0.509-0.778) <0.001*
Overweight BMI (n = 32)
Right Arrow (cm) 0.11 (0.02-0.57) 0.12 (0.02-0.86) 0.640 -0.480 (-0.385-0.301) 0.604
Left Arrow (cm) 0.28 (0.04-0.82) 0.30 (0.01-0.64) 0.765 0.540 (0.194-0.723) <0.001*
Obese BMI (n = 14)
Right Arrow (cm) 0.12 (0.03-0.51) 0.06 (0.03-0.66) 0.778 0.090 (-0.444-0.578) 0.374
Left Arrow (cm) 0.27 (0.06-0.63) 0.19 (0.05-0.62) 0.778 0.558 (0.062-0.833) <0.001*
Note: * Significant Correlation.
and practically perfect (between 0.9 and 1), accord-ing to Hopkins in Kotrlik (22).
Results
The group of children with a normal BMI or low weight (n = 69) had a mean BMI of 17.8 ± 2.3 kg/m², the group classified as overweight (n = 32) had a mean BMI of 22.4 ± 2.2 kg/m², and the group classified
as obese (n = 14) had a mean BMI of 26.6 ± 4.0 kg/ m². The total sample (n = 115) had a mean BMI of 20.2 ±4.0 kg/m².
720
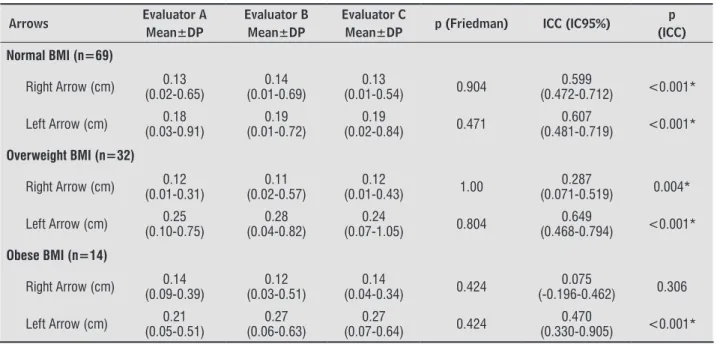
In the analysis of inter-rater reproducibility, re-gardless of nutritional status, there was no difference between the measurements of the three evaluators as well. When the correlations were calculated, only the right scoliotic arrow within the obese group showed no significant results (Table 2).
Regarding the scoliosis classification, six children had a “C” shape curvature on the right, 14 had a “C” on the left, and two were classified as having “S”
shaped scoliosis; the remaining 93 children were classified as normal for not presenting Cobb angles above 10º.
When correlating Cobb angles with Vert-3D ar -rows, no correlation was found between the scoliosis arrows on the right and the Cobb angles. However, the scoliosis arrows on the left showed moderate to high correlations (rho ranging from .31 to .60) with the Cobb angles (Table 3).
Table 2 - Results of the Vert 3D Version 1 regarding to the inter-rater reproducibility of the scoliosis arrows in the various nutritional profiles
Arrows Evaluator A
Mean±DP
Evaluator B Mean±DP
Evaluator C
Mean±DP p (Friedman) ICC (IC95%)
p (ICC) Normal BMI (n=69)
Right Arrow (cm) (0.02-0.65)0.13 (0.01-0.69)0.14 (0.01-0.54)0.13 0.904 (0.472-0.712)0.599 <0.001*
Left Arrow (cm) (0.03-0.91)0.18 (0.01-0.72)0.19 (0.02-0.84)0.19 0.471 (0.481-0.719)0.607 <0.001*
Overweight BMI (n=32)
Right Arrow (cm) (0.01-0.31)0.12 (0.02-0.57)0.11 (0.01-0.43)0.12 1.00 (0.071-0.519)0.287 0.004*
Left Arrow (cm) (0.10-0.75)0.25 (0.04-0.82)0.28 (0.07-1.05)0.24 0.804 (0.468-0.794)0.649 <0.001*
Obese BMI (n=14)
Right Arrow (cm) (0.09-0.39)0.14 (0.03-0.51)0.12 (0.04-0.34)0.14 0.424 (-0.196-0.462)0.075 0.306
Left Arrow (cm) (0.05-0.51)0.21 (0.06-0.63)0.27 (0.07-0.64)0.27 0.424 (0.330-0.905)0.470 <0.001*
Note: * Significant Correlation.
Table 3 - Results of correlation between scoliosis arrows of Vert 3D system and Cobb angles in different nutrient profiles for children with scoliosis
BMI classification rho p
Cobb x right arrows
Normal (n=69) -0.065 0.594
Overweight (n=32) -0.065 0.594
Obese (n=14) 0.462 0.096
Cobb x left arrows
Normal (n=69) 0.310 0.010*
Overweight (n=32) 0.478 0.006*
Obese (n=14) 0.602 0.023*
Children with scoliosis
Cobb Angle (°) Arrows (cm) rho p
Cobb x right arrows (n=8) 12.3 (10.4-21.9) 0.17 (0.07-0.54) -0.119 0.779
Cobb x left arrows (n=16) 11.6 (10.0-19.0) 0.40 (0.06-0.84) 0.029 0.914
721 Discussion
The Vert-3D Version 1 system showed different re-sults for repeatability and reproducibility, even with negative ICCs only for the right side, as well as corre-lations with Cobb angles, when analyzing the left and right sides, regardless of nutritional status. Negative ICCs indicate an opposite variability of the first group of measurements when comparing with the second group, indicating an undesirable result for measure-ments which one would expect to be similar. This discrepancy points to a difficulty in using the system for the evaluation of children with scoliosis. A large number of children had no obvious signs of scoliosis, with scoliosis arrows arriving at a maximum of 1 cm. In this sense, the system’s error in measurement may be as large as the magnitude of the order in which the measurements were performed. An inaccurate estimation of the line of symmetry could also justify this discrepancy. Moreover, the nutritional profile does not appear to be responsible for the varied re-sults of the left and right sides.
When assessing the influence of BMI on spinal evaluation with the Vert-3D system, moderate re-peatability and inter-rater reproducibility were found for both the overweight and obese samples on the left (Tables 1A, 1B and 2). Berryman et al. (3) observed that in extremely obese patients or those with a large mass of muscular development, erros might occur to the results of topography system (spe-cifically, the ISIS2 system), due to the difficulty of identifying and marking the necessary points of the bone. Furthermore, no studies have evaluated the influence of BMI on the variability observed during a topographic exam. Saad et al. (12), using computer-ized photogrammetry, found that increased BMI was associated with greater variability in the torso rota-tion measurements conducted by two examiners, and argued that this variability may be associated with palpation of the anatomic reference points. In the case of the Vert-3D system, the results changed when assessing the right arrows, regardless of nutritional profile, which shows that the body’s condition does not seem to affect the results.
The descriptions of repeatability and inter-rater reproducibility in other topography systems found in the literature show different outcomes. Rankine et al. (23), using a new topography instrument named Milwaukee, found excellent correlations for the “Q” angle, with an ICC of 0.99 for repeatability
and inter-rater reproducibility. Nevertheless, in this study the evaluation was performed with only one plastic mold of a patient with idiopathic scoliosis, which limits the result’s generalization because evaluating a plastic mold eliminates many factors, such as the subject’s movement, breathing, rest-ing position, and the natural variability that exists within human posture.
Liu et al. (10), also using the Milwaukee instru-ment, reported excellent (ICC = 0.88) inter-rater reproducibility when appraising the spine of 10 subjects in the frontal plane. However, when the cor-relations between the same evaluator were verified, the levels shown were simply moderate (ICC = 0.50 and 0.56). A novel three-dimensional analysis tech-nique of surface topography (BIOMODTMTM L
722
This low correlation could be due to several factors, such as: (a) the different aspects of radiographic and surface topography evaluations; (b) little varia-tion in scoliosis within the study populavaria-tion; (c) the inherent variability of the postural evaluation; and (d) the inherent difficulty of the Vert-3D system to provide results that strongly correlate with the radiological analysis.
During a qualitative exam, the torso’s surface is structured in many ways in response to the frontal spinal changes presented by the subjects. In some individuals with lateral spinal bending, the posterior torso region remains symmetric, and thus, spinal changes are not identified in the torso’s topography. In other cases, with a lateral bending of similar an-gulation, the torso’s topography and the posterior torso region present greater lateral spinal change. Thus, the relation between the torso’s surface and the spinal curvature is not directly related with the Cobb angle’s magnitude. This corroborates with Drerup (26), which states that despite the surface topography providing reproducible results (which can be used to reduce exposure to X-rays), the cor-relation with the Cobb angle is poor and, therefore, the estimate of the Cobb angle from the topography results is often considered insufficient for clinical use. However, we should not disregard the fact that the topography may be useful for evaluation of the body’s shape since, for patients with scoliosis, the aesthetics of the torso are more important than the spine’s position. This aesthetic change is not measured in standard radiography (9). And, in that sense, these noninvasive exams could complement the radiographic evaluation.
However, assuming that other instruments of pos-tural evaluation also demonstrated decent correla-tion between surface topography and radiography (27 - 30), other factors may have contributed to the low correlations seen in this study. The minor varia-tions on scoliosis found in this sample is an important factor leading to decreased correlation. Therefore, the small spectrum in terms of the types of scoliosis studied is a limitation, and restricts the generalization of the results, especially for a population displaying a larger magnitude of scoliosis.
In summary, the high correlation levels exclu-sively on the left side, for both repeatability, inter-rater reproducibility, and the correlations between Cobb angles and scoliosis arrows, reduce the pos-sibility of using the version 1 of Vert-3D system.
However, in regards to the different nutritional pro-files, there seems to be no limitation of the system in association with BMI. Considering the disparity of information between the surface topography in relation to bone structure, new studies are neces-sary to identify the most useful clinical parameters of the surface topography.
References
1. Vrtovec T, Pernus F, Likar B. A review of methods for quantitative evaluation of spinal curvature. Eur Spine J. 2009;18(5):593-607.
2. Komeili A, Westover LM, Parent EC, Moreau M, El-Rich M, Adeeb S. Surface topography asymmetry maps categorizing external deformity in scoliosis. Spine J. 2014;14(6):973-83.
3. Berryman F, Pynsent P, Fairbank J, Disney S. A new system for measuring three-dimensional back shape in scoliosis. Eur Spine J. 2008;17(5):63-72.
4. Mohokum M, Schülein S, Skwara A. The validity of rasterstereography: a systematic review. Orthop Rev (Pavia). 2015;7(3):68-73.
5. Mangone M, Raimondi P, Paoloni M, Pellanera S, Di Michele A, Di Renzo S, et al. Vertebral rotation in ado-lescent idiopathic scoliosis calculated by radiograph and back surface analysis-based methods: correlation between the Raimondi method and rasterstereogra-phy. Eur Spine J. 2013;22(2):367-71.
6. Sadani S, Jones C, Seal A, Bhakta B, Hall R, Levesley M. A pilot study of scoliosis assessment using radia-tion free surface topography in children with GMFCS IV and V cerebral palsy cch. Child Care Health Dev. 2012;38(6):854-62.
7. Hackenberg L, Hierholzer E, Pötzl W, Götze C, Liljen -qvist U. Rasterstereographic back shape analysis in idiopathic scoliosis after posterior correction and fu-sion. Clin Biomech (Bristol, Avon). 2003;18(10):883-9.
8. Goldberg CJ, Kaliszer M, Moore DP, Fogarty EE, Dowl -ing FE. Surface topography, Cobb angles, and cos-metic change in scoliosis. Spine (Phila Pa 1976). 2001;26(4):E55-63.
723 10. Liu XC, Tassone JC, Thometz JG, Paulsen LC, Lyon RM,
Marquez-Barrientos C, et al. Development of a 3-di-mensional back contour imaging system for monitor-ing scoliosis progression in children. Spine Deform. 2013;1(2):102-7.
11. Zubovic A, Davies N, Berriman F, Quraishi N, Lavy C, Bowden G, et al. New method of scoliosis deformity assessment ISIS-2 system. Spine J. 2008;8:1S-191S.
12. Saad KR, Colombo AS, Ribeiro AP, João SM. Reli -ability of photogrammetry in the evaluation of the postural aspects of individuals with structural sco-liosis. J Bodyw Mov Ther. 2012;16(2):210-6.
13. Harlick JC, Milosavljevic S, Milburn Pd. Palpation identification of spinous processes in the lumbar spine. Man Ther. 2007;12(1):56-62.
14. Degenhardt BF, Snider KT, Snider EJ, Johnson JC. In -terobserver reliability of osteopathic palpatory di-agnostic tests of the lumbar spine: improvements from consensus training. J Am Osteopath Assoc. 2005;105(10):465-73.
15. Thometz JG, Liu XC, Lyon R, Harris GF. Variability in three-dimensional measurements of back contour with Raster stereography in normal subjects. J Pedi-atr Orthop. 2000;20(1):54-8.
16. Instituto Brasileiro de Geografia e Estatítica – IBGE. Contagem da População; 2007 [cited 2013 Jun 15]. Available from: http://www.ibge.gov.br/.
17. Cole TJ, Bellizzi MC, Flegal KM, Dietz WH. Estab -lishing a standard definition for child overweight and obesity worldwide: international survey. BMJ. 2000;320(7244):1240-3.
18. Gstoettner M, Sekyra K, Walochnik N, Winter P, Wachter R, Christian M. Inter- and intraobserver reliability assessment of the Cobb angle: manual versus digital measurement tools. Eur Spine J. 2007;16(10):1587-92.
19. Zhang J, Lou V, Le LH, Hill DL, Raso JV, Wang Y. Auto -matic Cobb measurement of scoliosis based on fuzzy Hough transform with vertebral shape prior. J Digit Imaging. 2009;22(5):463-72.
20. Miotec. Vert 3D: Manual do usuário da Miotec Equipa-mentos Biomédicos. Revisão B. Porto Alegre: Miotec Equipamentos Médicos Ltda; 2010. 35 p.
21. Fleiss RL. The design and analysis of clinical experi-ments. New York: John Wiley and Sons; 1986.
22. Kotrlik JW, Williams HA. The incorporation of effect size in information technology, learning, and performance research. Inf Technol Learn Perform J. 2003;21(1):1-7.
23. Rankine L, Liu XC, Tassone C, Lyon R, Tarima S, Thometz J. Reproducibility of newly developed spinal topog-raphy measurements for scoliosis. Open Orthop J. 2012;6:226-30.
24. Sèze M, Randriaminahisoa T, Gaunelle A, Korvin G, Mazaux JM. Inter-observer reproducibility of back surface topography parameters allowing assess-ment of scoliotic thoracic gibbosity and comparison with two standard postures. Ann Phys Rehabil Med. 2013;56(9-10):599-612.
25. Don V, Capodaglio P, Cimolin V, Benedetti Mg, D’Osualdo F, Frigo C, et al. Instrumental measures of spinal function: is it worth? A state-of-the art from a clinical perspective. Eur J Phys Rehabil Med. 2012;48(2):255-73.
26. Drerup B. Rasterstereographic measurement of sco-liotic deformity. Scoliosis. 2014;12(9):1-22.
27. Frerich JM, Hertzler K, Knott P, Mardjetko S. Compari -son of radiographic and surface topography measure-ments in adolescents with idiopathic scoliosis. Open Orthop J.2012;6:261-5.
28. Schulte TL, Hierholzer E, Boerke A, Lerner T, Liljen-qvist U, Bullmann V, et al. Raster stereography versus radiography in the long-term follow-up of idiopathic scoliosis. J Spinal Disord Tech. 2008;21(1):23-8.
29. Zubovic A, Davies N, Berryman F, Pynsent P, Quraishi N, Lavy C, et al. New method of scoliosis deformity as-sessment: ISIS2 system. Stud Health Technol Inform. 2008;140:157-60.
30. Thometz JG, Lamdan R, Liu XC, Lyon R. Relationship between Quantec measurement and Cobb angle in patients with idiopathic scoliosis. J Pediatr Orthop. 2000;20(4):512-6.
Received in 11/23/2015
Recebido em 23/11/2015
Approved in 03/13/2017