CROP PROTECTION
Sampling Plan for Thrips (Thysanoptera: Thripidae) on Cucumber
L
EANDROB
ACCI, M
ARCELOC. P
ICANÇO, M
ARCELOF. M
OURA, A
LTAIRA. S
EMEÃO, F
LÁVIOL. F
ERNANDES ANDE
LISANGELAG.F. M
ORAISDepto. Biologia Animal, Univ. Federal de Viçosa, 36570-000, Viçosa, MG bacci@pq.cnpq.br Neotropical Entomology 37(5):582-590 (2008)
Plano de Amostragem para Tripes (Thysanoptera: Thripidae) em Pepino
RESUMO - Este trabalho determina a melhor técnica, unidade amostral e o número de amostras para compor um plano de amostragem para os tripes Frankliniella schultzei (Trybom) e Thrips palmi (Karny) em pepino. A efi cácia de três técnicas de amostragem: batida de folhas em bandeja plástica branca, contagem direta de insetos na face inferior das folhas e coleta de folhas em sacola plástica foi comparada em nove cultivos comerciais de pepino, empregando três unidades amostrais (uma folha de ramo localizado nos terços apical, mediano e basal do dossel da planta). Baseado na variância relativa e precisão econômica dos melhores sistemas amostrais (melhores técnicas e unidades amostrais), calculou-se o número de amostras para a composição do plano de amostragem convencional. O sistema mais adequado para a amostragem de F. schultzei em pepino foi a contagem direta de insetos em folha do terço apical do espaldeiramento. Para tanto, deve-se amostrar uma folha por planta em 38 plantas/lavoura. Para a amostragem de T. palmi, o melhor sistema foi a batida de folha do terço apical do espaldeiramento em bandeja plástica. Na amostragem conjunta das duas espécies, o sistema mais adequado foi a contagem direta dos insetos em folha do terço apical do espaldeiramento. Nesse caso, amostra-se uma folha por planta, em 35 plantas/ lavoura. Estes resultados facilitam a tomada de decisão no manejo de tripes em pepino, agregando os benefícios da decisão correta para adoção ou não de práticas de redução populacional.
PALAVRAS-CHAVE: Cucumis sativus, Frankliniella schultzei, Thrips palmi, tomada de decisão, distribuição binomial negativa
ABSTRACT - This work determines the best technique, sampling unit and the number of samples to compose a sampling plan for Frankliniella schultzei (Trybom) and Thrips palmi (Karny) (Thysanoptera: Thripidae) on cucumber. The effi cacy of three sampling techniques: leaf beating on a plastic tray, direct counting of insects on the lower leaf surface, and whole leaf collection in bags were compared in nine commercial cucumber crops using three sampling units (a leaf from a branch located in the apical, median or basal third of the canopy). The number of samples was determined based on the relative variance and the economic precision for the best technique and sampling unit. The direct counting of insects on the apical third of the plant canopy was the best sampling technique for F. schultzei based on one leaf surveyed per plant using 38 plants per fi eld. The best sampling technique for T. palmi was the leaf beating on a tray using one leaf of the apical third per plant and 35 plants per fi eld. When joining both species, the best sampling system was the direct counting on the apical third, and it requires sampling one leaf per plant using at least 35 plants per fi eld. These results facilitate the decision-making for the management of thrips on cucumber and aggregate the benefi ts of the correct decision for the adoption of strategies for population reduction.
KEY WORDS: Cucumis sativus, Frankliniella schultzei, Thrips palmi, decision-making, negative binomial distribution
The thrips Frankliniella schultzei (Trybom) and Thrips palmi (Karny) are important pests in several crops across tropical and subtropical regions (Kawai 2001). In temperate regions, these insects are important pests of ornamental plants and vegetables growing in greenhouse conditions (Nakashima et al. 2004). Some studies show that these species can reduce cucumber production after damaging
become deformed and attain low commercial value (Kiers et al. 2000). Indirectly, these species can transmit pathogenic agents such as Tospovirus in ornamental, fruit, and vegetable crops (German et al. 1992, Rezende et al. 1997).
Thrips’ control is hard to accomplish because of their minute size, high ability to escape and to refuge, high reproductive rate, and low sensibility to insecticides. Also, the wide host plant range reduces the effi ciency of control methods (Kiers et al. 2000, Kawai 2001). The main control method used is the chemical control, in spite of the chances of rapidly evolving resistance (Immaraju et al. 1992). Besides, it is widely known that the massive use of insecticides may contaminate water, air and soil and may also interfere in the atmosphere and human health (Dent 1993). An alternative that can be used to reduce the pesticide side-effects is the integrated pest management (IPM). Following this approach, insect-populations are classifi ed according to whether they are above or below a certain density, and curative treatment is taken every time the mean density is higher than an economic threshold (ET) (Pedigo 1988, Dent 1993).
Sampling plans adopted to determine population levels of pests use either a fi xed number of samples (hereafter called standardized) or a variable number of samples (sequential sampling) (Gusmão et al. 2005). The standardized sampling plan requires maximum labor and expense because the same number of samples is taken regardless of pest density. The standardized sampling plan is required for determining essential parameters necessary to build decision-making of IPM such as: sampling unit, number of samples, and sampling method. In addition, standardized sampling plans are models for the validation of sequential plans (Pedigo & Zeiss 1996, Gusmão et al. 2005).
In order to take the decision to control a given pest using an effi cient and low cost method, the sampling technique that best estimates the insect density should consider precision, cost and statistical distribution of the data (Gomez & Gomez 1984, Pedigo 1988, Schuster 1998). Among the sampling techniques most used to determine insect densities in vegetable leaves are: leaf beating on trays (Pedigo 1988, Gusmão et al. 2005), direct counting (Gusmão et al. 2005), and leaf bagging (Moura et al. 2003). However, the precision of these techniques for population determination of F. schultzei and T. palmi in cucumber crops is unknown. Additionally, there may also be differences among leaves located in different canopy positions. To consider the possibility of choosing a particular leaf from one position as a sampling unit means that it will refl ect the infestation of the pests in the fi eld even though we are taking relative instead of absolute sampling.
The objective of this work was to determine the best sampling unit, sampling technique, and number of samples to generate standardized sampling plans for F. schultzei and T. palmi infesting cucumber.
Material and Methods
This work was carried out in nine cucumber fi elds of approximately one hectare each, located in Tocantins County,
Minas Gerais State, Brazil (21°11’15’’S; 42°03’45’’W), from July to December 2000. Plants were spaced 50 cm between rows and 100 cm between stems. Practices such as watering, fertilizer application, and weed control were similar to those applied by other growers in the region. The fi elds did not receive insecticide or fungicide sprays. Some specimens of thrips were collected in these fi elds, and taken to the laboratory for later identifi cation using taxonomic key and morphological characterization according to Monteiro et al. (2001a, b).
The treatments, each composed by the combination of one technique and one sampling unit were arranged in a factorial scheme of 3 × 3 (techniques × sampling unit). The experimental design was a randomized complete block with nine replicates (plots or production fi elds).
In each plot, 200 plants were randomly surveyed. In 150 of these plants all three techniques were applied and the respective sampling units were collected. For the other 50 plants, only two techniques (leaf beating on tray and direct counting) were applied and the respective sampling units collected. Consequently, each system composed by leaf beating on tray or direct counting, and the respective sampling units, resulted in 1,800 samples [200 samples (150 + 50) x 9 plots]. On the other hand, the systems composed by leaf bagging in plastic bag and the sampling units resulted in 1,350 samples (150 samples x nine plots) (see column 3 in Table 1).
In each plot, 1,650 samples were collected being nine samples per plant (three techniques x three sampling units) in 150 plants and six samples per plant (two techniques x three sampling units) in 50 plants. On each sampling date (18 dates total), the densities of F. schultzei and T. palmi were evaluated. A grid pattern was used to collect samples, and the fi rst plant of the southeast quadrant of the fi eld was evaluated. A similar distance between surveyed plants was kept constant (5 m spacing between plants and 5 m spacing between rows). The placement of the surveyed plants was even distributed to avoid bias in the choice of the sampling place.
Sampling technique and sampling unit. Three sampling techniques were studied: leaf beating on white plastic tray (LBPT) (35 cm length × 30 cm width × 5 cm of depth), direct counting of insects (DC) on the abaxial leaf surface, and whole leaf collection (WLC). The sampling units consisted of taking a leaf from either the apical, median, or basal third of the plant canopy (Moura et al. 2003).
The best sampling systems were determined for sampling each thrips species and both species simultaneously. The fi rst step was to estimate the relative variance (RV) using the expression RV = [100*S(x)]/x (Pedigo et al. 1982); where RV stands for relative variance (%), S(x) for mean standard deviation, and x for population mean. The economic precision (EP) of each sampling system was estimated using the expression EP = 100/(RV*Sc) according to Kogan & Herzog (1980), where Sc stands for sampling costs (US $ per sample). According to Southwood (1978), sampling systems with RV greater than 25% have low precision estimates. Thus, the EP was not calculated for the systems that had RV higher than 25%. The EP indicates the best system based on the variability of the sampling data and Sc.
The best system was selected considering the lowest RV and highest EP. The Sc was calculated in accordance with the expression Sci= Fci + (Mc*ti); where Sci is the sampling cost for the ith sampling system; Fci is the fi xed cost of materials for the ith sampling system; Mc is the man labor cost per second and tiis the time spent (in seconds) for the evaluation of a sample in the ith sampling system plus the average time spent (in seconds) to move from a point to another within the fi eld (40.97s). The procedure considered fi xed costs for materials and man labor. The man labor cost for sampling was calculated using the time spent on each sample (insect counting plus movement from one sample to another). The time labor using the WLC technique was the sum of the time spent on moving from one sample to another plus the time to evaluate the leaf in the laboratory. Each material (surveyor’s table, tray, pencil and eraser) was cost-estimated based for one crop season (16 weeks) and eight plots. Mc was calculated based on the wage paid per hour to one pair of samplers in Brazil (US$9.50).
Data (density, time, cost and EP) of each system were tested for normal distribution using the Lilliefors test (P = 0.05) (PROC TESTE-LF; SAEG Software, 2001) and submitted to analysis of variance (ANOVA) (PROC ANOVAG; SAEG Software, 2001). Sampling systems were compared by the Scott-Knott test (P < 0.05) (PROC
TESTE-MD; SAEG Software, 2001) and the results were utilized to select the best method to be used in the standardized sampling plan of the species F. schultzei and T. palmi alone and together (total density of both species).
Determination of the sample size for a standardized sampling plan for F. schultzei and T. palmi. Once the best sampling technique was chosen, the sample sizes of the standardized sampling plan were determined. Initially the b coeffi cient of Taylor’s power law, which indicates the theoretical frequency distribution to which the data will possibly fi t, was calculated through the linear relationship between the estimated mean (mi) and their estimated variance (Si2)after natural log transforma-tion (Ln Si2 = Lna + bLnmi) according to Taylor (1961). A b >
1 is indicative of negative binomial frequency distribution, a b = 1 implies Poisson distribution, and a b < 1 indicates positive binomial distribution (Navas et al. 1994). Furthermore, the estimated results from the theoretical frequency distribution models indicated by Taylor’s power law were tested against the observed frequencies using the Chi-square test (Ludwig & Reynolds, 1988). This procedure was carried out using the ENSTAT software (Pedigo & Zeiss 1996).
Based on the adjustment for the frequency of the data distribution, the next step was to estimate the number of samples. The number of samples to estimate the populations of thrips was obtained through the equation Ns = [1/C2*(1/μ
+ 1/k)] from Young & Young (1998), where Ns = number of samples, C = level of precision, μ = mean of the population and k = parameter of the negative binomial distribution.
For the selection of the level of precision to be used in the sampling plan, initially the kpartials (kp) of each fi eld were calculated in accordance to the aggregation level of the data based on the equation k = [x2/(S2-x)], where k = parameter of
negative binomial distribution, S2 = estimated variance and
x = estimated mean.
The kpartials of each fi eld were then used to calculate the sample size by applying regression against precision levels of 5, 10, 15, 20 and 25% and selecting the level of precision where the number of samples presented low variation Average (± standard deviations), in each column, followed by the same letter do not differ among themselves by the Scott-Knott test at P< 0.05.
Table 1. Densities of F. schultzei,T. palmi, and total of thrips as a function of the sampling technique and leaf position within plant canopy estimation from nine cucumber fi elds.
Technique Part of the plant
canopy
Number of samples
Insects per sample
F. schultzei T. palmi Total thrips
Beating tray method
Apical 1800 1.36 ± 0.10 b 2.41 ± 0.16 a 3.77 ± 0.21 a
Median 1800 0.54 ± 0.06 c 2.13 ± 0.23 a 2.67 ± 0.24 a
Basal 1800 0.32 ± 0.12 c 0.73 ± 0.09 b 1.05 ± 0.15 b
Direct counting
Apical 1800 2.70 ± 0.11 a 0.18 ± 0.02 b 2.88 ± 0.11 a
Median 1800 1.57 ± 0.07 b 0.17 ± 0.02 b 1.74 ± 0.08 b
Basal 1800 0.57 ± 0.04 c 0.08 ± 0.03 b 0.65 ± 0.05 b
Plastic bag
Apical 1350 1.39 ± 0.10 b 3.58 ± 0.30 a 4.97 ± 0.34 a
Median 1350 0.87 ± 0.09 c 2.36 ± 0.22 a 3.23 ± 0.25 a
(Gusmão et al. 2005). The maximum variation admitted was determined by the Fisher test (P < 0.05) between the greatest precision level (25%) and the other levels in decreasing order. The lowest precision level that did not differ from 25% was considered suitable for the calculation of the number of samples. The common aggregation parameter K [kcommon (kc)] for the whole data set was determined according to the method of Bliss and Owen (1958).
Results
Sampling technique and sampling unit. The sampling systems were signifi cantly different (P < 0.05) when different sampling techniques and sampling units were used. The differences occurred with all the variables tested, i.e., F. schultzei (F8, 64 = 4.63, P < 0.001), T. palmi (F8, 64 = 4.86, P < 0.001) and total density of both species (F8, 64 = 3.77, P = 0.001). Among the techniques studied, the DC was the best on estimating F. schultzei’s density on the upper canopy. The highest densities of T. palmi were detected by LBPT and by WLCof the apical and median thirds of the canopy. For the total number of thrips, the highest densities were
detected by DC on leaf of the apical third of the canopy and by LBPT and WLCof the apical and median thirds of the canopy (Table 1).
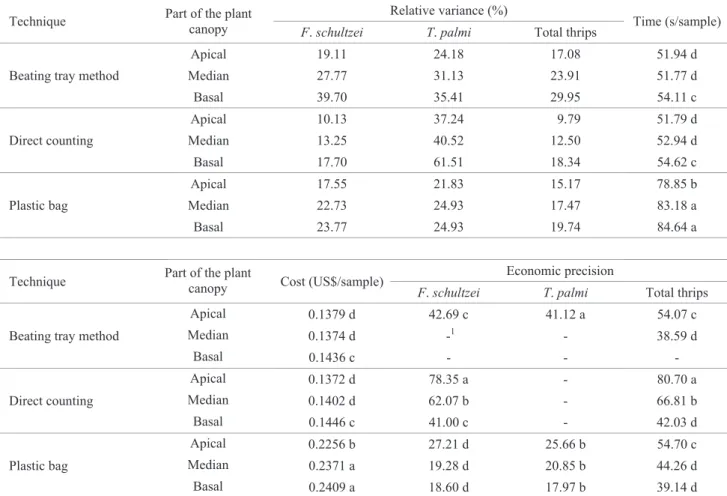
The sampling systems with relative variances lower than 25% (Southwood 1978) for F. schultzei were: LBPT of the apical third of the canopy (RV = 19.11), DC on leaf of the apical (RV = 10.13), median (RV = 13.25) and basal (RV = 17.70) thirds of the plant canopy and WLC of the apical (RV = 17.55), median (RV = 22.73) and basal (RV = 23.77) thirds of the plant canopy. For T. palmi were: LBPT of the apical third (RV = 24.18) of the plant canopy and WLC of the apical (RV = 21.83), median (RV = 24.93) and basal (RV = 24.93) third of the plant canopy. For the joint sampling, the only system that showed relative variance greater than 25% was LBPT of the basal third of the plant canopy (Table 2).
A signifi cant effect (P < 0.05) of the sampling system was verifi ed on time (F8, 529 = 352.27, P < 0.001) and the cost (F8, 529 = 520.01, P < 0.001) of sampling thrips. The sampling systems with reduced time and cost per sample were LBPT and DC on leaf of apical and median thirds of the plant canopy (Table 2).
Significant differences (P < 0.05) of the sampling systems were detected in the economic precision (EP) of the
Averages, in each column, followed by the same letter do not differ among themselves by the Scott-Knott test at P < 0.05.
1 These values were not determined since their relative variance was greater than 25%.
Table 2. Relative variance, time, cost and economic precision of sampling of F. schultzei, T. palmi and total thrips as a function of the sampling technique and leaf position within plant canopy from nine cucumber fi elds.
Technique Part of the plant canopy Relative variance (%) Time (s/sample)
F. schultzei T. palmi Total thrips
Beating tray method
Apical 19.11 24.18 17.08 51.94 d
Median 27.77 31.13 23.91 51.77 d
Basal 39.70 35.41 29.95 54.11 c
Direct counting
Apical 10.13 37.24 9.79 51.79 d
Median 13.25 40.52 12.50 52.94 d
Basal 17.70 61.51 18.34 54.62 c
Plastic bag
Apical 17.55 21.83 15.17 78.85 b
Median 22.73 24.93 17.47 83.18 a
Basal
Part of the plant canopy
Apical
Median Basal
Apical
Median Basal
Apical
Median Basal
23.77 24.93 19.74 84.64 a
Technique Cost (US$/sample) Economic precision
F. schultzei T. palmi Total thrips
Beating tray method
0.1379 d 42.69 c 41.12 a 54.07 c
0.1374 d -1 - 38.59 d
0.1436 c - - -
Direct counting
0.1372 d 78.35 a - 80.70 a
0.1402 d 62.07 b - 66.81 b
0.1446 c 41.00 c - 42.03 d
Plastic bag
0.2256 b 27.21 d 25.66 b 54.70 c
0.2371 a 19.28 d 20.85 b 44.26 d
samplings of F. schultzei (F6, 48 = 31.86, P < 0.001), T. palmi (F3, 24 = 9.68, P < 0.001) and the total thrips (F7, 56 = 10.65, P < 0.001). The DC system on a leaf from the apical third of the canopy had greater economic precision for sampling of F. schultzei and joint sampling of thrips (EP = 78.35; EP = 80.70, respectively). The greatest EP was found with LBPT from the apical third of the canopy (EP = 41.12) for T. palmi (Table 2). Therefore, based on the economic precision, the best sampling system for F. schultzei and the two species together was DC on a leaf from the apical third of the canopy. For T. palmi, it was LBPT of the apical third of the canopy was best.
Determination of the number of samples to compose the conventional sampling plan. The coeffi cient b of Taylor’s power law for sampling F. schultzei, T. palmi and for both thrips, for the selected sampling systems, was not lower than 1 (Fig. 1). This result indicates that the fi eld data tend to fi t the Poisson distribution (b equal to 1) or negative binomial distribution (b is greater than 1) (Taylor 1961).
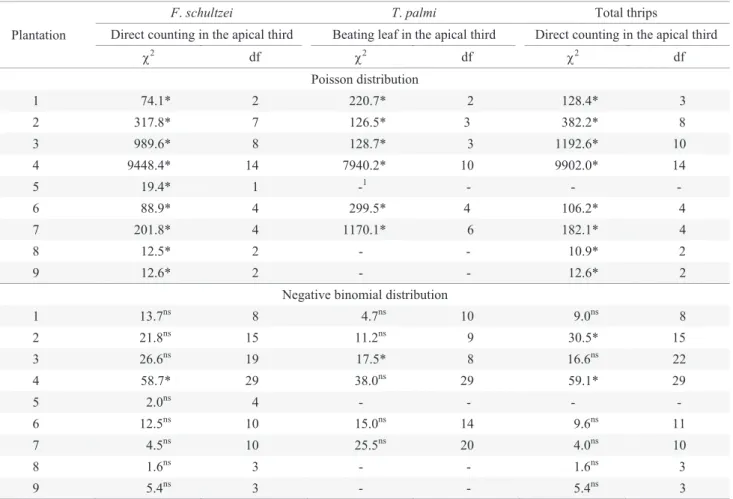
Indeed the Chi-square test detected that the densities of F. schultzei sampled by DC on a leaf of the apical third of the plant canopy fi t the binomial distribution in eight out of
nine tested plantations (Table 3); T. palmi sampled by LBPT of the apical third fi t the negative binomial distribution in fi ve out of six tested plantations; and total thrips sampled by DC on a leaf of the apical third fi t the negative binomial distribution in six out of eight tested plantations. Since data adjustment to one statistical distribution is used to select the formula to calculate the number of samples necessary for adequate sampling (Young & Young 1998), the number of samples was calculated according to the negative binomial distribution, which involves the average, the precision level and parameter k of the distribution.
The number of samples needed to estimate F. schultzei and the total thrips for the selected systems (DC in the apical third) stabilized at 20% precision (Fig. 2). The results indicate that this is the lowest precision level where the number of samples presented low variation, and should be used to calculate the sample size. For T. palmi, the number of samples stabilized at 10% precision.
The DC of F. schultzei and the total thrips on leaves of the apical third of the plant canopy had common aggregation parameters (kcommon= 0.8616 and kcommon= 0.9545). The same did not occur for T. palmi sampled by LBPT of the apical third (Table 4).
Plantation
F. schultzei T. palmi Total thrips
Direct counting in the apical third Beating leaf in the apical third Direct counting in the apical third
χ2 df χ2 df χ2 df
Poisson distribution
1 74.1* 2 220.7* 2 128.4* 3
2 317.8* 7 126.5* 3 382.2* 8
3 989.6* 8 128.7* 3 1192.6* 10
4 9448.4* 14 7940.2* 10 9902.0* 14
5 19.4* 1 -1 - - -
6 88.9* 4 299.5* 4 106.2* 4
7 201.8* 4 1170.1* 6 182.1* 4
8 12.5* 2 - - 10.9* 2
9 12.6* 2 - - 12.6* 2
Negative binomial distribution
1 13.7ns 8 4.7ns 10 9.0ns 8
2 21.8ns 15 11.2ns 9 30.5* 15
3 26.6ns 19 17.5* 8 16.6ns 22
4 58.7* 29 38.0ns 29 59.1* 29
5 2.0ns 4 - - - -
6 12.5ns 10 15.0ns 14 9.6ns 11
7 4.5ns 10 25.5ns 20 4.0ns 10
8 1.6ns 3 - - 1.6ns 3
9 5.4ns 3 - - 5.4ns 3
1df values were zero, not allowing statistical estimation of the distributions.
*Signifi cant at 5% probability level; nsNon signifi cant at 5% probability level.
Table 3. Chi-square test (χ2) between observed and expected frequencies by Poisson and negative binomial distributions
The number of samples necessary to adequately estimate populations of F. schultzei and the total thrips by DC on a leaf of the apical third of the plant canopy was 38 and 35 samples per plantation, respectively. Time spent was 32.8 and 30.21 minutes per sampling, with an estimated cost of US$ 4.80 and 4.42 per sampling, respectively. Since T. palmi sampled by LBPT of the apical third did not have a kcommom, the number of necessary samples was calculated by the average of the number of samples using the kpartiais. In this case, the number of necessary samples was very high, which resulted in an unworkable plan due to the time spent
(1375.67 min per sampling) and the high cost (US $ 201.87 per sampling) (Table 4). The criterion adopted to select the number of samples to be part of the sampling plan was the feasibility of use. The goal was to use a minimum number of samples without compromising the man power necessary to perform other important activities such as fertilizer application, irrigation, disease and weed control, staking, harvest, etc. (Pedigo 1988)
Natural logarithm of the average
Natural logarithm of the variance
-0.7 0.0 0.7 1.4 2.1
0 3
6 (Y' = 0.93 + 1.46X; R2 = 0.96; F = 165.12; P < 0.001) F. schultzei (Direct counting in the apical third) A
-2.2 -1.1 0.0 1.1 2.2
0 3
6 (Y' = 2.10 + 1.47X; R
2 = 0.92; F = 76.98; P < 0.001) T. palmi (Beating leaf in the apical third) B
(Y' = 0.89 + 1.46X; R2 = 0.97; F = 195.27; P < 0.001)
-0.7 0.0 0.7 1.4 2.1
0 3 6
Total thrips (Direct counting in the apical third) C
Fig. 1. Natural logarithm of the variance (Ln S2) as function
of natural logarithm of the average number (Ln X) of thrips on the apical third. (A) adults of F. schultzei by direct counting (DC), (B) adults of T. palmi by leaf beating on plastic tray (LBPT) leaf, and (C) adults of total thrips by direct counting.
Precision level
Number of samples/ plantation
0 400 800 1200
Y' = 52.48 + 4285.60e-0,33X
R2 = 0.997; F = 1059.42; P < 0.001
F. schultzei (Direct counting in the apical third)
* * *
A
0 3000 6000 9000
T. palmi (Beating leaf in the apical third) Y' = 373.52 + 30499.52e-0,33X
R2 = 0.997; F = 1059.70; P < 0.001
* * * * * * *
B
5 10 15 20 25
0 400 800 1200
Y' = 37.71 + 3079.87e-0,33X
R2 = 0.997; F = 1058.86; P < 0.001
Total thrips (Direct counting in the apical third)
* * *
C
Discussion
The observation of higher densities of F. schultzei by DC occurred possibly because this technique allows better visualization of the insect which is not disturbed during the sampling. This species possibly shows a better ability for holding to the plant or a good ability to fl y when the leaves are shaken during LBPT. This fact would explain the lower densities observed when sampling by LBPT and WLC. On the other hand, observation of T. palmi by DC is more diffi cult likely due to the light color of this species resulting in a reduction of the contrast with the leaf when observed in the fi eld. This problem is solved when leaves are collected and taken to the laboratory where the insects are observed under artifi cial light. This seems to be true since greater densities were found when leaves are collected in plastic bags and taken to the laboratory where the insects are counted directly. Contrary to F. schultzei, T. palmi seems to have less ability to hold itself to the plant since the density of this species is greater when sampled by LBPT. When sampling both species at the same time, an additional and compensatory effect occurs in relation to these observations. This effect results in higher densities observed on young leaves sampled by any of the three techniques.
Independently of the technique, the higher densities of thrips were found in the younger leaves of the plant. Possibly this is due to the morphological, chemical and nutritional characteristics associated with these leaves. These data agree with those of other authors such as Kogel De et al. (1997a, b) and Kawai (2001). Overall, younger leaves of cucumber are more adequate for the thrips as found in the preference studies. The differences between young and old leaves have considerable effects on the oviposition, growth, and development of insects (Kogel De et al. 1997a, b).
The lower relative variances found in this study for sampling F. schultzei by LBPT, DC and WLC of the apical
third are due to the great densities of the insects in these samplings systems since the relative variance is inversely proportional to the densities (Pedigo 1988). DC on leaf and the WLC of the median and basal thirds showed low relative variances despite lower densities found. This can be explained by the reduced standard error associated with these two systems. Both trends also occurred with T. palmi. For the joint sampling of thrips, the lowest relative variances were associated mainly with great densities since the density is the sum of the two species densities.
The labor component of a sampling plan represents the major cost (97% in this study). The relatively quick systems such as LBPT and DC on the apical and median third spent less time and therefore had lower associated costs than the WLC because more operations are required by this last method (bagging, leaf collection, fastening of plastic bag, leaf removal from the plastic bag and evaluation). The LBPT and DC systems in the basal third were more time-consuming than in the other upper two thirds. This result comes from the time spent by the sampler to bend and to evaluate the plants.
The most suitable system for sampling F. schultzei and the total of thrips was the DC on leaves of the apical third of the plant canopy since this system combined high precision, quick data collection and low cost. The more suitable system for sampling T. palmi was LBPT of the apical third. The systems that used plastic bags, in spite of having low relative variances, were not suitable for sampling the thrips since they spend a lot of time and are of high cost. Even though the more suitable system for sampling T. palmi was LBPT of the apical third, it is worth highlighting that in situations where both species are present, DC on leaves of the apical third of the plant canopy should be used as the sampling system.
The great incidence of data that adjusted to the negative binomial distribution was due to the high frequency of samples with extreme densities (low or high). Consequently, Table 4. Residual degrees of freedom, F test, kcommon, number of samples, time (min/sampling) and cost (US$/sampling) of the sampling system of F. schultzei, T. palmi and total thrips on cucumber crop.
1k
common was not determined since the inclination of the F test was not signifi cant. 2Numbers of samples calculated with the precision level of 20%.
3Numbers of samples calculated with the precision level of 10% and with the average of the number of samples calculated with
the kparcials.
*Signifi cant at 5% probability level; nsNon signifi cant at 5% probability level.
Parameter
F. schultzei T. palmi Total thrips
Direct counting in the
apical third Beating leaf in the apical third
Direct counting in the apical third
Residual degrees of freedom 6 6 6
F test (inclination) 21.68* 1.49ns 25.76*
F test (intercept) 1.48ns 0.10ns 1.85ns
kcommon 0.8616 -1 0.9545
Number of samples 382 15893 352
Time (min) 32.8 1375.67 30.21
variances greater than the average are obtained, and the larger is the quotient between variance and average, the higher are the values of parameter k of the negative binomial distribution (Taylor 1984). This was also observed in the present work. This adjustment indicates that the sampling data have a pattern of aggregate statistical distribution.
A sampling system has a parameter kcommom of negative binomial distribution if the homogeneity curves show signifi cant inclination and non-signifi cant intercepts. Young & Young (1998) found that different populations present distinct values of the parameter k of the negative binomial distribution, thus resulting in different numbers of samples for each population. However, the selected systems for the economic precisions for F. schultzei and the total of thrips showed kcommon involving variances that occurred in the populations of the different plantations. This allows the determination of a sampling plan adequate to several plantations. The sampling of T. palmi did not show kcommon resulting in a different number of samples for each plantation. The number of samples was calculated by the kpartials of each plantation which resulted in a very high number.
The sampling plans for F. schultzei and the total thrips can be considered feasible according to the criteria described by Pedigo (1988) since they allow the collection, processing of the data and decision-making in one day, besides being of low cost. However, the sampling plan for T. palmi is unviable because it needs a high number of samples, spending time and increasing the cost. Thus, this species must be sampled along with F. schultzei.
Applying the sampling strategies advocated herein to decision-making to control thrips on cucumber will reduce the amount of insecticide spraying, time and cost, and damage to the environment and human health. These benefi ts are increasingly important in pest management where contamination by toxic residues and production costs concern the agricultural sector. Thus, it is expected, with the adoption of these sampling plans in the cucumber crop, great benefi t to the vegetable growers as observed in other vegetables crops where similar plans have been adopted.
Acknowledgments
We thank Dr. David Hoeinghaus (Kansas State University) for critically reading a draft of the manuscript and the manuscript referees were greatly appreciated. This research received fi nancial support from CAPES, Conselho Nacional de Desenvolvimento Científi co e Tecnológico (CNPq), and from Fundação de Amparo à Pesquisa de Minas Gerais (FAPEMIG).
References
Bliss, C.L. & A.R.G. Owens. 1958. Negative binomial distributions with a common k. Biometrika 45: 37-58.
Dent, J.B. 1993. Potential for systems simulation in farming systems, p.325-339. In F.P. de Vries, P. Teng & K. Metselaar (eds.), Systems approaches for sustainable agricultural
development. Kluwer Academic Publishers and International Rice Research Institute, Dordrecht, 542p.
German, T.L., D.E. Ullman & J.W. Moyer. 1992. Tospoviruses: Diagnosis, molecular biology, phylogeny and vector relationships. Annu. Rev. Phytopathol. 30: 315-348.
Gomez, K.A. & A.A. Gomez. 1984. Statistical procedures for agricultural research. John Wiley, New York, 680p.
Gusmão, M.R., M.C. Picanço, J.C. Zanuncio, D.J.H. Silva & J.A.F. Barrigossi. 2005. Standardised sampling plan for Bemisia tabaci (Homoptera: Aleyrodidae) in outdoor tomatoes. Sci. Hortic. 103: 403-412.
Immaraju, J.A., T.D. Paine, J.A. Bethke, K.L. Robb & J.P. Newman. 1992. Western flower thrips (Thysanoptera: Thripidae) resistance to insecticides in coastal Californian greenhouses. J. Econ. Entomol. 85: 9-14.
Kawai, A. 2001. Population management of Thrips palmi Karny. Jpn. J. Appl. Entomol. Zool. 45: 39-59 (in Japanese with English summary).
Kiers, E., W.J. Kogel De, A. Balkema-Bloomstra & C. Mollema. 2000. Flower visitation and oviposition behavior of Frankliniella occidentalis (Thysan.: Thripidae) on cucumber plants. J. Appl. Entomol. 124: 27-32.
Kogan, M. & D.C. Herzog. 1980. Sampling methods in soybean entomology. Springer-Verlag, New York, 587p.
Kogel De, W.J., A. Balkema-Boomstra, M. Van Der Hoek & C. Mollema. 1997a. Resistance to Western fl ower thrips in greenhouse cucumber: effect of leaf position and plant age on thrips reproduction. Euphytica 94: 63-67.
Kogel De, W.J., M. Van Der Hoek & C. Mollema. 1997b. Oviposition preference of Western fl ower thrips for cucumber leaves from different positions along the plant stem. Entomol. Exp. Appl. 82: 283-288.
Ludwig, J.A. & J.F. Reynolds. 1988. Statistical ecology: a primer on methods and computing. John Wiley, New York, 337p.
Marquis, R.J., I.R. Diniz & H.C. Morais. 2001. Patterns and correlates of interspecifi c variation in foliar insect herbivory and pathogen attack in Brazilian cerrado. J. Trop. Ecol. 17: 127-148.
Monteiro, R.C., L.A. Mound & R.A. Zucchi. 2001a. Espécies de thrips (Thysanoptera: Thripidae) no Brasil. Neotrop. Entomol. 1: 61-63.
Monteiro, R.C., L.A. Mound & R.A. Zucchi. 2001b. Espécies de Frankliniella (Thysanoptera: Thripidae) de Importância Agrícola no Brasil. Neotrop. Entomol. 1: 65-72.
Moura, M.F., M.C. Picanço, E.M. Silva, R.N.C. Guedes & J.L. Pereira. 2003. Plano de amostragem do biótipo B de Bemisia tabaci na cultura do pepino. Pesq. Agropec. Bras. 38: 1-7.
Nakashima, Y., M. Uefune, E. Tagashira, S. Maeda, K. Shima, K. Nagai, Y. Hirose & M. Takagi. 2004. Cage evaluation of augmentative biological control of Thrips palmi with
Navas, V.E.S., J.E. Funderburd, T.P. Mack, R.J. Beshear & S.M. Olson. 1994. Aggregation indices and sample size curves for binomial sampling of fl ower-inhabiting Frankliniella species (Thysanoptera: Thripidae) on tomato. J. Econ. Entomol. 87: 1622-1626.
Pedigo, L.P. 1988. Entomology and pest management. Macmillan, New York, 646p.
Pedigo, L.P., G.D. Butin & E.J. Bechinski. 1982. Flushing technique and sequential-count plan for green cloverworm (Lepidoptera: Noctuidae) months in soybeans. Environ. Entomol. 11: 1223-1228.
Pedigo, L.P. & M.R. Zeiss. 1996. Analyses in insect ecology and management. Iowa State University Press, Ames, 168p.
Rezende, J.A.M., S.R. Galleti, L. Pozzer, R.O. Resende, A.C. de Ávila & S.M.M. Scagliusi. 1997. Incidence, biological and serological characteristics of a tospovirus in experimental
fi elds of zucchini in São Paulo State, Brazil. Fitopatol. Bras. 22: 92-95.
Rosenheim, J.A., S.C. Welter, M.W. Johnson, R.F.L. Mau & L.R. Gusukuma-Minuto. 1990. Direct feeding damage on cucumber by mixed-species infestations of Thrips palmi and Frankliniella occidentalis (Thysanoptera: Thripidae). J. Econ. Entomol. 83: 1519-1525.
SAEG Análises estatísticas no SAEG. 2001. Guia do usuário, Versão 8. UFV, Viçosa, Brasil.
Schuster, D.J. 1998. Intraplant distribution of immature life stages of Bemisia argentifolii (Homoptera: Aleyrodidae) on tomato. Environ. Entomol. 27: 1-9.
Southwood, T.R.E. 1978. Ecological methods, with particular reference to the study of insect Populations. Chapman and Hall, London, 524p.
Sterling, W.L., E. Bleicher & M.M. Jesus. 1983. Um programa de manejo integrado para insetos do algodoeiro no nordeste do Brasil usando amostragem seqüencial. An. Soc. Entomol. Brasil 12: 85-98.
Taylor, L.R. 1961. Aggregation, variance and the mean. Nature 189: 732-735.
Taylor, L.R. 1984. Assessing and interpreting the spatial distribution of insect populations. Annu. Rev. Entomol. 29: 231-257.
Young, L.J. & J.H. Young. 1998. Statistical ecology: a population perspective. Kluwer Academic Publishers, Boston, 565p.