INTRODUCTION
Osteoporosis is a silent disease that is characterized by bone mineral mass reduction and deterioration of the trabecular bone microarchitecture, both of which lead to bone fragility and increasing fracture risk. With the current growing of life expectancy, osteoporosis has become a public health problem. Although the bone mass is quite important in determining the bone mechanical resistance, nowadays it is known that other factors are also important to establish the bone fracture risk of a patient. Bone mass loss has been diagnosed worldwide by measuring the bone mineral density (BMd), the gold standard for diagnosis of osteoporosis. However, the BMD relects the
quantity of bone per area. This is only one aspect of bone qua-lity. Several other factors also play a role for the bone quality, such as the bone trabecular microarchitecture.1
The osseous tissues are mainly composed of a compact surface bone called cortical bone and an internal spongy bone called cancellous or trabecular bone. The spongy aspect of this bone provides a similarity with a porous media, where the trabeculae are embedded in a marrow. Therefore, we can see the trabeculae as grains and the marrow cavities as pores, following the porous media nomenclature. In this regard, the connectivity of the trabeculae is a very important factor to establish the bone quality and fracture risk.2
he Euler-Poincaré characteristic
applied to identify low bone density
from vertebral tomographic images
Waldir L. Roque(1), Antonio Carlos A. de Souza(2) (In memoriam), denis X. Barbieri(3)Received on 03/24/2008. Approved on 01/10/09. We declare no conflict of interest.
1. PPGMAp, Instituto de Matemática, Universidade Federal do Rio Grande do Sul, Porto Alegre, Brasil.
1. PPGMAp, Instituto de Matemática, Universidade Federal do Rio Grande do Sul, Porto Alegre, Brazil.
2. Instituto de Geriatria e Gerontologia, Hospital São Lucas, PUCRS, Porto Alegre, Brasil.
2. Instituto de Geriatria e Gerontologia, Hospital São Lucas, PUCRS, Porto Alegre, Brazil.
3. Doutorando do Instituto de Geriatria e Gerontologia, Hospital São Lucas, PUCRS, Porto Alegre, Brasil.
3. Doctorate student at Instituto de Geriatria e Gerontologia, Hospital São Lucas, PUCRS, Porto Alegre, Brazil.
Correspondence to: Prof. Waldir L. Roque. Programa de Pós-Graduação em Matemática Aplicada, Instituto de Matemática – Universidade Federal do Rio Grande do Sul, Porto Alegre, RS. Zip Code: 91509-900. E-mail: [email protected]
ABSTRACT
The bone mineral density (BMD) is the gold standard test for the diagnosis of osteoporosis. Nevertheless, it is known
that only this measurement is not suficient to completely identify bone fragility and the consequent risk of fracture,
becoming necessary the investigation of the bone structure. Objectives: Evaluate if the Euler-Poincaré characteristic (EPC) for the analysis of the connectivity of the trabecular bone could supply an additional support in identifying the deterioration of the bone structure. Materials and Methods: A group of images forming dissectors were analyzed, ob-tained from the computerized tomography of the lumbar vertebrae, from which the Euler-Poincarè characteristic (EPC) was estimated. To deal with the processing of images of the dissectors, a computer program was developed using the GTK+ for MS-Windows. The results were compared to the BMD. Results: It was veriied that the measurement of the
EPC is correlated with the results obtained by means of the BMD for the lumbar vertebrae. It was also demonstrated that the area of connectivity of the trabecular that is propagated over the dissectors corroborates to ensure that the results of the EPC are consistent with the BMD measurement. Conclusions: The application of ECP in the analysis of the vertebral tomographies could constitute a method to evaluate the trabecular bone structure, and its correlation with
the mechanical resistance of the bone, however being necessary more studies to conirm this data.
The importance of the trabecular bone microarchitecture was recognized in the 1993 Consensus development Confe-rence held in Hong Kong, where osteoporosis was considered as reducing bone strength and increasing the fracture risk. Therefore, the bone strength depends on the bone density as well as the bone quality.3 As currently there is not yet a fully validated noninvasive tool for measuring the bone strength in vivo, several approaches have been investigated based on computed tomography (CT), magnetic resonance imaging (MRI) and ultrasonography to provide information about the bone quality.4-6
One way to qualitatively investigate the bone microar-chitecture is calculating some morphometric indices, known in the literature as quantitative morphometry, by means of stereological methods.7 Several morphometric parameters are computed based on 2-dimensional trabecular perimeter and area measurements, such as trabecular thickness, trabecular density, trabecular separation and trabecular skeletal length. On the other hand, the connectivity of the trabecular bone, considered as a porous media, is a topological property that provides information about the structure of the pore space. The Euler-Poincaré Characteristic (EPC) is an integral geometrical measure that can provide an estimate of the connectivity of the pore space structure. An important aspect of the EPC is that it does not change under deformation or scaling of an object. In other words, it is a topological invariant. Essentially, the EPC for a 3D structure is deined as the number of isolated parts minus the connectivity.8 The EPC is a zero dimensional quantity and as such it has to be estimated using a 3d probe. Nevertheless, it has been shown that for practical purposes the 3d probe can be approximated by a set of 2d parallel sections chosen such that no changes in the morphological structure appear in between them. These two sections form the so-called disector.9
In this paper, we will focus our attention on the application of the EPC in order to estimate the connectivity of two lumbar vertebrae, based on a set of computed tomographic images comprising a series of disectors. The central idea is to investigate how the EPC connectivity estimates can be used to distinguish between an osteoporotic bone and a healthy one, relating the indings to the BMD results. In 2nd section, we present the ma-terial and methods used in this paper and briely describe how to estimate the EPC from digital images; in the 3rd section, we present the main results and compare the EPC measurements with the results of the BMd for the corresponding vertebrae. In the 4th is devoted to conclusions and future work.
MATERIAL AND METHODS
In the present study of the trabecular connectivity, two in vitro lumbar vertebrae have been adequately selected from the subjects and prepared so that they represent clinically a healthy bone and an osteoporotic one, according to standard BMd measurements. Table 1 shows the BMd values for these two vertebrae.
For the Hologic dual-energy X-ray absorptiometry (dXA) equipment, the reference values of the BMd for the in vitro ver-tebrae indicates that values above 0.900 g/cm2 correspond to a healthy bone and below 0.700 g/cm2 correspond to an osteoporotic one. values in between correspond to a state of osteopenia. Ac-cording to this criterion, the vertebra v1 is from a control subject, while the vertebra v2 is from an osteoporotic subject (Table 1).
These vertebrae were scanned by computed tomography using the Siemens Cardiac Sensation 16 tomography equipment. The images were taken with 1000µm spacing between them, for each vertebra. From that, a sequence of 20 registered contiguous images was selected based on a careful clinical analysis, forming a set of 19 disectors (pair of sequential images). For each verte-bra, the region of interest (ROI) was chosen with 65x55 pixels by cropping the acquisition image. The ROI’s were selected under projection, taken from the interior vertebral body, next to the cortical bone. The chosen ROI’s are the clinically relevant parts as they constitute the portion of the vertebral body that irst exhibits the most signiicant loss of bone mass and issures, leading to an increase in the fracture risk. The image scale per pixel corresponds to 230µm x 230µm.
Image Processing
To deal with the image processing of the disectors, a compu-ter program was developed using GTK+ for MS-Windows. Firstly, the set of tomographic images are loaded and cro-pped to produce the set of 19 image disectors for the region of interest. These images are either automatically binarized using the InterMeans9 algorithm or by the user speciication of a threshold value. There are a number of other binarization algorithms available, but the physicians are not yet conident which one would be better suited for an automatic procedure.
Table 1
Bone Mineral density (BMd) obtained by dual-energy X-ray absorptiometry (dXA) using the Hologic QdR-4500A model
Vertebrae V1 V2
To identify the trabeculae, the image is segmented following the standard 8-neighbor pixel aggregation algorithm. We have chosen the white pixels to represent trabeculae and the black ones their complement, i.e., essentially would correspond to the red marrow bone. We shall refer to the trabecula as grain and the marrow as pore.
The computer program which has been developed includes several features that provide facilities for stereological and histomorphometrical analyses, like counting the number of trabeculae and marrow in each image, their areas, perimeters, the distribution of trabecula per area, their hydraulic radii, tra-becular circularity, tratra-becular bone volume, tratra-becular number, trabecular separation, trabecular thickness, the trabecular bone pattern factor11,12 and also the Euler-Poincaré Characteristic, that is described in the following subsection.
Euler-Poincaré Characteristic
The Euler-Poincaré Characteristic (EPC) is an important topo-logical measure of a 3d object as it provides information about the degree of connectivity of its structure.7 Such a measure is invariant under topological deformations. In simple terms, for a 3d pore-space structure, the EPC is given in terms of natural elements of the structure as:
EPC = Dv – Cv, (1)
where Dv is the number of disconnected parts of the pore space in unit volume, known as zero Betti number, and Cv is the con-nectivity per unit volume, also known as Genus or irst Betti number. The number of disconnected parts corresponds to the number of isolated objects (islands), #I, and the connectivity is expressed in terms of the number of tunnels (branches), #B, and the number of enclosed cavities (holes), #H.13-15 The connectivity number corresponds to the maximal number of cuts through an object that does not produce two disconnected objects. Objects with the same connectivity are topologically equivalent, i.e., we can deform such objects to simpler ones just by stretching and knotting, without the need of cutting. The EPC estimate is high for objects with lower connectivity and low for objects with a higher connectivity.
As shown by Gundersen et al.13 and by zhao et al.,16 the EPC can be estimated for a 3d object based on observations of any topological change of the intersections of a 2D lat surface that sweeps the whole object, and in addition this estimation is independent of the sweeping direction and orientation. In other words, it is possible to estimate the EPC through a set of
disec-tors, observing the proiles of one slice and comparing with the proiles of the next slice. In this regard, the EPC is given by:
EPC = 1/2 (#I + #H - #B), (2)
where the expression is divided by 2 due to the fact that coun-ting these quantities is made in both directions, simultaneously. By observing the differences in the appearance of the structure on the top and bottom slices it is possible to deduce the topo-logical events that occur in the disector.
vogel H-J and Kretzchmar A published15 a detailed de-duction of the EPC based on these topological events. For a disector comprised of binary images, say Di, i = 1,...,n-1, where n isthe number of sections/images, the EPC can be computed by:
EPCi = 1/2 (Ni + Ni + 1 - 2Ni ∩i + 1 + 2Li ∩i + 1 - Li - Li + 1),(3)
where Niis the total number of disconnected objects (all parts of the pore space) seen in the single binary image i, Ni ∩i + 1is the number of objects within the resulting section obtained by i ∩i + 1 intersection, Liis the total number of holes within all objects and Li ∩i + 1 is the number of holes in the intersection. The connectivity in the Di disector can be obtained through their intersection applying the logical ANd operator. In other terms, we have rewritten Equation 3 as:
EPCi= 1/2 (#PoreImi+ #PoreImi + 1 -2#PoreImi ∩i + 1 + 2#HoleImi ∩i + 1 - #HoleImi -#HoleImi + 1 ),(4)
where #PoreImimeans the number of pores in image i, # Po-reImi ∩i + 1 means the number of common pores for the images i and i+1, and a similar description holds for the holes.
To have an unbiased estimation of the EPC’s the edge effects have to be taken into account. For that we followed the standard unbiased 2-dimensional counting frame deined in the literature.13,14 The disector used in our work is a 3-dimensional probe based on binary images obtained after preprocessing the CT images. As such, we may deine in a porous media our choice for a pore or a grain, according to our own interest. Therefore, all the stereological quantities, as well as the EPC’s can be estimated for both, pores and grains.
RESULTS
Table 2
Euler-Poincaré Characteristics (EPC) values of the 19 disectors for vertebrae v1 and v2
Disector 1 2 3 4 5 6 7 8 9 10 11 12 13 14 15 16 17 18 19
EPC V1 9.5 11 13.5 18.5 13 7.5 11 5 10.5 15.5 0 -4.5 -2 2.5 3.5 0 0 4 12.5
EPC V2 30 34.5 36.5 37 34.5 34.5 24 32 38.5 36 34 38.5 31.5 29 30 27.5 26 27.5 33.5
are given in Table 1. The Euler-Poincaré Characteristics were estimated for the set of 19 disectors of each vertebra. The EPC values are shown in Table 2.
Observing the EPC values for the vertebra v2 we can see that they are always higher when compared to the same disectors of the vertebra v1. This result expresses a better connectivity of the trabeculae for the vertebra v1 than of those ones for v2. Now, considering the values of the BMd given in Table 1, we can infer that the EPC estimates are consistent with the BMD indings. As it is expected, higher values of the EPC indicate a lower connectivity, which can be a consequence of a lower number and less thickness of the trabeculae, leading to a larger space to be occupied by marrow. This is assured by the low BMd measure for v2. On the other hand, lower values of the EPC indicate a higher connectivity of the trabeculae, which can leave less space to be occupied by marrow. This can be a consequence of a bigger number and higher thickness of the trabeculae per volume. This is assured by the higher BMd measured for v1.
Considering a list formed by the EPC values for the control subject v1 (x1), and for the osteoporotic subject v2 (x2), the multiple linear regression model for the group is estimated by:
yi = β0 + β1 x 1i + β2 x 2i + β3 x 1i x 2i + εi, (5)
where yi, i = 1,...,38; are the EPC values, β0 is the intercept for the control, β1 is the slope for the control subject, x1iis the disector number in the list, β0 + β2 is the intercept for the osteoporotic subject, x2i is a dummy variable being 0 for the control and 1 for the osteoporotic subject, β1 + β3 is the slope for the osteoporotic subject, and εiis the random error.
According to this model, the computations have shown that the contribution of β3 is statistically insigniicant, as the P-value obtained was 0.22719. Thus, we neglected the β3 contribution in Equation 5. Figure 1 shows the plot of the EPC values and the corresponding multiple linear regression for the vertebrae v1 and v2. As the slope contribution provided by β3 was statistically insigniicant, the two straight lines in Figure 1 have the same slope.
In Table 3 the coeficient estimates, standard error, t-value and p-value are provided. The results of the p-value show that the control group and the osteoporotic group are statistically distinct in terms of the intercept. In other words, the EPC data can actually discern between a control and an osteoporotic subject. As an additional analysis, we have computed the values of the total areas for the connected trabeculae that propagate along the disectors, for v1 and v2 vertebrae. The results are shown in Table 4.
Looking closely at the values presented in Table 4, we can observe that the propagated areas for the vertebra v1 are always greater than those ones for the vertebra v2. As v1 has higher connectivity, it is expected that there will be a higher number and thickness of the trabeculae, and as a consequence the trabecular area on each slice of v1 will be greater than the trabecular area on each slice of v2.
Figure 2 exhibits the plots of the connected propagated areas for the trabeculae of vertebrae v1 and v2. The values are consistent with the results of the BMd measures.
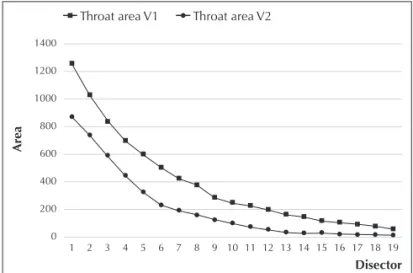
Figure 3 exhibits the plots of the throat propagated areas (tubular propagation of connected trabeculae) for the trabe-culae of vertebrae v1 and v2. This result also concurs with the EPC estimates.
Figure 4 illustrates the connectivity propagation of the area for a single trabecula and Figure 5 illustrates the throat propagation for the same trabecula along the slices.
DISCUSSION
search for better accuracy of measurements to improve the diagnosis and treatment of osteoporosis with non-invasive and more sensible resources that can provide a rapid response in the evaluation of therapeutic interventions.
In this paper we have discussed the application of the Euler-Poincaré Characteristic (EPC) to estimate the trabecu-lar bone connectivity from digital images and to analyse the bone mass loss, comparing the results with the bone mineral density (BMd) measurements for two lumbar vertebrae. The in vitro vertebrae were clinically chosen such that one was from a healthy subject and the other from an osteoporotic subject according to their clinical and BMd evaluations. For these two vertebrae, a set of computer tomographic images were taken, then selected and the regions of interest (ROI) were chosen, inally composing a set of 19 registered disectors for each one of the two vertebrae (v1 and v2).
The EPC is a known topological measure and it has been applied in other ields. It states that high values are expected when the structure has a low connectivity and low values are expected when the structure has high connectivity. Using a computer program developed in this project for computing stereological and histomorphometrical quantities, the EPC
were computed for the disectors of v1 and v2 and the values were presented in Table 2. In Figure 1 the EPC plot shows that the vertebra v1 has a much higher connectivity than the one presented by v2. This result is in full agreement with the BMd measures presented in Table 1. Although we have only a case study for two subjects, one as control and the other osteoporotic, the statistical analysis performed in terms of a multiple linear regression has shown that the two groups exhibit a distinct behavior for the intercepts (Figure 1 and Table 3). In other words, the EPC data have shown to be completely distinct for the two cases. The reader may notice that only one BMd measure is necessary to identify if a subject is or not osteoporotic.
A recent paper17 by Pothuaud et al. has discussed the application of the skeleton graphic analysis to the trabecu-lar bone microarchitecture and pointed out the distinction
Table 3
Statistical estimates for the Euler-Poincaré Characteristic (EPC) of vertebrae v1 and v2
Coefficient Estimate Std. Error t-value Pr (> |t|)
β0 11.6228 1.8357 6.331 2.83e-07
β1 -0.4728 0.1451 -3.258 0.0025
β2 25.4737 1.5898 16.023 <2e-16
Figure 3. Plot of throat propagated areas of the trabeculae for vetebrae v1 and v2. Disector
Throat area V1 Throat area V2
Ar
ea
1 2 3 4 5 6 7 8 9 10 11 12 13 14 15 16 17 18 19 1400
1200
1000
800
600
400
200
0
Figure 2. Plot of connected propagated areas of the trabeculae for vertebrae v1 and v2.
Disector
Area V1 Area V2
Ar
ea
1 2 3 4 5 6 7 8 9 10 11 12 13 14 15 16 17 18 19 1500
1250
1000
750
500
Figure 1. Euler-Poincaré characteristics (EPC) values and multiple linear regres-sion for the vertebrae v1 and v2.
Disector
EPC V1 EPC V2 LR V1 LR V2
Ar
ea
1 2 3 4 5 6 7 8 9 10 11 12 13 14 15 16 17 18 19 40
30
20
10
0
Table 4
Propagated areas of the connected trabeculae along the 19 disectors for vertebrae v1 and v2
Disector 1 2 3 4 5 6 7 8 9 10 11 12 13 14 15 16 17 18 19
EPC V1 1246 1284 1234 1237 1298 1374 1352 1389 1336 1297 1387 1457 1415 1329 1304 1373 1412 1309 1258
EPC V2 871 901 865 853 823 751 738 802 738 753 728 667 646 668 712 741 745 735 725
Figure 4. display of the connectivity propagation for a single throat along the slices.
Figure 5. Throat propagation area for the same throat along the slides.
between the estimates of the EPC for six subjects that were osteoporotic and six subjects that presented osteoarthritis. In their study, the computation of the EPC was done using a different technique than the one applied in this paper; furthermore their estimates were used to compare subjects with osteoporosis and osteoarthritis. Here our goal was to investigate if the EPC could be able to distinguish betwe-en an osteoporotic subject and a healthy one taking into account its relation with the BMd, which is currently the gold standard for osteoporosis diagnosis. In addition, to support our results, the total propagated connectivity area along the disectors for the vertebrae v1 and v2, as well as the total propagated throat area, was computed and have shown evidence that the number of trabeculae and their thickness for v1 are higher than those for v2 (Figure 2), which provides actual support to the results expressed by the EPC and BMd measures.
CONCLUSION
It is clear that these preliminary results cannot be consi-dered fully conclusive, but they look quite promising. In this regard, it seems appropriate that a more systematic study has to be conducted to see if the EPC can actually be applied as a measure capable of fully discerning the deterioration level of the trabecular bone structure and also to ind its correlation to the mechanical resistance of the bone to possibly predict the fracture risk of a subject. For that purpose, it is impor-tant that the results be compared with some morphological parameters, such as trabecular bone thickness, trabecular bone separation and trabecular bone pattern factor. These and other parameters are already implemented in the computer program and a new investigation with a larger set of bone sample is now in progress.
ACKNOWLEDGEMENTS
We would like to express our gratitude to Prof. dr. Antonio Carlos Araújo de Souza for the opportunity we had to colla-borate with him in this project. Unfortunately, he was one of the passengers victim of the fatal accident occurred with the TAM light JJ 3054 in São Paulo on July, 17th, 2007. Thanks are also due to dr. Flávio ziegelmann for discussions about the multiple linear regression model and to the reviewers that provided suggestions to improve the paper.
REFERÊNCIAS
REFERENCES
Bouxsein ML. Bone quality: Where to go from here? Osteoporos 1.
Int 2003;14:S118-27.
Cortet B, Marchandise X. Bone microarchitecture and mechanical 2.
resistence. Joint Bone Spine 2001;68:297-305.
dalle Carbonare L, Giannini S. Bone michroarchitecture as an 3.
important determinant of bone strength. J Endocrinol Invest 2004;27:99-105.
Lespessailles E, Chappard C, Bonnet N, Benhamou Cd. Imaging 4.
Cadossi R, de Terlizzi F, Canè V, Fini M, Wüster C. Assessment of
5.
Bone Architecture with Ultrasonometry: Experimental and Clinical Experience. Horm Res 2000; 54(suppl1):9-18.
Faulkner K, Popock N. Future Methods in the Assessment of Bone Mass 6.
and Structure. Best Pract Res Clin Rheumatol 2001;15:359-83. Mouton PR. Principles and Practices of Unbiased Stereology. An 7.
Introduction to Bioscientists, The John Hopkins University Press, Baltimore, USA, 2002.
Thurston WP. Three-dimensional Geometry and Topology, Princeton 8.
University Press, Princeton, USA, 1997.
Stereo dC. The unbiased estimation of number and sizes of arbitrary 9.
particles using the disector. J Microscopy 1984;134(4):127-36. Glasbey CA. An analysis of histogram-based thresholding 10.
algorithms. CvGIP: Graphical Models and Image Processing 1993;55:532-7.
dalle Carbonare L, valenti MT, Bertoldo F, zanatta M, zenari S, Realdi 11.
G, et al. Bone microarchitecture evaluated by histomorphometry. Micron 2005;36:609-16.
Chappard d, Legrand E, Pascaretti C, Baslé MF, Audran M. 12.
Comparison of eight histomorphometric methods for measuring trabecular bone architecture by image analysis on histological sections. Microsc Res Tech 1999;45:303-12.
Gundersen HJG, Boyce RW, Nyengaard JR, Odgaard A. The 13.
conneulor: Unbiased estimation of connectivity using physical disectors under projection. Bone 1993;14:217-22.
Kroustrup JP, Gundersen HJG. Estimating the number of 14.
complex particles using the conneulor principle. J Microscopy 2001;203:314-20.
vogel H-J and Kretzchmar A. Topological characterization of pore 15.
space in soil - sample preparation and digital image processing. Geoderma 1996;73:23-38.
Zhao HQ and MacDonald IF. An unbiased and eficient procedure
16.
for 3-d connectivity measurement as applied to porous media. J Microscopy 1993;172:157-62.
Pothuaud L, Porion P, Lespessailles E, Benhamou CL, Levitz P. 17.