(1) Programa de Pós-Graduação em Distúrbios da Comunicação Humana da Universidade Federal de Santa Maria – UFSM – Santa Maria (RS), Brasil. (2) Programa de Pós-Graduação em
Fonoaudiologia da Universidade de São Paulo – FOB/USP – Bauru (SP), Brasil. Sources of aid to research: CAPES, CNPq scholarships
Conlict of interest: non-existent
Maximum phonation time of /e/ and voiceless /ė/ and their
relationship with body mass index and gender in children
Tempo máximo fonatório de /e/ e /ė/ não-vozeado e sua relação com índice
de massa corporal e sexo em crianças
Carla Aparecida Cielo(1) Fernanda dos Santos Pascotini(1) Léris Salete Bonfanti Haeffner(1) Vanessa Veis Ribeiro(2) Mara Keli Christmann(1)
Received on: April 28, 2015 Accepted on: July 14, 2015
Mailing address: Vanessa Veis Ribeiro
UFSM - Av. Roraima nº 1000 - Cidade Universitária - Bairro Camobi
Prédio 26 – 4º andar – Departamento de Fonoaudiologia
Santa Maria – RS – Brasil CEP: 97105-900
ABSTRACT
Purpose: to characterize and associate the maximum phonation time of sound /e/ and voiceless /e/ (/ė/),
body mass index and gender of children.
Methods: analytical observational cross-sectional study ield and quantitative attended by 102 children
with aged between eight and 12 years (mean 9.66 years), being 53 (51.96 %) girls and 49 (48.04 %)
boys. The subjects were hearing screening, anthropometric assessment and collection of the maximum
phonation time of /e/, /ė/. Data were analyzed using non-parametric tests Mann-Whitney and Spearman
correlation, with 5% signiicance level.
Results: there was no difference of maximum phonation time of /e/, /ė/, or the relationship between them
as a function of body mass index and age, but male children showed maximum phonation time signii
-cantly of /e/ higher than girls. No correlation was found between maximum phonation time and body mass index.
Conclusion: there was no difference between maximum phonation time of /ė/, /e/ and relationship ė/e,
according to age and body mass index, and body mass index and the maximum phonation time were not correlated, showing homogeneity between measures within the group without inluence of body mass index on the maximum phonation time. As to gender, the boys presented maximum phonation time of /e/ higher than girls and only children eight years had maximum phonation time as expected.
Keywords: Health Evaluation; Child; Nutritional Status; Body Mass Index; Voice
RESUMO
Objetivo: caracterizar e associar tempo máximo fonatório do /e/ vozeado e de /e/ não vozeado (/ė/),
índice de massa corporal e sexo em crianças.
Métodos: estudo transversal observacional analítico de campo e quantitativo do qual participaram 102 crianças com idades entre oito e 12 anos (média de 9,66 anos), sendo 53 (51,96%) meninas e 49 (48,04%) meninos. Os sujeitos passaram por triagem auditiva, avaliação antropométrica e coleta dos
tempos máximos fonatórios de /e/ e /ė/. Os dados foram analisados por meio dos testes não-paramétri-cos Mann-Whitney e Correlação de Spearman, com nível de signiicância de 5%.
Resultados: não houve diferença dos tempos máximos fonatórios de /e/, /ė/ e relação ė/e em função do
índice de massa corporal e faixa etária, porém crianças do sexo masculino apresentaram tempo máximo fonatório de /e/ signiicantemente maior do que as meninas. Não foi encontrada correlação entre tempo máximo fonatório e índice de massa corporal.
Conclusão: não houve diferença entre tempo máximo fonatório de /ė/, /e/ e relação ė/e, conforme faixa
etária e índice de massa corporal, bem como o índice de massa corporal e os tempos máximos fona -tórios não se correlacionaram, evidenciando homogeneidade entre as medidas dentro do grupo, sem
inluência do índice de massa corporal sobre os tempos máximos fonatórios. Em relação ao sexo, os meninos apresentaram tempo máximo fonatório de /e/ maior do que as meninas e apenas as crianças de oito anos apresentaram os TMF tempo máximo fonatório dentro do esperado.
Original articles
492 | Cielo CA, Pascotini FS, Haeffner LSB, Ribeiro VV, Christmann MK
INTRODUCTION
In speech therapy clinical practice, one way to assess voice is by means of the maximum phonation times (MPT) that deal with the support of voiced or sound emissions (with presence of vibration / glottis sounds) and non-voiced, voiceless or deaf (without participation of a glottal source) 1-4. A measure of easy application is the ratio between non-voiced MPT/e/ (MPT/ė/) and voiced MPT/e/ (ė/e ratio), which aims to investigate the relationship between glottal eficiency and respiratory control, showing the glottal hyper-function when present, and the MPT/ė/ alone provides data on the ability to control the progressive output of air from the lung without the assistance of the vocal
folds 1,3,4. According to the literature, voiced MPT should
be approximately the same of the non-voiced MPT, resulting in a ratio around one 1,3.
Studies show that there may be intervening variables in achieving the MPT, among which stands out body mass index (BMI; or Quetelet index) and gender 5,6. In children, unlike adults, usually there is no difference in achieving the MPT since the glottal coniguration is the same in both genders 7; however, there is a study that shows that boys’ pulmonary strength is higher than girls’ 5.
Anthropometric differences, in turn, can inluence respiratory performance and voice quality due to the accumulation of adipose tissue in the nasopharynx, oropharynx, larynx, tongue and soft palate and there may be loss in performance and voice quality 8. In addition, the accumulation of adipose tissue in the abdominal and chest wall by producing excessive weight on the diaphragm can change its movement and breathing pattern, compromising voice quality. This accumulation of fat can inluence pneumo-phono-articulatory coordination, promoting an imbalance between respiratory, glottal and resonance/articulation
levels 9-12.
The literature is scarce regarding studies that show the inluence of BMI and gender on the performance of respiratory and phonation levels, and the progressive output control of lung air without the help of the vocal folds by means of sustained relaxation of the respi-ratory muscles in children. Thus, it becomes necessary to extend the research to know the possible inluences of these variables on the child’s voice.
Considering the above, this study aimed to charac-terize and associate MPT/e/, MPT/ė/, BMI and gender in children.
METHODS
The study was a ield and quantitative analytical observational cross-sectional one, approved by the Research Ethics Committee at the original institution under number 245208. The clariication necessary about the research was provided to the Municipal Secretary of Education, who signed the Institutional Authorization Form (IAF). Even before the data collection, the participants’ parents or legal guardians were asked to read and sign the Informed Consent Form (ICF).
To select a public school, a randomized draw was conducted, in which the names of the schools autho-rized by the Municipal Council of Education were placed in alphabetical order and later a draw of a target school to work at was held. Afterwards, all children of the selected school were invited to participate in the survey according to the sample selection criteria.
Inclusion criteria were: children aged between eight and 12 years (children’s age group considering the minimum age whose assessments could be under-stood and executed); both genders; parents or legal guardians’ signature on the ICF; and BMI above 18.5 kg/m2, because lower values are considered “under-weight” or “malnutrition”. Children were excluded when their parents or legal guardians reported the presence of laryngeal conditions, neurological disorders, gastric or respiratory diseases; history of speech therapy or singing lessons, for this would allow prior knowledge of the voice; presenting hearing loss detected in the audiological screening, mouth breathing, inluenza and/or respiratory diseases on the assessment days; and who were on stage three or higher of pubertal development, seeking to exclude the period of voice changes. To apply the inclusion and exclusion criteria, the parents or legal guardians answered a screening questionnaire and the children went through anthropo-metric and hearing screenings.
Maximum phonation time in children | 493
the top of the head in its middle part, without pushing it down. The cursor was set, the ruler reading was done to the nearest millimeter and the score was recorded. Height was veriied in a single veriication. From these data, the BMI was calculated by dividing the square of the body height, expressed in units of kg/m2, resulting from weight in kilograms and height in meters 13. The diagnosis of BMI was established by the BMI value found for each child and taken to the z-score distri-bution curves. For children aged ive to 19 years are considered z-score > -2 and ≤+ 1 eutrophic; z-score >+ 1 and ≤+ 2 overweight; and >+ 2 obese 13.
The pubertal development assessment was performed at a pediatric consultation, where a female doctor applied a self-assessment instrument comprising cards containing gender speciic illustra-tions of Tanner different stages of puberty (breast and pubic hair for girls; genitals and pubic hair for boys) for the individual to indicate their current maturation stage. For both genders, Tanner stage 1 is characterized by the absence of pubertal signs, whereas in Tanner stage 5 the individual is in full pubertal development14.
A hearing screening was performed by scanning the pure tones at frequencies of 500, 1000, 2000 and 4000 Hz at 20 dB, only by airway, with audiometer Amplivox model A 260/2011. The procedure was performed in a quiet room at the school, with noise level below 50 dB, veriied by sound pressure meter Instrutherm, model Dec-480. Children who did not respond to the pure tone of 25 dB were retested on other days and, where again there was no response, they were referred for a full hearing assessment and excluded from the study.
Of the 130 children who were in the sample, 15 were excluded for non-compliance from parents and legal guardians to the ICF; ive were excluded by pubertal development stage three or higher; ive were excluded due to parents or legal guardians reporting a diagnosis of mouth breathing; and three were excluded due to having a cold on the assessments. Thus, the sample consisted of 102 children, aged between eight and 12 years (mean age of 9 years and 7 months, of which eight children were eight, thirty-one children were nine, twenty-six children were ten, twenty-one children were
11 and six children were under 12), being 53 (51.96%) girls and 49 (48.04%) boys.
The collection of the MPT was held at the school, in a silent room (with background noise below 50 dB), and the children were told to issue MPT/e/ in an orthostatic position and sustainably and then perform the MPT/ė/ after deep inspiration. The MPT/e/ should be issued in usual pitch and loudness; the MPT/ė/ should be issued in the same way, but without sound. Each issue was performed three times by the children, timed in seconds (stopwatch Stop Watch model VL512) being considered as given the higher value issuing for each MPT. To establish the ė/e ratio, the highest value in seconds of MPT/ė/ was divided by the highest value in seconds of the MPT/e/ 1,4.
The expected value for the adults’ MPT/ė/ is 16 to 18 seconds 1, and lower values are suggestive of lack of expiratory control to phonation and higher ones suggest a better expiratory low control than
expected 1,3. For children, there are no reference
values; however, for the MPT/e/ and vowels in general normality is one second per year of life 7, while lower values suggest air escape to phonation and higher ones suggest glottal hypertension to phonation 3,7. In the ė/e ratio, values between 0.8 and 1.2 are expected for adults. Values above 1.2 suggest air escape to phonation and below 0.8 they suggest glottal
hyper-tension 1,3,4.
Data were tabulated and the variables were statisti-cally analyzed using nonparametric Mann–Whitney and Spearman’s rank correlation coeficient tests, with 5% signiicance level.
RESULTS
Table 1 shows the means for age group of the variables MPT/ė/, MPT/e/ and the ė/e ratio.
Table 2 shows MPT/ė/, MPT/e/ and ė/e ratio due to gender.
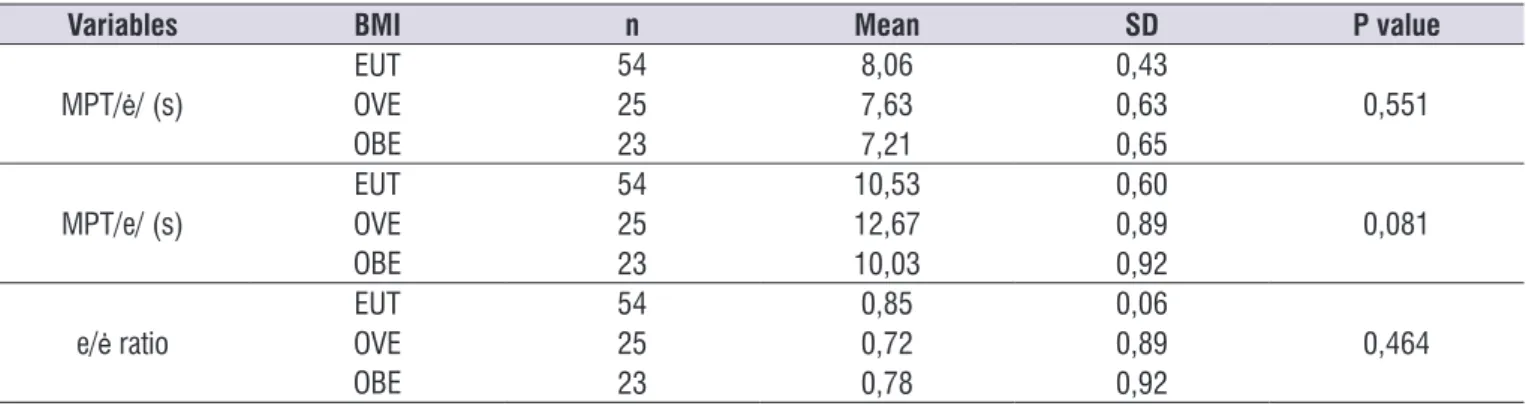
Table 3 shows MPT/e/, MPT/ė/ and the ė/e ratio due to BMI.
Table 1. Descriptive analysis of maximum phonation time of /ė/, /e/ and ė/e ratio depending on the children’s age
Age Analysis MPT/ė/ (s) MPT/e/ (s) é/e Ɨ ratio
8 years
Mean (± SD) 9,33 (±0,72) 12,23 (±1,06) 0,94 (±0,10)
Mode 7,98 # 0,70
Median 8,91 10,52 0,86
9 years
Mean (± SD) 8,04 (±3,34) 11,04 (±4,10) 0,81 (±0,51)
Mode 14,00 11,93 #
Median 7,54 10,46 0,66
10 years
Mean (± SD) 6,78 (±0,60) 10,51 (±0,88) 0,69 (±0,08)
Mode 3,93 # #
Median 5,80 9,12 0,65
11 years
Mean (± SD) 7,29 (±0,67) 10,35 (±0,98) 0,80 (±0,09)
Mode # 7,28 #
Median 7,07 10,70 0,70
12 years
Mean (± SD) 7,51 (±1,26) 8,60 (±1,84) 0,89 (±0,18)
Mode # # 0,98
Median 6,67 7,62 0,92
P value 0,108 0,437 0,480
*Statistically signiicant values (p ≤ 0.05) – Mann–Whitney test
Caption: MPT = maximum phonation time; SD = standard deviation; # = multiple modes; Ɨ = the calculation of the é/e ratio was carried out individually from the division of MPT/ė/ and MPT/e/ and for each subject, and the average was taken later; also the division of the MPT/ė/ and MPT/e/ means found in the table is not equivalent
Table 2. Analysis of body mass index, maximum phonation time of /ė/, of /e/ and of ė/e ratio by the children’s gender
Variables Gender n Mean SD P value
BMI MALE 55 19,82 0,54 0,249
FEM 49 18,94 0,52
MPT/ė/ (s) MALE 55 8,24 0,44 0,142
FEM 49 7,32 0,43
MPT/e/ (s) MALE 55 12,12 0,63 0,011*
FEM 49 9,86 0,60
ė/e ratio MALE 55 0,74 0,06 0,174
FEM 49 0,86 0,06
*Statistically signiicant values (p ≤ 0.05) – Mann–Whitney test
Caption: BMI = body mass index; MPT = maximum phonation time; SD = standard deviation; MALE = male; FEM = female
Table 3. Analysis of maximum phonation time of /ė/, of /e/ and of ė/e ratio by the children’s body mass index
Variables BMI n Mean SD P value
MPT/ė/ (s)
EUT 54 8,06 0,43
0,551
OVE 25 7,63 0,63
OBE 23 7,21 0,65
MPT/e/ (s)
EUT 54 10,53 0,60
0,081
OVE 25 12,67 0,89
OBE 23 10,03 0,92
e/ė ratio
EUT 54 0,85 0,06
0,464
OVE 25 0,72 0,89
OBE 23 0,78 0,92
*Statistically signiicant values (p ≤ 0.05) – Mann–Whitney test
Maximum phonation time in children | 495
between non-voiced phonemes and voiced phonemes, such as the ratio between MPT/s/ and MPT/z/, would not be appropriate since there is a large articulatory difference.
As for the variable gender, it can be seen that boys have shown signiicantly higher MPT/e/. Review research that gathered data on children’s pulmonary forces has shown that boys have higher values for the measures of lung function and that this difference in gender increases with the passage of age, being already observed from the age of ten 5, which may have contributed to this inding. This difference was not found in the issue of MPT/ė/, possibly because this measure also depends, in addition to lung volume and airlow, from the respiratory muscle ability to maintain a progressive relaxation during the emission and also it does not have the output control of lung air performed by glottal adduction that occurs during the MPT/e/.
A study has related the MPT to height and age of 150 children aged between eight and ten years, being 75 boys and 75 girls who underwent sustained emission of vowels /a/, /i/, /u/ and consonants /s/ and /z/. There was a positive correlation between the MPT and age and the MPT/a/ was signiicantly higher in males 2, partly corroborating the indings of this research.
Regarding BMI, there was no signiicant association between the MPT and the ė/e ratio, showing that, in the study group, BMI did not inluence the children’s vocal production and control of respiratory muscles 1,15,16. Such data converge with the data presented in the correlation analysis between BMI and MPT, showing that, despite the correlation coeficient proving negative, i.e., as BMI increases, MPT decreases, as expected, there is no statistical relevance for this inding.
A study that analyzed 54 children, divided into eutrophic and overweight, found no difference in maximal respiratory pressure between the groups. The authors explained this inding by inferring that overweight does not seem to interfere with the mechanics of muscle contraction of children aged
DISCUSSION
The issue of MPT/ė/ is performed with the same articulation position of vowel /e/, but without vibration of the vocal folds, only with sustained air output, without any noise, showing the respiratory control 1,3,4. Since it does not have an articulation obstruction in its issue, the non-voiced issue is considered the most appropriate to assess the expiratory control of the progressive air output for phonation 1,3,4.
Thus, the relationship between MPT/ė/, which assesses the respiratory level performance, and the MPT/e/, which, for being a voiced phoneme, enables the veriication of the glottal eficiency, assesses the interaction between the glottal and respiratory
levels 1,3,15,16. In this study, there was no difference
between age groups for the MPT/ė/, the MPT/e/ and the ė/e ratio.
For MPT/ė/ in adults, the only theoretical framework proposes normality between 16 and 18 seconds 1. However, ield research has found an average of MPT/ė/ of 10.43 seconds for healthy adult women 4. There are no national nor international studies that have assessed the MPT/ė/ and MPT/e/ in children; however, the literature suggests that the MPT of vowels be of one second for each year of age 2,7.
In this study, the average MPT/ė/ were found relegated to the age groups of nine, ten, 11 and 12 years; and, for the MPT/e/ they proved to be lower than expected in children aged 11 to 12 years.. As there was no statistical difference between the BMI values, this work may represent a contribution towards the search for reference values for children in the age groups studied. Of course, a larger number of studies on these aspects is required, as these results may be due to pneumo-phono-articulatory incoordination, which is common in children 7, or may even be found to be occasional, since there is no support in the literature with other works that have speciically researched the MPT/ė/ MPT/e/ in the population of the same age group. Moreover, the comparison with other links
Table 4.Correlation among body mass index, maximum phonation time of /ė/, of /e/ and of ė/e ratio in children
Variables Coeficient of correlation P value
BMI
MPT/ė/ (s) -0,136218 0,172
MPT/e/ (s) -0,040979 0,682
ė/e ratio -0,091122 0,362
between eight and 11 years17, which can support the results obtained in this research.
However, although not statistically signiicant, the overweight and obese children have presented the ė/e ratio below 0.8 and may be indicative of glottal
hyper-tension 1,3,4,15,16, probably due to reduced subglottic
airway pressure 8.
A study aimed to characterize the voice of 45 morbidly obese adults has conducted a laryngo-logical and vocal perceptual auditory assessment with Japanese GRBASI scale and also assessed the presence of late emissions in vocal fry register (maximum shortening of the vocal folds), acoustic analysis and MPT measures. Obese patients’ voices were characterized as hoarse (62%), breathy (27%) and with instability to phonation (44%). The authors attributed these characteristics to low MPT values found in obese patients, that would cause irregular vibration of the vocal folds due to reduced subglottic pressure, resulting in a hoarse and breathy voice 8.
It was also observed that individuals suffering from morbid obesity exhibited very low levels of MPT, which may be related to their excessive weight that would lead to the accumulation of fat in the larynx, causing adjustment dificulty between the larynx myoelastic forces and lung aerodynamic for an adequate voice production8.
CONCLUSION
In the group of children aged eight to 12 years of both genders studied, there was no difference between MPT/ė/, MPT/e/ and ė/e ratio according to age group and BMI, as well as BMI and the MPT not correlating, showing homogeneity among the measures within the group without inluence of BMI on the MPT. However, in relation to gender, boys presented higher MPT/e/ than girls and only eight-year-olds had the MPT as expected.
REFERENCES
1. Pinho SMR. Avaliação e tratamento da voz. (1st
ed.). In: Pinho SMR. (Org.). Fundamentos em fonoaudiologia: tratando os distúrbios da voz. São Paulo: Guanabara Koogan, 2003. p. 3-36.
2. Modolo DJ, Beraldinelle R, Brasolotto AG. Relação
entre tempo máximo de fonação, estatura e idade em crianças de 8 a 10 anos. In: Anais do 17º Congresso Brasileiro de Fonoaudiologia; 21 a 24 out 2009; Salvador, Brasil. Brasília: Sociedade Brasileira de Fonoaudiologia; 2009 [acesso em: 17
julho 2014]. Disponível em: http://www.sbfa.org.br/ portal/anais2009/resumos/R1541-1.pdf .
3. Cielo CA, Lima JPM, Gonçalves BFT, Christmann MK. Relações entre /s/ e /z/ e entre /e/ e /e/ não vozeado ou áfono. Rev CEFAC. 2013;15(5):1308-15. 4. Miglioranzi SL, Cielo CA, Siqueira MA. Relação
entre capacidade vital, tempos máximos de fonação de /e/ emitido de forma áfona, de /s/ e estatura em mulheres adultas. Rev CEFAC. 2011;13(6):1066-72. 5. Almeida CCB, Zeferino AMB, Barros-Filho AAB.
Crescimento e função pulmonar. Rev Cienc Med. 1999;8(3):85-92.
6. Beber BC, Cielo CA, Siqueira MA. Lesões de borda de pregas vocais e tempos máximos de fonação. Rev CEFAC. 2009;11(1):134-41.
7. Behlau M. Voz: o livro do especialista. (1st ed.). Rio de Janeiro: Revinter, 2001.
8. Cunha MGB, Passerotti GH, Weber R, Zilberstein B, Cecconello I. Voice Feature Characteristic in Morbid Obese Population. Obes Surg. 2011;21(3):340-4. 9. Rasslan Z, Saad Júnior R, Stirbulov R, Fabbri
RMA, Lima CAC. Avaliação da função pulmonar na obesidade graus I e II. J Bras Pneumol. 2004;30(6):508-14.
10. Bortolotti PA, Andrada e Silva MA. Caracterização da voz de um grupo de mulheres com obesidade mórbida acompanhadas no Setor de Cirurgia Bariátrica da Irmandade Santa Casa de Misericórdia de São Paulo. Distúrb Comun. 2005;17(2):149-60.
11. Lee BJ, Kim KH, Ku B, Jang JS, Kim JY. Prediction
of body mass index status from voice signals based on machine learning for automated medical applications Artif Intell Med. 2013;58(1):51-61.
12. Silvani IOFDM, Werlang A, Agne T. Avaliação
respiratória em crianças obesas e não obesas. FisiSenectus. 2013;1(2):65-72.
13. Organização Mundial da Saúde. Programas e projetos. Obesidade e sobrepeso. 2007. World Health Organization [acesso em: 18 fev 2014]. Disponível em: http://www.who.int/mediacentre/ factsheets/fs311/en/índex.html
14. Azevedo JCV, Brasil LMP, Macedo TBMA, Pedrosa LFC, Arrais LF. Comparação entre avaliação objetiva e autoavaliação da maturação sexual em crianças e adolescentes. J Pediatr. 2009;85(2):135-42. 15. Ferreira FV, Cielo CA, Trevisan ME. Força muscular
Maximum phonation time in children | 497
16. Christmann MK, Scherer TM, Cielo CA, Hoffmann CF. Tempo máximo de fonação de futuros proissionais da voz. Rev CEFAC. 2013;15(3):622-30.