(1) Pontifícia Universidade Católica de Minas Gerais – PUC-Minas, Belo Horizonte, MG, Brasil. Funding: PUC-Minas
Conlict of interest: non-existent
Study about the consequences of different sound pressure
levels emitted by Magnetic Resonance Imaging equipment
Avaliação dos níveis de pressão sonora emitidos
pelo aparelho de ressonância magnética
Eduardo Murad Villoria(1)
Luciano Andrei Francio(1)
Liliane Ribeiro Rocha (1)
Dâmares Costa(1)
Laíze Rosa Pires(1)
Paulo Isaias Seraidarian(1)
Flávio Ricardo Manzi(1)
Received on: May 25, 2015 Accepted on: October 12, 2015
Mailing address:
Flávio Ricardo Manzi
Av. Dom José Gaspar, Prédio 45 – Coração Eucarístico
Belo Horizonte – MG – Brasil CEP: 30535-901
E-mail: manzi@pucminas.br
doi: 10.1590/1982-021620161817815
ABSTRACT
Purpose: to measure the sound pressure level emitted by the magnetic resonance equipment when
working and check the hearing sensations described by individuals submitted to this exam after it has
been carried out.
Methods: the measurement of noise was conducted during image formation in this exam, by means of
an environmental noise sound pressure level meter and the application of a questionnaire for the purpose
of checking the hearing sensations presented by those individuals after the exam has been carried out. This procedure was applied to sixty individuals submitted to a magnetic resonance exam of the cranium. Results: it was found that the mean sound pressure level presented while the exam was carried out
was lower than the level of intensity considered being a risk for hearing lesions. However sensations like
buzzing, anxiety, full hearing and relief after the end of the exam were mentioned by the individuals after it
had been carried out.
Conclusion: the use of ear protectors is pertinent as a preventive measure for controlling the level of noise that affects the individual’s cochlea, thus minimizing the physical and psycho-social effects resulting from
exposure to the noise.
Keywords: Noise; Magnetic Resonance Spectroscopy; Protective Devices; Hearing Loss; Hearing
RESUMO
Objetivo: mensurar o nível de pressão sonora emitido pelo aparelho de ressonância magnética em
fun-cionamento e veriicar as sensações auditivas descritas pelos indivíduos submetidos a este exame após
a realização do mesmo.
Métodos: foi realizada a mensuração do ruído produzido, durante a aquisição das imagens, por meio de
um medidor de nível de pressão sonora (decibelímetro) e a aplicação de um questionário com a inalidade de veriicar as sensações auditivas apresentadas por estes indivíduos após a realização do exame. Tal procedimento foi aplicado a 60 indivíduos submetidos ao exame de ressonância magnética do crânio. Resultados: o nível de pressão sonora média apresentada durante a realização do exame foi inferior ao nível de intensidade considerado como risco para lesões auditivas. No entanto, sensações como zum
-bido, ansiedade, plenitude auricular e alívio após o término do exame foram citados pelos indivíduos após a execução do mesmo.
Conclusão: é pertinente o uso de protetores auriculares como medida preventiva para o controle do nível de ruído que atinge a cóclea do indivíduo, minimizando desta forma os efeitos físicos e psicossociais
decorrentes da exposição ao ruído.
Descritores: Ruído; Espectroscopia de Ressonância Magnética; Equipamentos de Proteção; Perda Auditiva; Audição
Original articles
INTRODUCTION
The magnetic resonance imaging (MRI) can cause various biological effects when the patient subjected to its execution has been exposed to high sound pressure levels. Several individuals reported feeling headaches, chest pain, fatigue, dizziness, loss of appetite, insomnia
and rash. These effects can be justiied by the acoustic
noise produced during magnetic resonance imaging1.
The magnetic resonance imaging is a test that
uses imaginologic electromagnetic ield in imaging,
emitting non-ionizing radiation2,3. The received signals
are converted into numerical values and reconstructed by computers in axial segmental images, plus coronal, sagittal and oblique views2.
The magnetic resonance imaging equipment consists a magnet system (magnets), coils (trans-mitter and receiver antennas of radio frequency) and a set of computers. The examination is harmless and painless. For forming the images the patient settles within a large magnet that generates the main magnetic
ield. Other additional magnets are used to generate secondary magnetic ields that will guide the location
and thickness of the segment to be searched. The coil system emits radiofrequency waves (megahertz or MHz) that will excite the tissue hydrogen protons of the segment and, when stopped the stimulation, radiofre-quency waves are released, which will be captured by receivers and processed by the computer, thus forming the image2,4,5.
There are two types of images processed during the examination. Both are called weighted images. The
irst is T1, called spin-lattice relaxation time, which is
more used for the evaluation of regular structures. The second is T2, or spin-spin relaxation used to evaluate
pathological conditions like inlammation, cysts or
neoplasm6. During the formation of the weighted
images there is noise generation, and this presents variation in the sound pressure level during the realization of examination2.
Noise can be classiied according to the sound
pressure level (SPL) presented, and the decibel (dB), the logarithmic unit normally used. SPL is characterized by means of subjective levels. Thus, noise comprises the intensity range from 0 to 19 dB SPL ranks the very quiet level. From 20 to 39 dB SPL intensity ranks the silent level. The quiet intensity level comprises a range
between 40 and 59 dB SPL. The noise classiied as
moderate level is with SPL ranging from 60 to 79 dB.
The subjective noise classiied as noisy range from 80 to 99 dB SPL. The very loud level of classiication is
between 100 and 129 dB SPL. The auditory threshold of discomfort is located at this level, approximately,
from 120 dB SPL of intensity. The last level is classiied
as thunderous and covers intensity levels ranging from 130 to 150 dB SPL. It is the threshold of hearing pain. Noise in these intensities are considered intolerable and through a simple exposure it can cause irreversible hearing loss (HL)7,8.
However, the harmful effects of excessive audible noise are not just limited to the auditory organ and it can cause changes in the organic homeostasis, acting through the autonomic nervous system with conse-quences for organs and systems controlled by the central nervous system, such as cardiovascular and endocrine9. According to some authors, short periods
of noise exposure to sound pressure levels between 90 and 100 dB in normotensive and hypertensive patients, leads to increased blood pressure, on average, 3.3% to 10 7%10. At the hearing, noise can cause a decrease
of the thresholds at high frequencies and distortion of acoustic signals of speech and can damage a large extent the auditory pathways from the eardrum to regions of the central nervous system. In the organ of Corti the main changes occur which are respon-sible for hearing loss induced by noise because their outer hair cells are extremely sensitive to high and prolonged sound pressure, with subsequent enzymatic and energy reduction, as well as decreased oxygen
and nutrients. With cell death the space is illed by
scar formation, causing the permanent loss of hearing ability11,12.
Given the proven organic noise changes on the individual’s body, the realization of this study aimed to measure the sound pressure level emitted by the MRI machine for examination of the skull and verify the auditory sensations described by patients after completion of the examination, since it is not common the hearing protection in Diagnostic Imaging centers.
METHODS
This study was approved by the Ethics and Research
Committee of the Pontiical Catholic University of Minas
Gerais (CEP: 142). This study was conducted with 60 individuals (30 women and 30 men), aged between 32-65 years old, who underwent the examination of magnetic resonance imaging of the skull in the Diagnostic Imaging Center of Mother Teresa Hospital.
skull examinations were performed was the Siemens brand Magneton Vision Plus model, which operates at 1.5 Tesla. To complement the data we used a question-naire to obtain information on the hearing of patients before and after the examination.
The measurement of sound pressure level (SPL) of the noise was performed with the decibel meter positioned 60 cm away from the MRI equipment.
The survey was conducted with the decibel meter positioned with the decibel selector switch in the “C”
position. This position allows a curve of lat response
being recommended for the measurement of generated noise by a determined equipment or machine. The intensity scale used was the “Hi” ranging from 65 to 130 dB with the response time switch in the FAST option “F”. This option allows a 200ms response time, simulating the response time of the human ear.
For each skull MRI performed were measured 20 intensities in SPL, divided into four moments of
the examination. The irst moment is the examination
stage where there is no image production. The second moment is the stage where there is production of weighted images T2. The third moment is the stage of the examination in which the instrument calibration occurs. The fourth moment is the examination stage where there is production of weighted images T1. For every moment were recorded 05 SPL. Each exami-nation had an average duration of thirty-two minutes.
For analysis of the results, it was obtained the average of each measured moment, subsequently generating the achievement of the global average of the examination. This procedure was performed for
each of the four moments, obtaining as the inal result
four global values (no image GV, T2 GV, calibration GV, T1 GV). The global values were submitted to an
average, achieving the inal result in SPL. The results were tabulated and submitted to ANOVA statistic test with 5% signiicance level. The application of the
questionnaire to the patient happened after the exami-nation. The results were obtained through a percentage analysis.
RESULTS
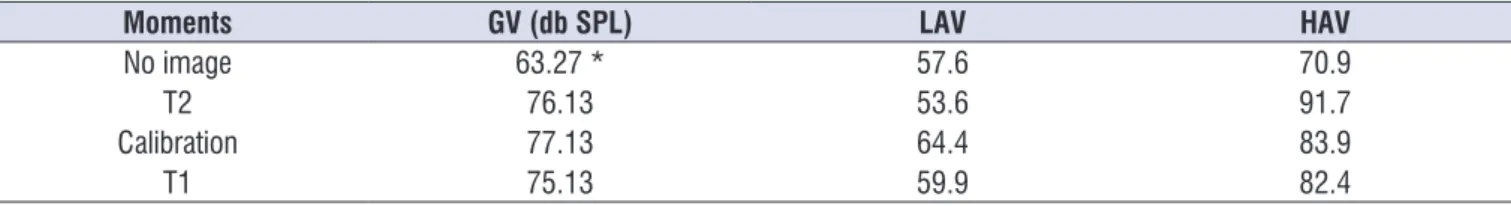
Table 1 shows the global values in SPL obtained in each moment. It is worth mentioning that the values obtained for the no image moment are steadily on the examination. The lowest global value in SPL is repre-sented by the without image moment (63.27 dB SPL) and the highest value in SPL is represented by the calibration moment (77.13 dB SPL). It was found also that the no image moment showed a lower statistically
signiicantly difference (p < 0.05) when compared with
other moments. And the remaining moments do not differ from each other (p > 0.05) (Table 1).
Table 1. Average of global values (Sound Pressure Level), the lowest absolute value and the highest absolute value in the four examination moments by magnetic resonance imaging of the skull, expressed in Decibels - Sound Pressure Level
Moments GV (db SPL) LAV HAV
No image 63.27 * 57.6 70.9
T2 76.13 53.6 91.7
Calibration 77.13 64.4 83.9
T1 75.13 59.9 82.4
Global Value (GV), Decibel (dB), Sound Pressure Level (SPL), Lowest Absolute Value (LAV), Highest Absolute Value (HAV) * Statistically signiicant by ANOVA test (p < 0.05)
In relation to the applied questionnaire, it has been
veriied that all the analyzed individuals (100%) reported
no hearing impairment before the examination. Most patients (52 patients - 86.7%) reported feeling of auricular plenitude, followed by symptom relief after the completion of the examination. Forty-eight individuals (80%) reported feeling anxiety during the examination and twenty-eight individuals (46.7%) reported tinnitus during the examination.
DISCUSSION
Considering that noise is a mixture of non-harmonics sounds, which can cause besides an unpleasant sensation, damage a person’s health, especially hearing aid, it has become big the concern with regard to exposure to high SPL, especially the occupa-tional7,8,13. However, despite advances in knowledge
commonly found on the workplace and currently be present in the environment of large cities, investments in its control are scarce and localized7,14-16.
It is known that the noise effects do not have relation only to their physical characteristics and the exposure
time. Other physical changes such as fatigue, inter -ference in communication, tinnitus, nervousness or
irritation, attention deicit, headaches and changes in
the cardiovascular system may be submitted, taking into account individual factors (individual susceptibility to noise, psychological factors, resonance of external auditory canal and general health) and external factors (vibration, environmental temperature, exposure to chemicals and medicinal drugs) 13,17-19.
Among the above mentioned changes highlight the tinnitus as one of the indications that the individual has been exposed to an overly strong sound stimulus. In some cases it may present as a symptom of a temporary hearing loss13,17,18. In this study it was found
46.7% of this symptomatology, saying this mentioned condition.
Thus, exposure to non-occupational noise has become an object of research, since the increase of its noise levels has been considerable in the last years7,20.
So this study aims to increase interest about the need for preventive action in relation to non-occupational noise, in this case the noise made by the MRI scanner during the examination.
The NR-15 norm of the 3,214 / 78 decree of Brazilian
law deines the limits of daily maximum exposures
to certain noise levels. For 8 hours of exposure the allowed sound level is 85 dB, 4 hours of exposure (90 dB), 2 hours of exposure (95 dB), 1 hour exposure (100 dB), ½ hour of exposure (105 dB), ¼ hour of exposure (110 dB). This determination is used to occupational noise controls7,17,20.
The comparison of the inal result of this study (72.91
dB SPL), found in the measurement presented during the magnetic resonance imaging of the skull, with the
subjective level of classiication of noise by the average intensity values in dB classiies the noise present during
the execution of examination at a moderate level. This
same classiication was found when considering the
SPL expressed by the global value of each moment presented in Table 1.
The lowest and highest absolute values found for the without image moment (57.2 dB to 70.9 dB) can
be classiied as moderate noise level; T2 moment
presented peak of noise and the level of which was
classiied as noisy (91.7 dB SPL), overtaking the danger
zone for hearing harmfulness; the calibration moment presented level rotation varying from moderate level (64.4 dB SPL) to the noisy level (83.9 dB SPL). But the T1 moment had presence of the lowest absolute value classifying the subjective level of noise as quiet (59.9 dB SPL), varying with the highest absolute value for the noisy level (82.4 dB SPL).
Considering the inal result found (72.91 dB SPL),
the measured noise presented minimal risk for hearing loss induced by high levels of sound pressure, as this is presented below, both the amount considered risk (85 dB SPL) and the exposure time to hearing damage. However, despite the low risk of irreversible hearing damage, the noise exposure control requires the use of hearing protection with restriction of choice, since this protection must not contain any induced ferric metal in its composition15,21-23.
As for the changes reported by patients examined by magnetic resonance imaging of the skull, through the provided questionnaire after the examination, it was found that the noise generated by the MRI machine can cause hearing and / or temporary psychosocial changes. However, it should be considered that any invasive procedure or not in which the patient should stand still, lying on a stretcher that slides inside a chamber (magnet) where there will be emission of sounds at different intensities with an average duration of 32 minutes generates discomfort and anxiety to the patient, regardless of the length of the test of time and the noise intensity.
Although the main intervention in the prevention of hearing, physical and / or psychosocial changes caused by noise should be primary, that is, act in suppressing the responsible agent, it can be used as
a speciic strategy, hearing protection for noise control,
since its function covers the reduction of SPL that reach the individual cochlea14,20-22.
The noise reduction mechanism for the use of hearing protection works as a barrier which reduces sound waves that come by air to the tympanic
membrane20-22. This attenuation has an average of
31.3 dB SPL. It is worth mentioning that in ideal condi-tions of use, the hearing protector which acts by air does not attenuate more than 40-50 dB at more treble frequencies. However, this performance will depend on the involvement of the physical characteristics of the protector and its relationship to the ear as well as the anatomical and physiological limitations of the user21-23.
3. Willian RS. Sistemas de imagens digitais com
aplicabilidade na Odontologia [monograia]. Porto Alegre (RS): Universidade Federal do Rio Grande do Sul. Faculdade de Odontologia, Curso de Especialização em Radiologia Odontológica e
Imaginologia; 2011.
4. Mazzola AA. Ressonância Magnética: princípios de formação da imagem e aplicações em imagem funcional. Rev Bras Fis Med. 2003;3(1):117-29. 5. McMahon KL, Cowin G, Galloway G. Magnetic
resonance imaging: the underlying principles. J
Orthop Sports PhysTher. 2011;41(11):806-19.
6. Foltz WD, Jaffray DA. Principles of Magnetic Resonance Imaging. Radiat Res. 2012;177(4):331-48.
7. Russo PCI. Noções gerais de acústica e psicoacústica. In: Nudelmann AA, Costa AE, Seligman J, Ibañes NR, editores. PAIR: Perda auditiva induzida pelo ruído. Rio de Janeiro: Revinter; 2001. p. 134-40.
8. Russo PCI. Bases Físicas da Fonação. In: Russo PCI, editor. Acústica e psicoacústica aplicadas à fonoaudiologia. São Paulo: Lovise; 1999. p. 143-78. 9. Almeida SIC. Efeitos lesivos do ruído e implicações
legais. Acta Awho. 1998; 12(3):121-7.
10. Kwitko A, Pezzi RG, Silveira MS. Exposição a ruído ocupacional e pressão sangüínea. Rev Bras
Otorrinolaringol. 1996;62(2):89-98.
11. Oliveira JAA. Prevenção e proteção contra perda auditiva induzida por ruído. In: Nudelmann AA, Costa EA, Seligman J, Ibanes RN, organizadores. PAIR Perda Auditiva Induzida por Ruído. Rio de Janeiro: Revinter ;2001. p.17-44.
12. Araujo SA. Perda auditiva induzida pelo ruído em trabalhadores de metalúrgica. Rev Bras
Otorrinolaringol. 2002;68(1):47-52.
13. Souza MA, Pennacchi SMPL, Silva BCP, Ferreira AJV. Prevalência do zumbido como sintoma da perda auditiva induzida por ruído ocupacional. Rev CEFAC. 2002; 4(3):195-8.
14. Basso BV, Campos LA, Thiesen J. Estudo da alteração temporária do limiar auditivo em trabalhadores expostos ao ruído. Rev CEFAC. 2003;5(2):187-91.
15. Manzoni TCRC. Saúde auditiva no trabalho: Um estudo sobre a perda auditiva ocupacional e sua prevenção. Rev CEFAC. 2000;2(2):7-14.
16. Pires MGS, Rodrigues PH, Sampaio CCC, Rodrigues CG. Medida do nível de pressão the precast plug and molded plug models. The hearing
protector of precast plug type is available in standard sizes adapting to the ear canal of several people. It is
made of lexible material such as vinyl and silicon. The
molded plug model adapts to the individual’s conduct by its use, it is modeled by the user directly into the ear canal. This model can also be manufactured in the following materials: cotton, silicone or foam. It is imperative that hearing protectors used during the examination of magnetic resonance imaging of the skull do not contain any metal tool, as this material has
attraction to the generated magnetic ield during the
examination, causing interference in carrying it out15,24.
Applying the average value of provided attenuation by hearing protection, it turns out that the intensity of
noise in SPL would reduce to 41.61 dB SPL the inal
result of 72.91 dB SPL, with the use of this equipment during the examination. Thus, the subjective noise level according to the average intensity values would run through the moderate level to the quiet level. Therefore auditory symptoms reported by patients before the application of the questionnaire would be minimized, since the SPL in dB would decay with the intensity of the use of hearing protection.
CONCLUSION
Considering the obtained results in this study, by measuring the SPL emitted by the device that performs the scan by magnetic resonance image of the skull, and as for the symptoms reported by patients subjected to such examination, it is relevant the use of hearing protectors while performing the MRI scan since it will promote the reduction of SPL that reach the cochlea of the patient. In this way, both the auditory symptoms as the physical and psychosocial symptoms from noise exposure, would be eliminated and / or minimized resulting improvement in the diagnosis quality of the examination and the patient’s proprioceptive during its
realization as the inal result found does not offer risk of
irreversible damage to the auditory system.
REFERENCES
1. Lufkin RB. Manual de Ressonância Magnética. 2 ed. Rio de Janeiro: Guanabara Koogan; 1999.
2. Koch HA, Ribeiro ECO, Tonomura ET. Radiologia na formação do médico geral. In: Koch HA, Ribeiro
ECO, Tonomura ET. Ressonância magnética. Rio
sonora em um centro urbano. J Bras Fonoaudiol. 2002;3(13):263-6.
17. Marchiori MLL, Melo JJ. Comparação das queixas auditivas com relação à exposição ao ruído em
componentes de orquestra sinfônica. Pró-fono R
Atual Cient. 2001;13(1):9-12.
18. Nudelmann AA, Costa AE, Seligman J, Ibañez NR. PAIR- Perda auditiva induzida pelo ruído. 2 ed. Rio de Janeiro: Revinter; 2001.
19. Dreossi FCR, Santos MMT. Investigação sobre o efeito do ruído na inteligibilidade de fala de crianças da quarta série do ensino fundamental. Rev Soc Bras Fonoaudiol. 2004;9(3):136-43.
20. Vansin R, Ferreira AJ. Avaliação da alteração temporária do limiar auditivo em jovens frequentadores de casas noturnas. Rev CEFAC 2002;(4):219-22.
21. Avagliano A, Almeida K. Estudo do desempenho de diferentes tipos de protetores auditivos. Rev CEFAC. 2001;3(1):77-87.
22. Fantazzini ML. Controle de exposição ao ruído através do uso de protetores auriculares:
veriicação da proteção oferecida por meio de índice de proteção acústica. Rev Bras Saúde Ocup.
1989;(17):3-50.
23. Ferreira PA, Peloggia SCC, Pirinoto FH, Bernardi
APA. Inluência da conservação do protetor
auricular na prevenção da perda auditiva induzida por níveis de pressão sonora elevados. Rev CEFAC. 2003;5(4)353-9.