Original article (short paper)
Neural adaptations in isometric contractions with
EMG and force biofeedback
Francisco Locks
Federal University of São Carlos, São Carlos, Brazil
Heleodório Honorato dos Santos Luis Carlos Carvalho Lígia Raquel Ortiz Gomes Stolt José Jamacy de Almeida Ferreira Federal University of Paraíba, João Pessoa, Brazil
Abstract—This study aimed to evaluate the quadriceps femoris neural adaptations during isometric contractions using force and electromyogram (EMG) signals as visual biofeedback. Forty-two participants were randomly assigned to three groups: EMG group, tested with EMG biofeedback; Force group, tested with force biofeedback; and Control group, tested without biofeedback. Evaluations were performed pre (baseline) and post-tests to determine the maximum force and EMG amplitude during maximal voluntary isometric contraction (MVIC). The tests consisted of series of MVICs in which the participants were encouraged to surpass the force or EMG thresholds determined at baseline. The vastus
lateralis EMG amplitude and knee extensor force increased signiicantly in all groups when compared the baseline and
post-test evaluations values (p < .05). EMG percentage gain was signiicantly different between Force and Control groups (p < .01), while force percentage gain was not different between groups. Force biofeedback was more effective in producing neural adaptations.
Keywords: electromyography, feedback, knee, quadriceps muscle
Resumo—“Adaptações neurais em contrações isométricas com biofeedback EMG e de força.” Este estudo avaliou as
adaptações neurais do quadríceps durante contrações isométricas usando os sinais de força e eletromiograia (EMG)
como biofeedback. Quarenta e dois sujeitos foram distribuídos em três grupos: EMG, testado com biofeedback da EMG; Força, testado com biofeedback de força; e Controle, testado sem biofeedback. As avaliações foram realizadas pré/pós-testes para determinar a máxima força e amplitude EMG durante contrações isométricas voluntárias máximas (CIVM). Os testes consistiram em séries de CIVM onde os sujeitos foram encorajados a ultrapassar os limiares de força e EMG
inicialmente determinados. A amplitude EMG do vasto lateral e a força extensora do joelho aumentaram signiicativa -mente em todos os grupos quando comparadas as avaliações pré e pós-testes (p < 0,05). A porcentagem de ganho EMG
foi signiicativamente diferente entre os grupos Força e Controle (p < 0,01), enquanto que a porcentagem de ganho da força não foi diferente entre os grupos. O biofeedback de força foi mais efetivo em produzir adaptações neurais.
Palavras-chave: eletromiograia, feedback, joelho, músculo quadríceps
Resumen—“Adaptaciones neurales en contracciones isométricas con biofeedback EMG e de fuerza.” Este estudio evaluó las adaptaciones neurales de cuádriceps durante contracciones isométricas usando los signos de fuerza y elec-tromiografía (EMG) como biofeedback. Cuarenta y dos sujetos fueron divididos en tres grupos: EMG, probado con biofeedback EMG; Fuerza, probado con biofeedback de fuerza; y control, probado sin biofeedback. Las avaluaciones se realizaron pre/post pruebas para determinar la máxima fuerza y amplitud EMG durante contracciones isométricas voluntarias máximas (CIVM). Las pruebas consistieron en series de CIVM en que los sujetos fueron encorajados a cruzar el umbral de fuerza y EMG inicialmente determinados. La amplitud EMG del vasto lateral y fuerza de los extensores
de la rodilla aumentó signiicativamente en todos los grupos al comparar las avaluaciones pre y post pruebas (p < 0,05).
El porcentaje de ganancia EMG fue signiicativamente diferente entre los grupos Fuerza y control (p < 0,01), mientras
que el porcentaje de aumento de la fuerza no fue diferente entre los grupos. Biofeedback de fuerza fue más eicaz en
producir adaptaciones neurales.
Introduction
In sports and physical rehabilitation, athletes and health professio-nals are constantly looking for innovative ways to improve physical function. Among these resources, biofeedback techniques are frequently used to maximize physical performance (Campenella, Mattacola, & Kimura, 2000). Some instruments, such as elec-tromyography and force transducers, have been used to directly or indirectly evaluate muscle internal and external forces in research. Those instruments are based on non-invasive, painless procedures that allow easy measurement reproducibility (Dvir, 2004).
Therefore, biofeedback can be deined as a technique that uses
instrumentation to make evident biological signals originated from physiological processes, which acts as a feedback mechanism to shape and control intensity and duration of previously established physiological responses (Dursun, Dursun, & Alican, 2004). Its utilization provides the individual the ability to have multiple stimuli (such as visual and auditory) that add up to facilitate and enhance learning and motor response (Huang, Wolf, & He, 2006).
This approach satisies the requirement of a therapeutic envi -ronment that enhances sensory stimuli and inform participant about the consequences of their actions and allows adaptation strategies (Wann & Turnbull, 1993). Biofeedback has its clinical application based on the attempt to re-educate motor control, providing visual or auditory feedback based on positional, force or electromyogram (EMG) parameters in real time (Fernando & Basmajian, 1978).
Neural mechanisms underlying biofeedback eficacy are not
clear. Wolf (1983) suggested that visual and auditory feedback activate unused or under-utilized synapses in the execution of motor commands. Thus, their use could establish new sensory engrams and help participants to perform tasks without feedba-ck. In general, this technique can increase neural plasticity as it engages auxiliary sensory inputs, making it a plausible tool for motor training and rehabilitation.
Studies evaluating biofeedback’s inluence on muscle trai -ning commonly uses EMG and force parameters as stimuli tools (Brentano, Silva, Cadore, & Kruel, 2007; Häkkinen, Aleu, et al., 1998; Häkkinen, Kallinen, et al., 1998). The literature points that electromyographic feedback improves muscle recruitment and provides force gain (Bandy & Hanten, 1993; Croce, 1986). The use of visual stimuli through force signal, provides muscle strength gains and improves motor control as it reduces force va-riability during maximal contractions (Baweja, Patel, Martinke-wiz, Vu, & Christou, 2009; O’Sullivan & O’Sullivan, 2008).
Despite the widespread use of both signals as biofeedback for muscle training, for the best of our knowledge, there are no comparative studies in the literature determining which of these signals proves more effective to produce neural adaptations during
isometric tests. It is known that EMG signal is inluenced by the
distance from de motor units (MUs) to the surface electrodes,
while force signal is not. Furthermore, only supericial MUs
contribute to electromyographic signal, while all MUs contribute to the force signal (Merletti et al., 2010). Thus, an increasing linear characteristic is expected for the force signal, while the EMG signal has a linear relationship with the force signal until the complete recruitment of MUs and above this limit it reaches a plateau (Fuglevand, Winter, & Patla, 1993; Merletti et al., 2010).
Thus, the aim of this study was to evaluate neural adaptations of the quadriceps muscle during isometric contractions using force and EMG signals as visual biofeedback. For this purpose the mean of the low-pass envelope (LPE – mV) and the generated muscular force (kgf) will be used as EMG and force parameters for evalua-ting the expected adaptations. Moreover, this study aims to test the hypothesis that force signal—used as visual biofeedback during isometric tests—provides a greater gain in muscle force and muscle activation of the vastus lateralis when compared to EMG signal.
Methods
Participants
Forty-two healthy females (22.8 ± 2.1 years, 57.4 ± 7.5 kg, 1.63 ± 0.7 m, 21.8 ± 2.5 kg/m2) participated in this study. As inclusion criteria, participants had to be: 1) aged between 18 and 25; 2) physically active; 3) with no history of lower limb injury or knee surgery; 4) with no neurological impairment and/or visual and
auditory uncorrected deicits.
The sample was randomly assigned into three groups of 14 participants each: EMG Group, tested with electromyographic biofeedback; Force group, tested with force biofeedback; and Control group, which was tested without the use of biofeedback.
The groups did not differ signiicantly with respect to age, body
weight, height and body mass index.
All participants were informed about the objectives of the study and signed an informed consent before enrolling in the trial. The study is in accordance with Resolution 196/96 of the CNS/Brazil and the Declaration of Helsinki for research involving human beings, and has also been previously approved by the Research Ethics Committee of the Federal University of Paraíba under the protocol number 163/08.
Instruments
For knee extensor force measurements, a system consisting
of a Bonett chair ixed with a force transduction device (strain
gage) was placed in the resistance arms of the chair. This system
consists of a load cell and an ampliier bridge excited by the
force applied to the internal rod of the instrument. Strain gages
have gage factor (K) equal to 2.01 and resistance of 350 Ω.
EMG was acquired simultaneously with the quadriceps force
measurement, using a biological ampliier with a coniguration based on instrumentation ampliier (INA 221, Texas Instruments),
which has a high ratio of common mode rejection (> 90 dB), high impedance input (10 MW), low noise (<5 mV RMS), band-pass
10-490 Hz, and gain up to 3000 times. The ampliied signals were
sampled at a frequency of 1000 Hz and digitized by an A/D con-verter board of 16 channels with a resolution of 12 bits per channel.
Procedures
2003) to identify their physical activity level. Then, they were examined by a physical therapist to check the clinical status of the lower limbs and, if considered suitable for inclusion in the study, were randomly assigned to one of three research groups.
For the evaluations, all participants were subjected to skin shaving and cleaning with alcohol before attaching the EMG electrodes. Surface electrodes (Skintact, Leonhard Lang GmbH,
Austria) were ixed in a bipolar coniguration, placed at 2/3
on the line from the anterior spina iliaca superior to the lateral side of the patella, distant 2 cm apart on the belly of the vastus
lateralis muscle of the dominant limb (deined as the limb of
preference to kick a ball), according to the recommendations of SENIAM (Hermens, Freriks, Disselhorst-Klug, & Rau, 2000). The vastus lateralis was chosen because it is considered to be representative of the whole knee extensor group (Alkner, Tesch, & Berg, 2000). The reference electrode was placed on the ipsilateral tibial tuberosity.
Before the procedures with biofeedback, all participants engaged in a warm-up period on a cycle ergometer (Ergo-Fit, Cycle Ergo 167, Pirmasens, Germany) for 5 minutes with a 20 Watts load at 20 km/h, in order to warm the muscles for exercise.
Data acquisition
The knee extensor force and the vastus lateralis muscle EMG were recorded during the initial evaluation (baseline) and testing with biofeedback (post-test) and control. At baseline, there was no auditory or visual stimulation, only a verbal command to start and end the contraction, and the force and EMG signals were recorded from three maximal voluntary isometric contractions (MVICs) lasting 6 seconds, taken with a 120 seconds interval between each contraction.
To record the force and EMG signals, participants were
positioned sitting with the trunk leaning and ixed hip angle at 100° of lexion, both stabilized with straps. Knee extension
force was applied in a support system positioned at the distal and anterior portion of the leg, just above the ankle. The volunteers were instructed to make the greatest possible effort to extend the knee continuously for 6 seconds, exerting pressure against
the power arm of the chair, ixed at the preset tibiofemoral angle
of 120º (Brughelli, Cronin, & Nosaka, 2010; Seger, Arvidsson, & Thorstensson, 1998).
During signal acquisition, at all stages, the EMG was rectiied and iltered with a 0.5 Hz digital low-pass ilter (2nd order Butte -rworth), and the mean of the low-pass envelope (LPE – mV) was presented in real time on the monitor screen during contraction.
The force signal was also iltered (low pass 5 Hz – 2nd order
Butterworth) and its mean (kgf) also displayed in real time on the monitor screen. The mean EMG LPE and force signals were updated and displayed on the monitor every 0.5 seconds.
The data were saved and analyzed ofline to determine the
mean value of the EMG LPE and force during 1 second of the highest MVIC, recorded at baseline. These values were used as the threshold to be exceeded by the volunteers during testing. The software used to acquire and process the force and EMG signals was the BioMed application, developed by the
Labo-ratory of Biomedical Instrumentation and Biological Signals Processing (Carvalho et al., 1998).
Biofeedback tests
The biofeedback tests were performed on the same day of the initial evaluation, after a 10 minutes rest period. The proto-col used for EMG and Force groups consisted of 2 quadriceps MVICs series with an interval of 120 seconds between each MVIC. Between each series there was a 180 seconds rest period
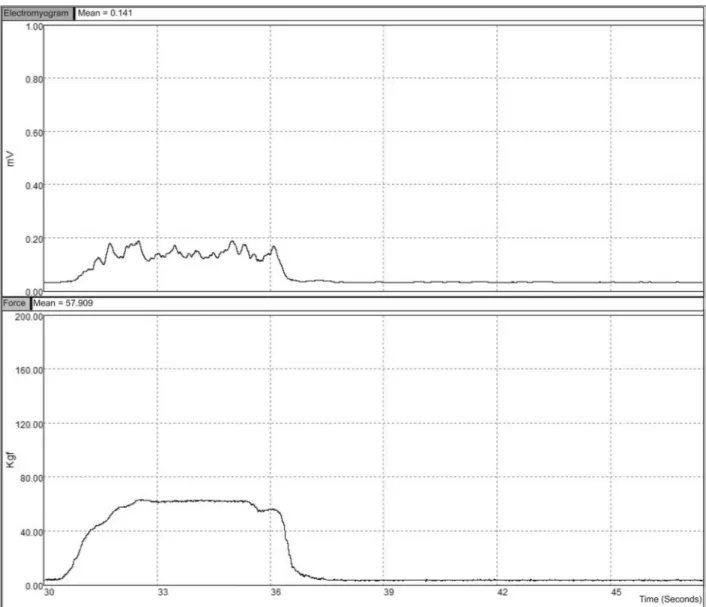
to avoid muscle fatigue. On the irst series, the threshold used as
visual biofeedback was the average EMG LPE or muscle force obtained at baseline, for EMG and Force groups, respectively. The volunteer was previously asked to try to overcome this threshold leading up by the signals curves and the values of the EMG LPE or force shown on the monitor screen during contractions (Figure 1), both updated and displayed on the monitor every 0.5 s. During all procedures, visual gain was standardized for all participants, ranging from 0 to 1 mV for EMG group and from 0 to 200 kgf for Force group. On every new series, the threshold was adjusted by adding 10% to the value reached in the previous series. In case of the participant was unable to exceed the set threshold, on the next series, a new attempt was made with a 5% decrease in the adjusted threshold, and if she was unsuccessful in overcoming this threshold, the test was terminated at this point.
On the other hand, if the volunteer could exceed the new threshold, the next series were increased by 5% until she could not exceed the threshold, and the test terminated at this point. The control group was subjected to maximum force testing without visual biofeedback stimulation, and the test was terminated when the individual did not succeed, in two con-secutive contractions, exceeding the thresholds with the same increments used for EMG and Force groups. For all groups no verbal stimulation was used, only a command to start and end the contraction was used.
The data were stored and analyzed ofline to determine the
mean EMG LPE and force, so that these mean values were used as references to determine the gain in EMG LPE and muscle force between the baseline and post-test with biofeedback.
Statistical analysis
The dependent variables of this study were the EMG LPE and the quadriceps force at baseline and post-test. To compare the trai-ning performance among groups the variable gain was calculated.
Gain was deined as the percentage increase between baseline and
post-test. The normality and homogeneity of variances of the data
were veriied by the Shapiro-Wilk and Levene tests, respectively.
In this aspect, the baseline and post-test mean force as well as the LPE gain had normal distribution, while the baseline and post-test LPE mean and the force gain had a non-normal distribution. Then, a paired t-test was performed to compare the baseline and post-test mean force and a one-way ANOVA was performed to evaluate the
EMG LPE (mV)
Group Baseline Post-test z p
EMG 0.124 ± 0.008 0.149 ± 0.008 -3.108 .002 Force 0.097 ± 0.006 0.130 ± 0.009 -3.297 .001 Control 0.098 ± 0.011 0.111 ± 0.016 -2.639 .008
Force (kgf)
Group Baseline Post-test t df p
EMG 55.38 ± 11.75 67.05 ± 18.95 -3.419 13 .005 Force 54.52 ± 12.03 72.65 ± 19.45 -4.704 13 .000 Control 53.77 ± 15.89 60.42 ± 21.82 -2.187 13 .048 EMG values are presented as median ± standard error (SE); Force values are presented as mean ± standard deviation (SD)
Table 1. Intragroup variation of the EMG amplitude (LPE, low-pass envelope) and muscle force.
On the other hand, to compare the baseline and post-test LPE mean, a Wilcoxon test was performed. For all these procedures we
adopted a signiicance level of 5 % (p < .05). The gain analysis of the force was made by the Kruskal Wallis test, with Mann Whitney post hoc in order to locate differences among groups. In this case,
the Bonferroni correction was applied (adjusted α = α/number of comparisons) and the level of signiicance was set at p < .016. A one-way ANOVA was conducted to determine differences between groups considering the IPAQ activity level. All statistical proce-dures were performed using SPSS 17.0 software for Windows.
Results
All participants were classiied as active according to the IPAQ classiication. Means (± SD) for the three groups were:
783.7 (± 298.6) MET-minute.week-1 for the EMG group, 916.2 (± 167.4) MET-minute.week-1 for the Force group, and 850.4 (±128.7) MET-minute.week-1 for the Control group. No statistical
difference was identiied between groups (F = 0.787, p = .468).
No difference among groups was identiied on baseline for
all analyzed variables (p > .05). Comparison of the EMG LPE,
intragroup, between baseline and post-test showed a signii -cant increase for the EMG, Force and Control groups (Table 1). A comparison of intragroup isometric force also showed a
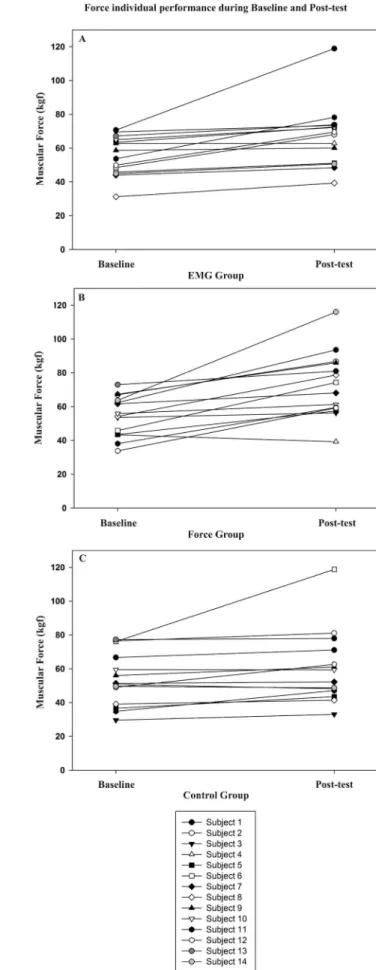
signiicant increase for the three groups (Table 1). Figures 2
and 3 demonstrate the individual performance in each group, as well as the group variability for both EMG LPE and force measurements.
Figure 2. EMG low-pass envelope (LPE) individual performance and variability during baseline and post-test for EMG group (A), Force group (B) and Control group (C).
A comparison of the percentage gain of the LPE among
groups showed that the Force group showed signiicant differen -ce only from the Control group (Table 2). Comparisons between EMG and Force and between EMG and Control groups showed
no signiicant difference. With regard to the comparison of the percentage force gain among groups, no signiicant difference
was observed among groups (Table 2).
Discussion
The results of this study show three important aspects: 1. The electromyographic activity of the vastus lateralis muscle
and knee extensor force increased signiicantly within the same
session of isometric tests; 2. Only biofeedback that used the
force signal showed a signiicant difference in percentage gain
in EMG amplitude when compared to the Control group; 3. The force gain was not affected by the type of visual feedback used.
In the present study, the increase in EMG amplitude can be explained by a possible increase in the recruitment of motor units
and iring rate provided by the repeated maximal contractions in
all groups. In this sense, electromyographic assessments during MVICs before and after resistance training have been used to evaluate neural adaptation. These records indicate that trained muscles recruit a greater number of motor units and have a
higher iring rate during a maximal contraction compared with
untrained muscles (Aagaard & Mayer, 2007; Sale, 1988). Although it was observed an increase in EMG amplitude in all groups, EMG biofeedback was not able to distinguish its increase beyond that shown by the Control and Force groups. However, the tests were always performed at the level of ma-ximal contraction in healthy individuals and Eloranta (1989) reported that EMG signal does not follow the force increase linearly when it is performed at maximum levels. The elec-tromyographic signal reaches a plateau at submaximal levels, while the force signal shows an increasing linear characteristic with increasing force.
Comparison with other studies was not possible because there were no studies with similar methodology in the literature. Furthermore, studies using only EMG or force signal separately suggest that muscle training with biofeedback can increase both EMG (Hald & Bottjen, 1987; Lucca & Recchiuti, 1983) and
force (Bandy & Hanten, 1993; Croce, 1986; Hald & Bottjen, 1987; Hobbel & Rose, 1993; Lucca & Recchiuti, 1983) levels.
Bandy and Hanten (1993), who performed an isometric quadriceps training of 107 healthy women over a period of eight weeks, using visual biofeedback based on EMG parameters,
observed a signiicant increase in EMG and peak torque levels
of the knee when compared to the control that was not trained. Croce (1986), who tested the isokinetic force of the quadriceps femoris, in a study with EMG biofeedback, found that a 5-week training protocol also yielded gains in both variables when compared to the control trained without biofeedback.
Our results are supported by Lucca and Recchiuti (1983), who analyzed the combination of electromyographic biofee-dback and isometric exercises and observed an increase in knee extensor peak torque. However, these authors used a 19-day training period. The presented studies (Bandy & Hanten, 1993; Croce, 1986; Lucca & Recchiuti, 1983) used a chronic training, which does not comply with the training method used in this study which was performed in order to evaluate acute effects of muscle adaptation to biofeedback.
In the present study, the EMG gain was normalized as a function of the ratio between the post-test data and the baseline values. It is worth mentioning that the EMG analysis performed in this study was based on the low pass envelope of the EMG data, which is known to cancel the positive and negative phases of motor unit potentials that compose an EMG signal. In this sense, it is reported on the literature that this cancellation may result in loss of EMG signal (Farina, Cescon, Negro, & Enoka, 2008; Keenan, Farina, Maluf, Merletti, & Enoka, 2005). Howe-ver, normalizing the signal with maximal activation increases
the reliability of the measurement and allows the identiication
of neural strategies from the EMG signal (Keenan et al., 2005) With respect to the use of force biofeedback, it was the only type of visual feedback to show percent gain in EMG, as well as improvement in the EMG LPE and force values from baseline. On the other hand, it was not able to provide percent increase in muscular force. In our initial hypothesis, the force signal, in its continuously upward trajectory, would be able to provide an increased recruitment of MUs, which would translate into a differential increase in force compared to the other groups.
Although no statistical difference was identiied between Force
group and the other groups regarding the force gain, it was found
borderline signiicance values in favor of using the force signal
as visual biofeedback.
Several studies using training and evaluation with force bio-feedback showed an increase in peak torque when performing maximal and/or submaximal isokinetic contractions (Campe-nella et al., 2000; Hald & Bottjen, 1987; Steyn, Goslin, Booysen, Terblanche, & Wyk, 2002). However, the EMG activity was not considered in these evaluations. O’Sullivan and O’Sullivan (2008) showed gains in muscle force in isokinetic evaluations with the use of force biofeedback in a study with 22 women. However, it is worth noting that beyond the visual feedback, verbal stimulation was also adopted, method not used in our study. In this regard, studies have shown that the use of verbal
encouragement signiicantly increases performance between
5% and 39% (Bickers, 1993; McNair, Depledge, Brettkelly, & EMG Gain
Group Mean ± SD ANOVA F Pair p
EMG 20.36 ± 20.17
5.858
EMG x Force .053
Force 42.17 ± 31.18 EMG x Control .647
Control 12.27 ± 14.58 Force x Control .006
Force Gain
Group Median ± SE χ2 Pair z p
EMG 15.44 ± 3.02
6.454
EMG x Force -1.195 .232
Force 31.45 ± 3.1 EMG x Control -1.654 .098
Stanley, 1996). Therefore, to the best of our knowledge, this is
the irst study to present the isolated effect of the visual feedback
based on force signals on muscular force and EMG amplitude. A recent study showed that the sensibility of the visual gain
can inluence the motor behavior and muscle performance (Lai
-ne, Yavuz, & Farina, 2014). These authors assessed the inluence
of visual gain using force tremor, measuring the ability to control a certain level of contraction. The tests were performed with
10% of MVIC which requires a more reined motor control
and it is also a level of muscle contraction in which there is
a predominance of recruiting slow twitch ibers (Henneman,
1957; Mendell, 2005). In our study, we used maximal voluntary
contractions, which recruits all muscle ibers and assess the
ability to generate force and maximum recruitment of motor units was measured. Thus, we believe that such methodologies,
despite evaluating the inluence of a visual stimulus, assess and
measure different variables and strategies.
The individual variability presented on Figures 2 and 3 shows a considerable variation of the EMG LPE and force
levels. However, this variability was not signiicantly different
from all groups prior to the biofeedback tests. It is known that there is an expected variability of force and electrical muscle activity during MVC, higher for the EMG activity. This can
be explained by the physiological luctuations in the number
and rate of activated motor units and by the nature of the EMG signal as a random process (Pincivero, Green, Mark, & Campy, 2000; Yang & Winter, 1983).
It is not known if the force signal may be effective on mus-cles with high level of incapacity or functional disability in order to monitor muscle performance. Thus, further studies should
be conducted in order to test the eficiency of the use of force
as biofeedback training in participants with chronic functional
and muscular deicit. Additionally, this lack of control of the
visual gain, based on individual parameters, or that allowed the EMG group to have a similar amount of stimulus as the Force group is a limitation of our study and we believe that further investigations should control this variable and analyze its impact on biofeedback response.
This study appears to be the only one that compares the use of force and EMG signals as biofeedback to evaluate the acute effect of muscle adaptation to this type of stimulation. It should be noted that this study used healthy participants with normal muscle contraction ability and cannot extrapolate these results to muscles with varying degrees of disability. It should also be pointed that we only conducted the experiment with females, which is a limitation of this study as we cannot generalize this results to males. The evaluations and testing procedures were conducted only in isometric conditions. In this sense, we believe that experiments should be carried in dynamic or isokinetic conditions as they are more functional.
The eficacy analysis of the EMG and force signals as bio -feedback for isometric training, in the experimental conditions of this study, suggests that the use of force as a biological signal
results in better performance than the use of EMG. This inding
may have great applicability in physical training and rehabilitation since the force signal has a simpler acquisition and processing and it is also subject to less interference than the EMG signal.
References
Aagaard, P., & Mayer, F. (2007). Neuronal adaptations to strength training. Deutsche Zeitschrift Für Sportmedizin, 58, 50–53. Alkner, B. A., Tesch, P. A., & Berg, H. E. (2000). Quadriceps EMG/
force relationship in knee extension and leg press. Medicine and Science in Sports and Exercise, 32, 459–463.
Bandy, W. D., & Hanten, W. P. (1993). Changes in torque and elec-tromyographic activity of the quadriceps femoris muscles following isometric training. Physical Therapy, 73, 455–465.
Baweja, H. S., Patel, B. K., Martinkewiz, J. D., Vu, J., & Christou, E. a. (2009). Removal of visual feedback alters muscle activity and reduces force variability during constant isometric contractions. Experimental Brain Research, 197, 35–47.
Bickers, M. J. (1993). Does verbal encouragement work? The effect of verbal encouragement on a muscular endurance task. Clinical Rehabilitation, 7, 196–200. Brentano, M. A., Silva, E. M., Cadore, E. L., & Kruel, L. F. (2007). Electromiographic signal reliability analysis during maximum and submaximum knee isometric actions. Revista Portuguesa de Ciências Do Desporto, 7, 308–312. Brughelli, M., Cronin, J., & Nosaka, K. (2010). Muscle architecture
and optimum angle of the knee lexors and extensors: a comparison
between cyclists and Australian Rules football players. Journal of Strength and Conditioning Research, 24, 717–721.
Campenella, B., Mattacola, C. G., & Kimura, I. F. (2000). Effect of visual feedback and verbal encouragement on concentric quadri-ceps and hamstrings peak torque of males and females. Isokinetics and Exercise Science, 8, 1–6.
Carvalho, L. C., Lima, R. B., Duarte, N. B., Fernandes, M. R., Nó-brega, A. C., & Batista, L. V. (1998). Software em Windows para processamento, armazenamento e análise de sinais obtidos em
experimentos de isiologia. In 1th Congreso Latinoamericano de
Ingeniería Biomédica (pp. 207–210).
Craig, C. L., Marshall, A. L., Sjöström, M., Bauman, A. E., Booth, M. L., Ainsworth, B. E., … Oja, P. (2003). International physical activity questionnaire: 12-country reliability and validity. Medicine and Science in Sports and Exercise, 35, 1381–1395.
Croce, R. V. (1986). The effects of EMG biofeedback on strength acquisition. Biofeedback and Self-Regulation, 11, 299–310. Dursun, E., Dursun, N., & Alican, D. (2004). Effects of biofeedback
treatment on gait in children with cerebral palsy. Disability and Rehabilitation, 26, 116–120.
Dvir, Z. (2004). Isokinetics: muscle testing, interpretation and clinical applications (2nd ed.). Edinburgh: Churchill Livingstone. Eloranta, V. (1989). Patterning of muscle activity in static knee
ex-tension. Electromyography and Clinical Neurophysiology, 29, 369–375.
Farina, D., Cescon, C., Negro, F., & Enoka, R. M. (2008). Amplitude cancellation of motor-unit action potentials in the surface elec-tromyogram can be estimated with spike-triggered averaging. Journal of Neurophysiology, 100, 431–440.
Fernando, C. K., & Basmajian, J. V. (1978). Biofeedback in physical medicine and rehabilitation. Biofeedback and Self-Regulation, 3, 435–455.
Fuglevand, A. J., Winter, D. A., & Patla, A. E. (1993). Models of re-cruitment and rate coding organization in motor-unit pools. Journal of Neurophysiology, 70, 2470–2488.
Häkkinen, K., Aleu, M., Kallinen, M., Izquierdo, M., Jokelainen, K., Lassila, H., … Newton, R. U. (1998). Muscle CSA, force produc-tion, and activation of leg extensors during isometric and dynamic actions in middle-aged and elderly men and womenet al. Journal of Aging and Physical Activity, 6, 232–247.
H., Mälkiä, E., … Alen, M. (1998). Changes in agonist-antago-nist EMG, muscle CSA, and force during strength training in middle-aged and older people. Journal of Applied Physiology, 84, 1341–1349.
Hald, R. D., & Bottjen, E. J. (1987). Effect of Visual Feedback on Maximal and Submaximal lsokinetic Test Measurements of Normal Quadricem - and Hamstrings. The Journal of Orthopaedic and Sports Physical Therapy, 9, 86–93.
Henneman, E. (1957). Relation between size of neurons and their sus-ceptibility to discharge. Science (New York, N.Y.), 126, 1345–1347. Hermens, H. J., Freriks, B., Disselhorst-Klug, C., & Rau, G. (2000).
Development of recommendations for SEMG sensors and sensor placement procedures. Journal of Electromyography and Kine-siology, 10, 361–374.
Hobbel, S. L., & Rose, D. J. (1993). The relative effectiveness of three forms of visual knowledge of results on peak torque output. The Journal of Orthopaedic and Sports Physical Therapy, 18, 601–608. Huang, H., Wolf, S. L., & He, J. (2006). Recent developments in
biofe-edback for neuromotor rehabilitation. Journal of Neuroengineering and Rehabilitation, 3, 11.
Keenan, K. G., Farina, D., Maluf, K. S., Merletti, R., & Enoka, R. M.
(2005). Inluence of amplitude cancellation on the simulated surfa
-ce electromyogram. Journal of Applied Physiology, 98, 120–131. Laine, C. M., Yavuz, S. U., & Farina, D. (2014). Task-related changes
in sensorimotor integration inluence the common synaptic input
to motor neurones. Acta Physiologica, 211, 229–239.
Lucca, J. a, & Recchiuti, S. J. (1983). Effect of electromyographic biofeedback on an isometric strengthening program. Physical Therapy, 63, 200–203.
McNair, P. J., Depledge, J., Brettkelly, M., & Stanley, S. N. (1996). Verbal encouragement: effects on maximum effort voluntary muscle action. British Journal of Sports Medicine, 30, 243–245. Mendell, L. M. (2005). The size principle: a rule describing the
recruit-ment of motoneurons. Journal of Neurophysiology, 93, 3024–3026. Merletti, R., Aventaggiato, M., Botter, A., Holobar, A., Marateb, H., & Vieira, T. M. M. (2010). Advances in surface EMG: recent progress in detection and processing techniques. Critical Reviews in Biomedical Engineering, 38, 305–345.
O’Sullivan, A., & O’Sullivan, K. (2008). The effect of combined visual feedback and verbal encouragement on isokinetic concentric perfor-mance in healthy females. Isokinetics and Exercise Science, 16, 47–53. Pincivero, D. M., Green, R. C., Mark, J. D., & Campy, R. M. (2000).
Gender and muscle differences in EMG amplitude and median frequency, and variability during maximal voluntary contractions of the quadriceps femoris. Journal of Electromyography and Kinesiology, 10, 189–196.
Sale, D. G. (1988). Neural adaptation to resistance training. Medicine and Science in Sports and Exercise, 20, S135–S145.
Seger, J. Y., Arvidsson, B., & Thorstensson, a. (1998). Speciic effects
of eccentric and concentric training on muscle strength and mor-phology in humans. European Journal of Applied Physiology and Occupational Physiology, 79, 49–57.
Steyn, B., Goslin, A., Booysen, C., Terblanche, P., & Wyk, G. V. (2002). The effects of visual feedback and verbal encouragement as modes of psychological motivation on isokinetic concentric leg extension test result. African Journal for Physical, Health Education, Recre-ation and Dance, 8, 334–346.
Wann, J. P., & Turnbull, J. D. (1993). Motor skill learning in cere-bral palsy: movement, action and computer-enhanced therapy. Baillière’s Clinical Neurology, 2, 15–28.
Wolf, S. L. (1983). Electromyographic biofeedback applications to stroke patients. A critical review. Physical Therapy, 63, 1448–1459 Yang, J. F., & Winter, D. A. (1983). Electromyography reliability
in maximal and submaximal isometric contractions. Archives of Physical Medicine and Rehabilitation, 64, 417–420.
Authors’ note
Francisco Locks ([email protected]) is afiliated with the De
-partment of Physical Therapy, Federal University of São Carlos, São Carlos, SP, Brazil.
Heleodório Honorato dos Santos ([email protected]) is afiliated
with the Department of Physical Therapy, Federal University of Para-íba, João Pessoa, PB, Brazil.
Luis Carlos Carvalho ([email protected]) is afiliated with the De
-partment of Physical Therapy, Federal University of Paraíba, João Pessoa, PB, Brazil.
Lígia Raquel Ortiz Gomes Stolt ([email protected]) is
afiliated with the Department of Physical Therapy, Federal University
of Paraíba, João Pessoa, PB, Brazil.
José Jamacy de Almeida Ferreria ([email protected]) is afiliated
with the Department of Physical Therapy, Federal University of Para-íba, João Pessoa, PB, Brazil.
Corresponding author
José Jamacy de Almeida Ferreira Federal University of Paraíba
Centro de Ciência da Sáude, Departamento de Fisioterapia Cidade Universitária, João Pessoa, PB 58051-900, Brazil Telephone: 55 83 3216 7183/ 3216 7718
e-mail: [email protected]
Manuscript submitted on February 17, 2014 Manuscript accepted on December 31, 2014